

Abstract
Frontier market banks fill key funding gaps in the markets they serve, resulting in increased evaluation (a positive) and earnings management (EM) (a negative). Examination of a large sample of banks in 22 frontier market countries from 2001 to 2018 reveals a downward trend in efficiency, indicating that loan quality issues persist despite increasing economic growth in the respective countries. Using stochastic frontier analysis to quantify efficiency and random effects and truncated regression to investigate the EM-efficiency relation, this study demonstrates that efficiency is negatively associated with EM. Furthermore, there was no clear relationship between bank size and efficiency, which counters economic efficiency theory and implies that frontier market banks absorb higher non-performing loan costs. The findings herein support prospect theory by demonstrating that managers engage in risk-seeking behaviour while making risk-averse decisions. Overall, the study's implications suggest that banks employ alternative loan provision practices to optimise resource allocation and, by extension, performance.
Keywords: Stochastic frontier analysis, Earnings management, Frontier markets, Performance evaluation, Banking, Income smoothing
Stochastic frontier analysis; Earnings management; Frontier markets; Performance evaluation; Banking; Income smoothing
1. Introduction
Bank behaviour in frontier markets is markedly different from that in developed markets. Due to the lack of a well-defined market, weak regulatory enforcement, lax property rights, regulatory divergence, and the absence of state-owned banks, the transfer of knowledge from developed countries to frontier markets may be dubious (De, 2003; Altunbas et al., 2001; Sufian and Kamarudin, 2014b). In frontier markets, commercial banks with high debt loads dominate the financial sector (Odell and Ali, 2016), and solvency is not an uncommon concern as widespread macroeconomic impacts have caused some banks to report significant negative outcomes (Grant and Wilson, 2012).1 Because frontier market banks often serve as financial intermediaries and agents of economic growth in markets in which they operate, the degree of income smoothing (a form of earnings management (EM)) deserves particularly close attention to ensure its practice does not mask performance shortfalls.
To mitigate performance shocks brought about from loan losses, banks provision for credit defaults, yet under provisioning practices that expose banks to financial difficulties, are concerning (Ozili, 2017a; Leika et al., 2020; IMF, 2020). The issuance of preferential loans, ineffective loan penalties, and weak loan management has presented challenges in loan recovery – an essential component for a banking institution (Abebe, 2020), and contributed to a 2014 G20 summit resolution that included stricter global financial disclosure requirements (Thiemann, 2014). The International Monetary Fund (IMF) has also expressed significant concerns about the under-provisioning practices that expose banks to unforeseen defaults or economic shocks (Ozili, 2017a; Leika et al., 2020; IMF, 2020), and research has shown loan provisioning to be a tool to manage earnings (Peterson and Arun, 2018). Conversely, accumulating loan reserves during strong business cycles keeps banks lending in down cycles and reduces business cycle intensity (Dolar, 2019).
Examining of EM practices ensures accurate and informative reporting (Choi et al., 2017). This paper examines its relationship between EM and efficiency in the frontier market banking sector from 2011 - 2018. The objective is to determine whether EM adversely impacts efficiency, for a decline in efficiency will stifle a firm's growth and erode the firm's competitiveness (Kamarudin et al., 2020). EM's association with efficiency is particularly important in a market where banks predominately fill funding gaps (Vo, 2020), and the lack of funding can impede development and expansion (López Salazar et al., 2012).
This study is the first to examine the EM-efficiency relationship in frontier equity markets comprehensively. To this end, this study's contribution to current empirical research is fourfold. First, the decomposition of technical efficiency through three inputs and two outputs is an important addition to the current bank efficiency research and helps identify efficiency trends by time and region. Second, the linkages between income smoothing and bank efficiency, examined via fixed effects, and truncated regression estimation, validates loss provisioning tools as income smoothing vehicles on bank efficiency and shows it to be adversely correlated with efficiency. Third, this paper finds bank efficiency consistent across large and small banks, indicating that scale economy is not a factor in efficiency. Fourth, examining frontier markets in isolation enables specific identification of market policy efficacy and regulatory requirements.
The remainder of this study is organised as follows. Section 2 reviews prior literature and outlines the development of this study's hypotheses. Section 3 describes the research design and data. Section 4 presents and discusses empirical results. Section 5 provides additional analysis with control variables. Section 6 concludes with key observations, theoretical and practical implications, and recommendations for future research.
2. Related research and hypotheses development
2.1. Frontier market contextual setting
Frontier markets are distinct from emerging or developed markets (FTSE, 2020; MSC1, 2019); as such, this study is wholly dependent on MSCI's frontier market classifications. The frontier market classification is less dependent on gross national income (GNI) or economic size and more dependent on the political and market environment. To qualify as a frontier market country, the country must score between ‘partially’ and ‘modestly’ in terms of the depth and breadth of its financial markets, legal and regulatory infrastructure, and the ease with which foreign investors can do business (MSCI, 2019). To reference the size of frontier markets, combined, they account for approximately 11 per cent of the world's population yet only 0.43 per cent and 0.11 per cent of the world's nominal GDP and market capitalisation.2 5-year returns of the MSCI Frontier Market Index3 diverged by 55.6 per cent from the S&P Index; the latter posted positive returns, while the former posted negative.4 Divergent market returns support Speidell and Krohne (2007)'s finding of low correlation between frontier and developed markets. Frontier markets also have low integration levels with world markets (Chen et al., 2014; Martens et al., 2020), and the spillover effects from developed markets to global markets provide an opportunity for diversification (Yavas and Rezayat, 2016).
In 2011, frontier markets had a combined market value of 715 billion USD; emerging-markets, the next step in economic development, had a market value of 20 trillion USD (Speidell, 2011). In 2016, the World Bank estimated frontier market capitalisation at 1.04 trillion USD (Bank, 2020). Increased development and idiosyncratic growth in frontier markets can reward investors with significant returns (or losses); however, upside returns can be stymied when firms manage their earnings to present the appearance of consistent profits or smooth earnings. EM compromises investor protection, capital market stability, and macroeconomic growth (Leuz et al., 2003).
Frontier markets are vulnerable to capital outflows that could jeopardise macroeconomic performance, an issue heightened following the 2008 Global Financial Crisis ((GFC) (Abidi et al., 2016). Despite this weakness, capital continues to flow to nations with better growth prospects and lower costs. Many foreign investors have directly invested in frontier markets due to their young and growing populations, a boom in trade, investment and technological catch-up potential, rapid mobile communications penetration, abundant natural resources, and a growing middle class (Speidell, 2011). These factors combined attest to the growth potential of frontier markets.
Following the Asian Financial Crisis and GFCs of 1997 and 2007-2008, many institutional reforms followed. Reforms altered banks' daily operations (Tek Wei Saw et al., 2020), enabled foreign institutions to participate in domestic markets, introduced diverse and sophisticated financial products, and increased demand for accounting and auditing standards (Noble and Ravenhill, 2000; Duffie, 2018). Barriers to geographic expansion and interest rate ceilings were also eliminated. Reformed regulatory practices and global governance institutions are essential dynamics in regulating business groups (Young, 2013), and from reforms, commercial banks have experienced substantial competition from in-state and out-of-state banks (Wu, 2010). Banks that can thrive in this environment offer stability and resilience - traits particularly important in frontier markets where banks are the foremost credit providers.
2.2. Efficiency studies in the frontier markets sector
The theory of resource allocation states that businesses maximise capital to exploit opportunities in resource-constrained environments and is therefore useful in comprehending the informality of emerging economies (Webb et al., 2013). Similarly, Kumbhakar et al. (2001) argue that a company must be technically efficient to archive economic efficiency. To examine bank efficiency is to assess the proximity of its costs to a best-practice, holding output constant at current levels (Berger and Mester, 1997). Increasing competition heightens the need for increased efficiency, profitability, and intermediated fund flow (Djalilov and Piesse, 2016). A bank's response to increased competition depends on how efficiently they utilise their constrained resources (Mester, 1996).
Country-specific research studies demonstrate a number of performance influences. In Vietnam, bank efficiency was not statistically different between pre and post public offerings (Nguyen et al., 2016). In Pakistan, Islamic banks' technical efficiency was lower than that of conventional banks when measured in terms of constant return to scale (Gishkori and Ullah, 2013). In Kenya, public sector banks displayed greater efficiency than private sector banks (Miencha et al., 2015). In Bulgaria, private banks exhibited greater efficiency over state-owned banks, and that European Union (EU) membership is associated with significant efficiency improvements (Tochkov and Nenovsky, 2011). In Nigeria, approximately 25 per cent of the country's banks are inefficient despite mergers and acquisitions, whereas market power positively impacts efficiency (Ajao and Ogunniyi, 2010). In Jordan, bank asset size and employee numbers adversely impact bank efficiency (Bdour and Al-khoury, 2008). In Croatia, foreign-controlled banks are the most efficient, and new banks outperform older banks (Jemric and Vujcic, 2002).
Research examining bank efficiency in transition economies5 finds that consolidation increases bank efficiency and that international institutional investor participation positively impacts profit efficiency and reduces insider ownership (Lin and Fu, 2017). Kamarudin et al. (2017)'s multi-country Southeast Asian study discovered that foreign-owned banks were slightly more efficient than domestically owned banks; however, the difference was not statistically significant. Olson and Zoubi (2011)'s Middle East and North African (MENA) country study revealed MENA banks to be slightly less cost-efficient than European banks but similar to banks in developing economies. Mlambo and Ncube (2011) found that South African bank efficiency trended upward between 1998-2008, despite a declining number of efficient banks. Additionally, Johnes et al. (2014)'s mixed-development study6 found greater inefficiency in Islamic banks than conventional banks, and the degree of inefficiency increased over the global financial crisis. In a separate MENA bank study, Sufian and Akbar Noor Mohamad Noor (2009) found a positive correlation between size, capitalisation, and profitability with efficiency. Chipalkatti and Rishi (2007) found that weaker Indian banks7 have an incentive to under-provision their loan losses and understate gross non-performing assets to increase capital adequacy ratios. The authors also find strong evidence that weaker banks understate their non-performing assets. In a somewhat related study, Arora et al. (2018) find no relationship between non-performing assets and a bank's technical efficiency, and note that a gap in technology is significant source of inefficiency.
The volume of literature on bank efficiency reflects its importance in academia and industry. As frontier markets develop, they tend to liberalise and allow foreign entrants, thereby boosting competitive forces (Arshad et al., 2019). Improved efficiency and productivity gains are bank goals in competitive markets and become additional information sources on bank performance. Efficiency measurements help establish realistic targets during an organisation's development by highlighting performance constraints (Kamau, 2011).
2.3. Efficiency measurements
Efficiency measurement is a central concept in production economics (Devine et al., 2018). The application of an ‘efficient frontier’ is a more rigorous measurement of efficiency than financial ratios because statistical techniques remove price effects and other exogenous market factors (Emrouznejad and Yang, 2018). Exogeneity may violate conventional linear regression assumptions (Zainal et al., 2020), and thus significant progress has been made in quantifying the maximum output for given a set of inputs8 since Cobb and Douglas (1928)'s seminal work. As a result, best practice studies are generally divided between parametric and non-parametric approaches. Parametric measurement approaches require a particular frontier function specification, a specification not required for the non-parametric approach (Murillo-Zamorano and Vega-Cervera, 2001). A common non-parametric approach, data envelopment analysis (DEA), imposes less structure on the frontier function but does not allow for random errors (Battese et al., 2000). Conversely, the main advantages of stochastic frontier analysis (SFA), a parametric approach, are the allowance of measurement errors and the generation of firm-specific estimates (Ding and Sickles, 2018). The SFA approach additionally distinguishes inefficiency from random errors, thereby avoiding biased results. SFA additionally enables the formal statistical testing of hypotheses and the establishment of confidence intervals (Hjalmarsson et al., 1996).
While Kamarudin et al. (2013) suggest that the DEA approach is preferred, a dual-method comparison of bank efficiency (using DEA and SFA) by Silva et al. (2017) finds both methods produce a consistent trend on global efficiency scores despite differences in individual efficiency results. Silva et al. (2018) consider the trend to be of more value than the efficiency score itself. Combining scale, scope, and operational efficiency,9 efficiency can range between 0 and 100 per cent. Theoretically, a bank is considered optimally efficient if it produces an output level and mix that maximises profits and minimises possible costs. However, high efficiency does necessarily imply high effectiveness, and, indeed, most banks are not fully efficient (Kumar and Gulati, 2009).
2.4. Earnings management
Numerous studies reveal that banks have a greater propensity for earnings smoothing than manufacturers (see Ma (1988); Gulzar et al. (2011); Abernathy et al. (2014)). Ghosh (2007) shows that banks listed on recognised exchanges use provisions for loan losses more aggressively for income smoothing than unlisted banks, and Anwar et al. (2019) suggest that enterprises that manage earnings more actively, experience higher agency costs. During years of unusually strong (weak) earnings, banks may seek to reduce earnings volatility by reducing (increasing) reported earnings (Ozili, 2017b). Balla and Rose (2011) contend that banks generally increase LLP and LLR when earnings are higher, noting that this is consistent with income smoothing. Smoothed earnings reduce the likelihood of financial scrutiny by regulators, market authorities, or shareholders (Liu and Ryan, 2003; Beatty et al., 2002) and reduce stock price volatility. A bank's ability to demonstrate public confidence through low stock price volatility while maximising wealth is a unique characteristic of the industry; a characteristic made all the more unique given that banks operate in highly regulated industries where regulators and standard setting bodies closely monitor non-performing loans, capital adequacy, and liquidity ratios. When efforts are made to circumvent regulations while simultaneously displaying an appearance of soundness, EM incentives are formed. Fig. 5 presents the mean, minimum, and maximum net income over average assets. The slight variability in the mean value may suggest efforts have been applied to smooth earnings.
Figure 5.
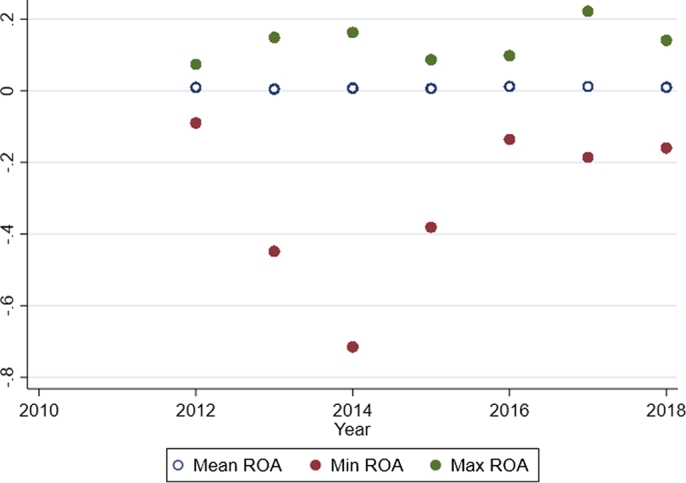
Net income to average assets (ROA) plot by year.
Methods for accounting for troubled loans generally follow the pattern of provisioning during periods of economic growth to absorb them during periods of contraction. Although methods may deviate from the norm, the effect on net income over the long run is identical (Ma, 1988). Statistical tools are frequently used to determine the magnitude of provisioning; actual amounts, however, are left to management discretion (Saurina, 2009). This study's decision to examine income smoothing using loan loss provision (LLP) and loan loss reserves (LLR)10 is consistent with Adams et al. (2009) and Wu et al. (2016). The authors claim that because LLP and LLR are discretionary, bank EM typically occurs through them. Additionally, Wu et al. (2016) argue that if bank managers practice EM, significant negative coefficients on LLP and LLR should be expected when regressed against performance.
Literature highlights that listed conventional banks use LLP as a tool for opportunistic managerial action (see Anandarajan et al. (2007); Bouvatier and Lepetit, 2012, Bouvatier and Lepetit, 2008; Leventis et al. (2011); Lobo and Yang (2001)), is a proxy for which it can be measured (Jin et al., 2018), and is well-suited to investigate EM activity (Kanagaretnam et al., 2015). A positive relationship between earnings and LLP potentially signals the use of LLP for income smoothing purposes (Dong, 2012). Further, Laeven and Majnoni (2003) note that banks can smooth their earnings by contributing additional LLP through LLR. Lowering LLP ensures larger earnings and may cause efficiency to deviate from best practice (Anandarajan et al., 2005).
In related research, Jackson and Liu (2010), find firms manage LLR downward to meet or beat analysts' earnings forecast and note that conservatism accentuates the extent to which firms manage bad debt expense. LLR is the largest bank accruals component (Wahlen, 1994; Altamuro and Beatty, 2010), and may also be used as a vehicle to smooth earnings (Ahmed et al., 1999; Kilic et al., 2012; Ozili, 2017a; Kanagaretnam et al., 2004). According to Turner and Godwin (1999), the US Securities and Exchange Commission is concerned that some banks' LLR are inconsistent with their internal documentation, implying manipulation. An excess of reserves is regarded as managing earnings and viewed negatively by the accounting profession (Koch and Wall, 2000; Dolar and Drickey, 2017).
Kanagaretnam et al. (2014) note that data on some bank-level variables, such as net loan charge-offs, are not always available in cross-country studies. The authors also note the mean values for LLP and LLR were one and four per cent and of total loans. Balla and Rose (2011) find LLR are more sensitive to historical loan loss trends (a more backwards-looking metric) than LLP (more sensitive to expected future loan losses). Therefore, although LLP and LLR are mechanically linked, findings show that these two constructs differ and thus are deserving of separate examination. This approach is further justified by recent empirical studies (see (Taktak et al., 2010; Ahmed et al., 2014; Kanagaretnam et al., 2016; Cho and Chung, 2016)).
Based on the above discussions, an inverse association is expected between EM vehicles and efficiency as increases in LLR and LLP would lower net income and the earnings-to-assets ratio, resulting in poor asset quality, decreased liquidity, diminished book value of equity, and ultimately decreased efficiency. This study's hypotheses are formalised as H1a and H1b:
-
Hypothesis 1 (H1a):
Use of loan loss reserves as an EM vehicle negatively impacts bank efficiency.
-
Hypothesis 1 (H1b):
Use of loan loss provisions as an EM vehicle negatively impacts bank efficiency.
3. Research design
3.1. Description of the data
This study uses a comprehensive sample of 22 frontier countries from five major geographical regions running from 2011 to 2018 and sourced from BankFocus. To avoid survivorship bias, past and present publicly listed commercial banks for each country are included. Banks with incomplete financial data for SFA and EM purposes are eliminated. Also eliminated are banks with less than two consecutive years of data and those with negative equity, interest expense, and total revenue. Specialised financial institutions and finance companies are additionally excluded in accordance with Ariff and Luc (2008) and Alsharif et al. (2019) to maintain homogeneity in the sample. Five hundred and forty-nine banks (n=549) and 3,429 observations remain after eliminations. Bangladesh is the country with the most numerous banks (n=52), while Argentina and Lithuania possess the least (n=9). Big banks (n=334) outnumber small banks (n=238). Geographically, Europe (n=180) and the Americas (n=14) are the most and least bank-populous regions represented. An unbalanced panel data set is used as banks regularly enter and exit the market. Table 1 presents a complete listing of the sample by year, region, and size.
Table 1.
Banks by year, size, and geographic location.
|
|
|||||||||||||||||||||||||||||||||||||||||||||||||||||||||||||||||||||||||||||||||||||||||||||||||||||||||||||||||||||||||||||||||||||||||||||||||||||||||||||||||||||||||||||||||||||||||||||||||||||||||||||||||||||||||||||||||||||||||||||||||||||||||||||||||||||||||
Note: Banks with total assets greater than 1 billion USD are considered big as per Siems et al. (1992) and Navaretti et al. (2019); small otherwise. Asia includes: Bangladesh, Pakistan, Vietnam, Sri Lanka | Africa includes: Kenya Mauritius Morocco Nigeria Tunisia | Americas countries include: Argentina | European countries include: Croatia, Estonia, Lithuania, Romania, Serbia, Slovenia | Middle Eastern countries include: Bahrain, Jordan, Kuwait, Lebanon, Oman.
3.2. Selection of variables
As a service industry, banks can define inputs and outputs using several different approaches. The ‘production’ approach views banks as producers, using labour and capital to produce deposits and loans in terms of the number of accounts. The ‘value-added’ approach states that all bank liabilities and assets have some output characteristics, rather than categorising them solely as inputs or outputs (Sakouvogui, 2020). The ‘intermediation’ approach assumes that banks use labour and capital to collect deposits and transform them into loans and other assets. In the intermediation approach, banks are considered financial intermediaries connecting savers and investors (Sealey and Lindley, 1977). Because the intermediation approach better represents a bank's roles in providing financial services (Berger and Humphrey, 1997; Altunbas et al., 2007; Vu and Turnell, 2010), this study adopts the intermediation approach to bank inputs and outputs.
Following Ding and Sickles (2018) and Sufian and Kamarudin (2014a), this study selects the following three input variables: (i) borrowed funds; (ii) labour; and (iii) capital. Borrowed funds are calculated as the quotient of interest paid on deposits over total deposits. Labour is calculated as the quotient of salary expenses over full-time equivalent employees. Capital is calculated as the quotient of amortisation and depreciation of premises and fixed assets over gross premises and fixed assets. The following two outputs are selected: (i) securities and (ii) loans. Securities are the sum of securities held to maturity and securities available for sale. Loans are calculated as the net of gross loans minus reserves for loan loss provisions. Fonseca and González (2008) and Kanagaretnam et al. (2009) document a positive relationship between prior loan loss reserves and the provision for loan losses. Accordingly, this study follows Fonseca and González (2008) and Cho and Chung (2016) and includes loan loss reserve in the model to control for non-discretionary proportional contribution to the loan loss provisions.
Table 2 reports descriptive statistics for the study sample. The mean and median LLP are both 0.01, with a standard deviation of 0.05, indicating significant variation across the sample. A similar conclusion can be drawn about the LLR as the mean is 0.07 with a standard deviation of 0.14. Net Income Growth had an overall negative mean (-0.20), while the median and standard were 0.03 and 7.08, respectively. Despite all the banks in the sample possessing similar frontier market classification characteristics, significant diversity exists.
Table 2.
Descriptive statistics of key variables.
| Stochastic frontier arguments | Mean | Std.Dev | 1st Quartile | Median | 3rd Quartile |
|---|---|---|---|---|---|
| Price of Deposits (W1) | 0.59 | 13.43 | 0.02 | 0.04 | 0.06 |
| Price of Labour (W2) | 0.02 | 0.02 | 0.01 | 0.01 | 0.02 |
| Price of Physical Capital (W3) | 6.85 | 113.55 | 0.27 | 0.60 | 1.42 |
| Total Financial Securities (y1) | 1,139,524.0 | 2,659,164.0 | 60,834.6 | 305,144.1 | 896,525.0 |
| Total Loans (y2) | 2,757,976.0 | 4,991,452.0 | 309,087.3 | 1,155,074.0 | 3,036,222.0 |
| Total Operating Cost (TOC) | 107,286.5 | 189,086.6 | 15,113.7 | 46,789.7 | 118,234.2 |
| Regression arguments | Mean | Std.Dev | 1st Quartile | Median | 3rd Quartile |
|---|---|---|---|---|---|
| Total Assets | 4,835,772.0 | 8,525,795.0 | 529,546.9 | 1,895,257.0 | 5,127,845.0 |
| Fixed Assets | 65,437.3 | 135,583.1 | 5,843.0 | 22,006.5 | 66,459.7 |
| Total Deposits | 3,637,405.0 | 6,483,415.0 | 345,757.9 | 1,375,604.0 | 3,858,692.0 |
| Total Liabilities | 4,302,115.0 | 7,715,444.0 | 438,516.5 | 1,639,897.0 | 4,537,809.0 |
| Loan Loss Provisions (%) | 0.01 | 0.05 | 0.00 | 0.01 | 0.01 |
| Loan Loss Reserves (%) | 0.07 | 0.14 | 0.01 | 0.04 | 0.07 |
| Net Income Growth (%) | -0.20 | 7.08 | -0.31 | 0.03 | 0.31 |
Notes: All variables are reported in thousands of USD
A Pearson's correlation matrix (Table 3) of the variables from Table 2 is included to examine the relationship among the regressors. Of note is that most variables are statistically significantly correlated with one another, with LLP being a notable holdout. LLP is not significantly correlated with the other balance sheet items (Total Loans, Total Assets, and Total Liabilities). The relationship between Net Income Growth and the Price of Labour and the Price of Physical Capital was found not to be statistically significant.
Table 3.
Correlation matrix of key variables.
| w1 | w2 | w3 | y1 | y2 | TOC | TA | FA | TD | TL | LLP | LLR | |
|---|---|---|---|---|---|---|---|---|---|---|---|---|
| Price of Labour (w2) | 0.1771* | 1 | ||||||||||
| Price of Physical Capital (w3) | -0.0205 | 0.1958* | 1 | |||||||||
| Total Financial Securities (y1) | -0.0291 | -0.3732* | -0.1971* | 1 | ||||||||
| Total Loans (y2) | -0.1270* | -0.4345* | -0.1642* | 0.7902* | 1 | |||||||
| Total Operating Cost (TOC) | -0.0471* | -0.1291* | -0.0765* | 0.8126* | 0.8914* | 1 | ||||||
| Total Assets (TA) | -0.1043* | -0.4481* | -0.1929* | 0.8801* | 0.9771* | 0.9136* | 1 | |||||
| Fixed Assets (FA) | -0.0073 | -0.1871* | -0.4160* | 0.7586* | 0.8021* | 0.8550* | 0.8332* | 1 | ||||
| Total Deposits (TD) | -0.1727* | -0.4441* | -0.1927* | 0.8657* | 0.9529* | 0.8847* | 0.9731* | 0.8152* | 1 | |||
| Total Liabilities (TL) | -0.1049* | -0.4524* | -0.1922* | 0.8784* | 0.9759* | 0.9080* | 0.9973* | 0.8295* | 0.9808* | 1 | ||
| Loan Loss Provision (%) | 0.1099* | 0.2219* | 0.0748* | -0.0398* | -0.0047 | 0.0809* | -0.0235 | 0.0540* | -0.0211 | -0.022 | 1 | |
| Loan Loss Reserve (%) | -0.1081* | 0.1945* | -0.0772* | -0.0367 | -0.0926* | 0.0147 | -0.0764* | 0.0548* | -0.0835* | -0.0821* | 0.3758* | 1 |
| Net Income Growth (%) | -0.0078 | -0.1236* | -0.0249 | 0.0818* | 0.1183* | 0.0747* | 0.1114* | 0.0526* | 0.1098* | 0.1112* | -0.1108* | -0.1228* |
Notes: Significance is identified at three levels: 0.05*, 0.01**, and 0.001***
3.3. Bank efficiency
This study applies the SFA approach in its estimation of efficiency. The central idea of SFA technical efficiency (TE) can be formalised as the ratio of realised output, given a specific set of inputs to maximum attainable output, as per Eq. (1):
| (1) |
where y is the maximum attainable output for unit i given Xit and where is a log-linear production function. ε denotes the error term.
Following researchers Altunbas et al. (2007); Ding and Sickles (2018) and Shamshur and Weill (2019), this paper specifies a cost frontier model with two-output (γ), and three-input (w), parameters via the translog functional form as per Eq. (2). TOC is a vector of the dependent variable total cost, γm is the mth banks' outputs (m =1,2). wn is nth input price (n=1,2). w3 is the price of borrowed funds. β is a vector of the coefficients to be estimated. v is a random error identically and independently distributed as N(0,σ2n). The term μ measures an individual bank's distance to the efficient frontier and represents a bank's one-sided inefficiency. Subscripts denoting firm and year have been dropped for presentation ease. Table 9 describes the input and output variables.
| (2) |
Following Eq. (2), the estimation for the parameters of the SFA model can be achieved by applying the maximum likelihood estimation method, which estimates the likelihood function in terms of two variance parameters (Battese and Coelli, 1995; Kea et al., 2016) as per Eq. (3):
| (3) |
where gamma (γ) reflects the impact of random disturbances (v, u) and will fall in the range between zero and one. The closer γ is to one, the smaller the gap between actual output and maximum possible output. When γ is at one, the sample bank is fully efficient (Aghimien et al., 2016), whereas a γ close to zero is essentially meaningless since it indicates that SFA output is uncontrolled by random factors.
Table 9.
Definition of key variables.
| Symbol | Variable | Description | BankFocus ID No. |
|---|---|---|---|
| TOC | Total cost | Calculated as the sum of interest + non-interest expense | 72800 |
| Outputs | |||
| y1 | Total Loans | Gross loans less reserve for loan loss provision | 51350 |
| y2 | Total financial securities | Sum of securities held to maturity and securities held for sale | 81390, 81450 |
| Input Prices | |||
| w1 | Price of Deposits | Ratio of interest expense to total deposits | 71000, 60300 |
| w2 | Price of Labour | Ratio of salaries to total assets | 72500, 52600 |
| w3 | Price of Physical capital | Ratio of expenditure on premises and fixed assets to fixed assets | 72700, 51800 |
| Earnings Management | |||
| LLP (%) | Loan Loss Provisions | Ratio of loan loss provision to total loans | 72200, 80410 |
| LLR (%) | Loan Loss Reserves | Ratio of loan loss reserves of total loans | 80440, 80410 |
| FA | Fixed Assets | Fixed assets calculated as the sum of Property, plant & equipment | 51800 |
| GROW (%) | Net Income Growth | Growth rate of net income | 74700 |
| TA | Total Assets | Natural logarithm of total assets | 52600 |
| TL | Total Liabilities | Ratio of total liabilities to total assets | 61900 |
3.4. Income smoothing
This study additionally examines the impact of income smoothing through LLP or LLR on TE scores in frontier markets' banking industry. Wang (2003) shows that consistent estimators of the regression coefficients can be obtained via ordinary least squares regression (OLS), notwithstanding that technical efficient regression coefficients range between zero and one. Despite the evidence supporting of OLS, Kamarudin et al. (2014) state OLS gives equal weight to all errors, regardless of their distance from the sample regression function. To correct for the equal weighting of errors, this study follows Wu et al. (2016) and applies both the random effect regression and the truncated regression model for greater robustness.11 Variance inflation factor test (VIF) for multicollinearity reports a value of 3.41 on the full sample of data, indicating that the independent variables are not highly correlated. The final model is stated as Eq. (4)
| (4) |
where TE is the technical efficiency based on SFA analysis. LLP and LLR are respectively loss provisions scaled by loans, and loan loss reserves scaled by loans. Total Assets (TA) are the natural logarithm of total assets and are used to control for firm size. GROW is the growth rate of net income and a control variable for the growth opportunities of banks. Total Liabilities (TL) are total liabilities scaled by total assets and a proxy for the individual bank's risk-taking. ∑Year and ∑Country are year-specific and country-specific effect dummy variables respectively. These dummy variables control for different loss provision levels across countries and capture unobserved time-invariant effects not included in the regression. The error term is denoted by ε. Subscripts i and t denote company and time, respectively. This study predicts that the α1 and α2 coefficients will be negative if a bank manages earnings using LLP and LLR.
4. Results
4.1. Estimation of results for stochastic frontier analysis
Table 4 shows the SFA efficiency model results for the entire population of frontier markets banks from 2011 - 2018 by country and region. Also shown are the aggregated mean scores by country, year, and efficiency scores for large and small banks. Efficiency decreased from a 2011 mean score of 0.84 to 0.763 in 2018, a 9.6 per cent decline. Argentina showed the greatest decline (26.7 per cent), whereas Serbia declined the least (3.05 per cent). The most efficient commercial banks are in Lithuania and Mauritius, with mean efficiency scores of 84.1 and 83.4 per cent. Fig. 1 and Fig. 4 provide a visual illustration of efficiency scores by year and by country.
Table 4.
Efficiency scores by year, country, and bank size.
| Country | 2011 | 2012 | 2013 | 2014 | 2015 | 2016 | 2017 | 2018 | Mean | Large Banks (Mean) | Small Banks (Mean) |
|---|---|---|---|---|---|---|---|---|---|---|---|
| Argentina | 0.776 | 0.747 | 0.688 | 0.701 | 0.663 | 0.623 | 0.603 | 0.569 | 0.671 | 0.667 | 0.634 |
| Bahrain | 0.851 | 0.841 | 0.838 | 0.823 | 0.816 | 0.806 | 0.792 | 0.764 | 0.816 | 0.819 | 0.805 |
| Bangladesh | 0.836 | 0.821 | 0.813 | 0.798 | 0.781 | 0.773 | 0.760 | 0.746 | 0.791 | 0.783 | 0.795 |
| Bulgaria | 0.852 | 0.844 | 0.832 | 0.827 | 0.825 | 0.822 | 0.809 | 0.816 | 0.828 | 0.835 | 0.814 |
| Croatia | 0.850 | 0.841 | 0.841 | 0.833 | 0.830 | 0.829 | 0.814 | 0.815 | 0.832 | 0.821 | 0.838 |
| Estonia | 0.840 | 0.842 | 0.849 | 0.848 | 0.834 | 0.823 | 0.811 | 0.767 | 0.827 | 0.833 | 0.814 |
| Jordan | 0.862 | 0.849 | 0.831 | 0.818 | 0.809 | 0.800 | 0.783 | 0.767 | 0.815 | 0.811 | 0.825 |
| Kenya | 0.823 | 0.795 | 0.801 | 0.787 | 0.768 | 0.749 | 0.740 | 0.732 | 0.774 | 0.762 | 0.769 |
| Kuwait | 0.859 | 0.847 | 0.835 | 0.827 | 0.818 | 0.801 | 0.786 | 0.776 | 0.819 | 0.820 | 0.792 |
| Lebanon | 0.857 | 0.845 | 0.835 | 0.822 | 0.808 | 0.784 | 0.768 | 0.748 | 0.808 | 0.813 | 0.793 |
| Lithuania | 0.863 | 0.853 | 0.836 | 0.838 | 0.845 | 0.842 | 0.829 | 0.821 | 0.841 | 0.843 | 0.832 |
| Mauritius | 0.876 | 0.848 | 0.838 | 0.839 | 0.823 | 0.830 | 0.821 | 0.801 | 0.834 | 0.851 | 0.802 |
| Morocco | 0.863 | 0.853 | 0.831 | 0.817 | 0.813 | 0.803 | 0.800 | 0.767 | 0.818 | 0.818 | 0.824 |
| Nigeria | 0.816 | 0.794 | 0.784 | 0.768 | 0.753 | 0.756 | 0.736 | 0.726 | 0.767 | 0.754 | 0.781 |
| Oman | 0.855 | 0.841 | 0.815 | 0.797 | 0.787 | 0.770 | 0.762 | 0.745 | 0.796 | 0.813 | 0.737 |
| Pakistan | 0.834 | 0.824 | 0.814 | 0.802 | 0.798 | 0.787 | 0.778 | 0.765 | 0.800 | 0.798 | 0.804 |
| Romania | 0.824 | 0.813 | 0.813 | 0.806 | 0.801 | 0.796 | 0.784 | 0.762 | 0.800 | 0.799 | 0.800 |
| Serbia | 0.821 | 0.815 | 0.796 | 0.794 | 0.801 | 0.809 | 0.802 | 0.796 | 0.804 | 0.810 | 0.799 |
| Slovenia | 0.863 | 0.852 | 0.846 | 0.847 | 0.843 | 0.836 | 0.825 | 0.809 | 0.840 | 0.838 | 0.847 |
| Sri Lanka | 0.845 | 0.822 | 0.813 | 0.808 | 0.803 | 0.785 | 0.769 | 0.752 | 0.800 | 0.792 | 0.804 |
| Tunisia | 0.854 | 0.841 | 0.836 | 0.821 | 0.811 | 0.804 | 0.781 | 0.764 | 0.814 | 0.800 | 0.826 |
| Vietnam | 0.844 | 0.823 | 0.835 | 0.828 | 0.819 | 0.812 | 0.799 | 0.782 | 0.818 | 0.815 | 0.831 |
| Mean | 0.844 | 0.830 | 0.819 | 0.811 | 0.802 | 0.793 | 0.780 | 0.763 | 0.805 | 0.804 | 0.798 |
| Region | |||||||||||
| Africa | 0.835 | 0.814 | 0.805 | 0.789 | 0.774 | 0.766 | 0.750 | 0.739 | 0.784 | 0.769 | 0.790 |
| Americas | 0.776 | 0.747 | 0.688 | 0.701 | 0.663 | 0.623 | 0.603 | 0.569 | 0.671 | 0.667 | 0.634 |
| Asia | 0.838 | 0.822 | 0.819 | 0.807 | 0.797 | 0.786 | 0.774 | 0.758 | 0.800 | 0.795 | 0.802 |
| Europe | 0.846 | 0.837 | 0.829 | 0.824 | 0.820 | 0.819 | 0.808 | 0.797 | 0.822 | 0.826 | 0.817 |
| Middle East | 0.856 | 0.844 | 0.832 | 0.818 | 0.809 | 0.792 | 0.778 | 0.761 | 0.811 | 0.815 | 0.791 |
Note: Results from the non-parametric Mann-Whitney test show that the null hypothesis H0 of equality of mean technical efficiency across bank size. The null hypothesis was accepted at the 5% significance level, indicating no significant difference in efficiency between large and small banks. The Kruskal-Wallis test for equality of medians had a chi-square value of 512.592 with 4 degrees of freedom and a p-value less than 0.05, indicating the efficiency score median is unequal between regions. Levene's T-test for equal variances results in a T value of 42.12, and the null of equal variance between the groups is rejected at a p-value less than 0.05.
Figure 1.

Efficiency scores by year.
Figure 4.

Density plot of efficiency scores by country.
4.2. Efficiency scores by region
The findings in Table 4 also report the efficiency across the five geographical regions in the sample. The region with the highest mean efficiency score is Europe, at 82.6 per cent efficiency. The European region also experienced the smallest decline in efficiency of the study period at 5.8 per cent. The Americas is the least efficient region with a mean score of 66.7 per cent efficient and a 26.6 per cent decline over the study period. However, this latter finding should be taken with circumspection as the Americas region includes only one country (Argentina). Additionally, Argentina faced a particularly difficult financial situation that left the country with half as many fixed assets as pre-financial crisis years (years 2001 versus 2015) and very little credit growth (Ferro et al., 2018). An examination of the most and least efficient regions finds Lithuania has the highest efficiency score in Europe at 84.1 per cent, while Romania has the lowest at 80.0 per cent. Novickytė and Droždz (2018) state Lithuanian banks markedly outperformed other banks operating in the EU, as foreign banks dominate the sector.12 Much like the overall sample, efficiency trends by region show each region experiencing decreasing efficiency over the sample period, with the America's region exhibiting the greatest loss in efficiency (26.6 per cent). In contrast, the European region efficiency decreased the least (5.8 per cent). Fig. 2 provides a visual illustration of efficiency scores by region.
Figure 2.

Histogram and kernel density of efficiency scores by region.
4.3. Efficiency scores by bank size
According to conventional economic efficiency theory, size encourages efficiency by reducing the costs of data collection and processing (Said, 2012; Rozzani and Rahman, 2013). The implications of this theory suggest that large banks will exhibit increasing economies of scale. Typically, large banks engage in activities that benefit from scale and scope economies, such as portfolio management and investment banking (Sufian and Kamarudin, 2016). Conversely, if a bank should expand beyond its size thresholds, inefficiencies can arise. Hassan and Sanchez (2009) note that size was inversely related with performance in micro financial intuitions. Loong et al. (2017) provide additional support for this finding contending that scale inefficiency is a primary source of technical inefficiency. To examine the alignment with economic efficiency theory, we also present mean efficiency scores by large and small banks of 80.4 and 79.8 per cent efficient, respectively (see Table 4). Although these mean values demonstrate that large banks are more efficient, a Mann-Whitney test for equality of means reveals no statistically significant difference between large and small banks. When scores were examined by size and region, three out of the five regions reported higher scores for large banks. Accordingly, the findings herein align with Girardone et al. (2004) and Ruslan et al. (2019) in that there is no clear relationship between size and efficiency. The absence of a clear relationship could be a result of external macroeconomic factors beyond the bank's control or internal factors such as ineffective asset management. Fig. 3 provides a visual illustration of efficiency by size.
Figure 3.

Histogram and kernel density of efficiency scores by size.
4.4. Earnings management, efficiency, and regions
Tables 5 and 6 report the outcomes for the full data sample, by bank size, and geographic region. Table 5 presents random effects regression results, while Table 6 shows truncated regression outcomes. Regression findings signify that LLP and LLR are significant and negative when applied to the entire data set (coefficients of -0.046 and -0.027 respectively for random effects regression; and -0.069 and -0.040 respectively for truncated regression). The negative coefficients for both variables suggest an inverse relationship between technical efficiency and both LLP and LLR. Results between the two methods show only slight differences in the degree of managed earnings. This finding, therefore, supports hypotheses H1a and H1b.
Table 5.
Earnings management random effect regression results.
| Random Effects Regression | ||||||||
|---|---|---|---|---|---|---|---|---|
| Size |
Region |
|||||||
| Variable | All | Big | Small | Africa | Europe | Middle East | Americas | Asia |
| Intercept | 0.767*** | 0.707*** | 0.737*** | 0.733*** | 0.774*** | 0.608*** | -0.381 | 0.626*** |
| (0.026) | (0.036) | (0.047) | (0.061) | (0.042) | (0.098) | (1.003) | (0.053) | |
| LLP | -0.046*** | -0.027 | -0.046** | -0.146** | -0.007 | -0.222** | 0.837 | -0.011 |
| (0.010) | (0.022) | (0.014) | (0.053) | (0.011) | (0.077) | (0.972) | (0.050) | |
| LLR | -0.027*** | -0.030* | -0.022*** | 0.031 | -0.014** | -0.050 | -0.656 | -0.128*** |
| (0.005) | (0.013) | (0.007) | (0.020) | (0.005) | (0.027) | (0.877) | (0.031) | |
| TA | -0.001 | 0.002 | 0.004 | 0.002 | -0.001 | 0.009 | 0.069 | 0.010* |
| (0.002) | (0.002) | (0.004) | (0.004) | (0.003) | (0.007) | (0.070) | (0.004) | |
| GROW | 0.000 | 0.000 | 0.000 | 0.000 | 0.000 | 0.000 | -0.017 | -0.000 |
| (0.000) | (0.000) | (0.000) | (0.000) | (0.000) | (0.000) | (0.010) | (0.000) | |
| TL | 0.018 | 0.027 | -0.012 | -0.036 | 0.046 | 0.020 | -0.012 | -0.019 |
| (0.013) | (0.021) | (0.022) | (0.024) | (0.024) | (0.030) | (0.162) | (0.021) | |
| Year Dummies | Yes | Yes | Yes | Yes | Yes | Yes | Yes | Yes |
| Country Dummies | Yes | Yes | Yes | Yes | Yes | Yes | Yes | Yes |
| F Statistic | 293.79 | 355.45 | 28.22 | 101.90 | 30.43 | 96.37 | 5.85 | 179.21 |
| Adj. R2 | 0.515 | 0.671 | 0.087 | 0.69 | 0.142 | 0.65 | 0.561 | 0.715 |
| Observations | 2557 | 1748 | 809 | 458 | 857 | 516 | 35 | 726 |
Note: The p-value denotes significance at three levels: 0.05*, 0.01**, and 0.001***. F Statistics are significant at the 0.01 level, except the Americas, which is significant at the 0.05 level.
Table 6.
Earnings management truncated regression results.
| Truncated Regression | ||||||||
|---|---|---|---|---|---|---|---|---|
| Size |
Region |
|||||||
| Variable | All | Big | Small | Africa | Europe | Middle East | Americas | Asia |
| Intercept | 0.838*** | 0.822*** | 0.800*** | 0.889*** | 0.814*** | 0.725*** | 0.633*** | 0.875*** |
| (0.010) | (0.018) | (0.030) | (0.014) | (0.017) | (0.021) | (0.042) | (0.015) | |
| LLP | -0.069*** | -0.081 | -0.060** | -0.118* | -0.020 | -0.375*** | 0.773 | -0.376*** |
| (0.015) | (0.043) | (0.018) | (0.051) | (0.015) | (0.107) | (0.550) | (0.049) | |
| LLR | -0.040*** | -0.100*** | -0.031*** | -0.077** | -0.027*** | -0.070 | -0.978 | -0.036** |
| (0.005) | (0.017) | (0.007) | (0.027) | (0.006) | (0.039) | (0.542) | (0.012) | |
| TA | -0.004*** | -0.005*** | -0.002 | -0.004*** | -0.002** | -0.005** | 0.022*** | -0.001 |
| (0.001) | (0.001) | (0.002) | (0.001) | (0.001) | (0.001) | (0.004) | (0.001) | |
| GROW | -0.000 | -0.000 | 0.000 | 0.000 | -0.000 | -0.000 | -0.017*** | -0.001*** |
| (0.000) | (0.000) | (0.000) | (0.000) | (0.000) | (0.001) | (0.005) | (0.000) | |
| TL | 0.009 | 0.056*** | -0.078*** | -0.118*** | 0.010 | 0.164*** | -0.383*** | -0.116*** |
| (0.008) | (0.014) | (0.014) | (0.017) | (0.015) | (0.015) | (0.030) | (0.015) | |
| Year Dummies | Yes | Yes | Yes | Yes | Yes | Yes | Yes | Yes |
| Country Dummies | Yes | Yes | Yes | Yes | Yes | Yes | Yes | Yes |
| Adj-R2 | 0.035 | 0.029 | 0.039 | 0.032 | 0.032 | 0.035 | 0.024 | 0.03 |
| Observations | 2557 | 1748 | 809 | 458 | 857 | 516 | 35 | 726 |
Notes: The p-value denotes significance at three levels: 0.05*, 0.01**, and 0.001***. All Sigma values are significant at the 0.01 level.
Both regression models reveal a statically significant relationship between LLP and small banks, and between LLR and big and small banks. From this, it is inferred that large banks are more likely to employ LLR as a vehicle to manage earnings, while small banks use both LLP and LLR to smooth earnings.
In the Americas region, this study failed to detect a meaningful relationship between efficiency and EM. These results are supported by Fonseca and González (2008) and Jin et al. (2018), who also failed to discover a relationship. The authors suggest that greater availability of investor protection constrains EM and that allowances were not made for opportunistic purposes. Tables 5 and 6 also indicate a bank's income smoothing vehicle preference. In the Middle East, LLPs is preferred, while in Africa, LLR is favoured. The Asian region showed mixed results, with both LLP and LLR being significant and negative for the random effects method. However, both LLP and LLR methods show a significant relationship in the truncated model. Overall, European banks appear to favour LLR as an EM technique.
5. Additional control variables
To add robustness and mitigate a potential omitted variable bias, several bank and country-specific control variables were added to Eq. (4). Specifically, inflation and GDP growth were included to control for the variability in accounting earnings due to macroeconomic factors.13 Return on Assets (ROA) was incorporated as a financial performance measure to address whether abnormal operating activities are correlated with firm performance (Huang and Sun, 2017). Rule of Law and Regulatory Quality were included. Rule of Law is an overarching norm of cultural autonomy and antithetical to corruption (Licht et al., 2007; Martens et al., 2021). Regulatory Quality is an external environmental factor that reinforces an institutional shareholders' role in ensuring accurate earnings reporting. Regulatory Quality also strengthens the effect of institutional ownership on EM (Bao and Lewellyn, 2017). Increased regulatory governance, according to Hussain et al. (2020a), harms efficiency since strict control or surveillance of corruption benefits officials privately whilst otherwise restricting bank operations. Change in Loan Losses is a proxy for the level of risk institutions face. Higher loan losses require increased LLP for the additional risk (Anandarajan et al., 2006). Commission fee and fee income (CFEE) is the ratio of commission fees and other income to total assets. Higher commission fees may indicate an interest in non-depository banking activities and a need for higher loan loss reserve allocations (Anandarajan et al., 2007; Hasan and Hunter, 1999).
Regression results show that the inclusion of control variables does not quantitatively change the main variables under the truncated regression method; however, a few differences are noted. Under the random effects regression, LLP remains inversely related to efficiency but fails to show statistical significance in a few subsections of the random effects estimation. In the truncated regression, a negative relationship is present for small banks and African banks. Total liabilities are considered a proxy for risk-taking, and thus a negative coefficient is expected. Applying random effects regression, no significant relationship appears, yet under truncated regression, a significant positive relationship appears for big banks and a significant negative relationship appears for small banks. This evidence demonstrates that risk impacts vary according to the size of the bank and the sort of risks to which it is exposed. Additional illumination on the relationship between efficiency and other control variables are detailed below, while Table 7 and Table 8 show the results.
Table 7.
Earnings management random effects regression with additional control variables.
| Random Effects Regression | |||||||
|---|---|---|---|---|---|---|---|
| Size |
Region |
||||||
| Variable | All | Big | Small | Africa | Europe | Middle East | Asia |
| Intercept | 0.873*** | 0.834*** | 0.968*** | 0.651*** | 0.823*** | 0.768*** | 0.657*** |
| (0.018) | (0.027) | (0.048) | (0.094) | (0.042) | (0.103) | (0.057) | |
| LLP | -0.017 | -0.009 | -0.018 | -0.054 | 0.005 | -0.074 | 0.045 |
| (0.009) | (0.022) | (0.013) | (0.060) | (0.010) | (0.078) | (0.063) | |
| LLR | -0.014** | -0.007 | -0.003 | 0.006 | 0.000 | -0.024 | -0.098*** |
| (0.004) | (0.013) | (0.007) | (0.026) | (0.005) | (0.028) | (0.029) | |
| TA | -0.005*** | -0.004* | -0.016*** | 0.008 | -0.004 | 0.003 | 0.011** |
| (0.001) | (0.001) | (0.004) | (0.006) | (0.003) | (0.008) | (0.004) | |
| GROWTH | 0.000 | -0.000 | 0.000 | 0.000 | 0.000 | 0.000 | -0.000* |
| (0.000) | (0.000) | (0.000) | (0.000) | (0.000) | (0.000) | (0.000) | |
| TL | 0.024* | 0.044* | 0.045* | -0.008 | 0.068** | -0.027 | -0.042 |
| (0.010) | (0.017) | (0.023) | (0.029) | (0.022) | (0.030) | (0.022) | |
| Inflation | -0.001*** | -0.001*** | -0.002** | -0.000 | -0.002*** | -0.000 | -0.003*** |
| (0.000) | (0.000) | (0.001) | (0.001) | (0.001) | (0.001) | (0.000) | |
| GDP growth | 0.001*** | 0.000* | 0.002** | -0.003** | 0.000 | -0.000 | 0.001 |
| (0.000) | (0.000) | (0.001) | (0.001) | (0.000) | (0.001) | (0.001) | |
| ROA | 0.192*** | 0.156*** | 0.264*** | 0.376*** | 0.216*** | 0.328* | -0.263** |
| (0.020) | (0.043) | (0.032) | (0.073) | (0.023) | (0.134) | (0.096) | |
| Rule of Law | -0.003 | -0.006 | 0.003 | -0.007 | -0.020* | -0.006 | 0.030*** |
| (0.004) | (0.004) | (0.012) | (0.016) | (0.009) | (0.011) | (0.006) | |
| Regulatory Quality | 0.007 | 0.017*** | -0.018 | 0.002 | 0.013 | -0.014 | -0.043** |
| (0.005) | (0.005) | (0.014) | (0.024) | (0.011) | (0.012) | (0.015) | |
| Change in Loan Losses | 0.019 | -0.021 | 0.047** | 0.089 | 0.032** | 0.014 | 0.018 |
| (0.010) | (0.032) | (0.014) | (0.055) | (0.011) | (0.104) | (0.074) | |
| CFEER | -0.978*** | -1.136*** | -1.096*** | -0.146 | -1.319*** | -1.214*** | -1.019* |
| (0.072) | (0.119) | (0.166) | (0.231) | (0.206) | (0.180) | (0.412) | |
| Year Dummies | Yes | Yes | Yes | Yes | Yes | Yes | Yes |
| Country Dummies | Yes | Yes | Yes | Yes | Yes | Yes | Yes |
| Adj. R2 | 0.5134 | 0.6491 | 0.242 | 0.691 | 0.312 | 0.633 | 0.723 |
| Observations | 2557 | 1748 | 809 | 458 | 857 | 516 | 726 |
Note: The p-value denotes significance at three levels: 0.05*, 0.01**, and 0.001***. Inflation data and GDP growth figures source from World Bank for 2011 - 2018. ROA is the ratio of net income to average total assets. Rule of law sourced from World Bank and captures perceptions of the extent to which agents have confidence in and abide by the rules of society. Scores are collected annually for each year and range from -2.5 to 2.5. Regulatory Quality captures perceptions of the ability of the government to formulate and implement sound policies and regulations that permit and promote private sector development. Annual data is sourced from the World Bank and range from -2.5 to 2.5. Change in Loan Losses is the ratio of change in loan losses to total assets. CFEE is the ratio of commission and fee income to total assets. The Americas region has been excluded from the table as the combined effect of a small sample size and control variables has led to indeterminate dependent values for a large number of variables.
Table 8.
Earnings management truncated regression with additional control variables.
| Truncated Regression | |||||||
|---|---|---|---|---|---|---|---|
| Size |
Region |
||||||
| Variable | ALL | Big | Small | Africa | Europe | Middle East | Asia |
| Intercept | 0.877*** | 0.882*** | 0.856*** | 0.931*** | 0.864*** | 0.811*** | 0.864*** |
| (0.010) | (0.016) | (0.029) | (0.030) | (0.041) | (0.020) | (0.037) | |
| Loan Loss Provision | -0.038* | 0.019 | -0.043* | 0.412*** | -0.032* | -0.339*** | -0.303* |
| (0.016) | (0.039) | (0.019) | (0.066) | (0.016) | (0.093) | (0.125) | |
| Loan Loss Reserves | -0.026*** | -0.061*** | -0.018** | -0.136*** | -0.004 | -0.103** | -0.035** |
| (0.005) | (0.015) | (0.007) | (0.027) | (0.006) | (0.036) | (0.011) | |
| Ln Total Assets | -0.004*** | -0.005*** | -0.005** | -0.009*** | -0.001 | -0.007*** | -0.004** |
| (0.001) | (0.001) | (0.002) | (0.001) | (0.001) | (0.001) | (0.001) | |
| Net Income Growth | -0.000 | -0.000** | 0.000 | 0.000 | -0.000 | -0.000 | -0.002*** |
| (0.000) | (0.000) | (0.000) | (0.000) | (0.000) | (0.000) | (0.000) | |
| Total Liabilities | 0.002 | 0.017 | -0.048*** | -0.073*** | 0.003 | 0.124*** | -0.040* |
| (0.007) | (0.013) | (0.014) | (0.015) | (0.014) | (0.014) | (0.019) | |
| Inflation | -0.001** | -0.001* | -0.002 | -0.000 | -0.003** | -0.000 | -0.004*** |
| (0.000) | (0.000) | (0.001) | (0.001) | (0.001) | (0.001) | (0.001) | |
| GDP growth | 0.001* | 0.000 | 0.003** | -0.001 | 0.001 | -0.001 | -0.000 |
| (0.000) | (0.000) | (0.001) | (0.002) | (0.001) | (0.001) | (0.002) | |
| ROA | 0.117*** | 0.337*** | 0.091* | 0.615*** | 0.071* | 0.383* | 0.091 |
| (0.028) | (0.061) | (0.036) | (0.080) | (0.030) | (0.154) | (0.120) | |
| Rule of Law | 0.001 | -0.011 | 0.028 | 0.004 | -0.029 | -0.005 | 0.038* |
| (0.008) | (0.007) | (0.020) | (0.029) | (0.016) | (0.020) | (0.015) | |
| Regulatory Quality | -0.004 | 0.024* | -0.027 | -0.016 | 0.011 | -0.022 | -0.051 |
| (0.010) | (0.010) | (0.023) | (0.040) | (0.021) | (0.023) | (0.034) | |
| Change in Loan Losses | -0.016 | 0.015 | -0.017 | 0.085 | -0.008 | 0.020 | 0.204 |
| (0.017) | (0.058) | (0.020) | (0.097) | (0.016) | (0.182) | (0.181) | |
| CFEER | -0.847*** | -1.670*** | -0.607*** | -1.604*** | -2.006*** | -0.560*** | -0.211 |
| (0.046) | (0.075) | (0.066) | (0.143) | (0.140) | (0.059) | (0.292) | |
| Year Dummies | Yes | Yes | Yes | Yes | Yes | Yes | Yes |
| Country Dummies | Yes | Yes | Yes | Yes | Yes | Yes | Yes |
| Adj. R2 | 0.2147 | 0.3169 | 0.2121 | 0.3462 | 0.1461 | 0.2262 | 0.1909 |
| Observations | 2557 | 1748 | 809 | 458 | 857 | 516 | 726 |
Note: The p-value denotes significance at three levels: 0.05*, 0.01**, and 0.001***. Inflation data and GDP growth figures source from the World Bank for 2011 - 2018. ROA is the ratio of net income to average total assets. Rule of law sourced from World Bank and captures perceptions of the extent to which agents have confidence in and abide by the rules of society. Scores are collected annually for each year and range from -2.5 to 2.5. Regulatory Quality captures perceptions of the ability of the government to formulate and implement sound policies and regulations that permit and promote private sector development. Annual data is sourced from the World bank and range from -2.5 to 2.5. Change in Loan Losses is the ratio of change in loan losses to total assets. CFEE is the ratio of commission and fee income to total assets. The Americas region has been excluded from the table as the combined effect of a small sample size and control variables has led to indeterminate dependent values for a large number of variables.
Inflation harms efficiency under both regression estimations, whereas GDP growth positively impacts efficiency. The logic here is that when GDP growth is robust, banks are more likely t o see increased deposits and loan growth (Dietrich and Wanzenried, 2014). Inflation negatively influences a bank's ability to allocate resources (Azad et al., 2017); this is particularly true when inflation is unanticipated, for costs will rise, reducing efficiency (Boyd and De Nicolo, 2005). ROA shows a significant positive relationship with efficiency. This finding is in line with Adelopo et al. (2018) and Farandy et al. (2017) and suggests that higher bank profitability levels will produce more efficient banks. Rule of law and Regulatory Quality are not significant, suggesting that institutional frameworks do not influence costs and, hence, efficiency. Change in Loan Losses, a risk proxy, is similarly not influential on efficiency. CFEE exhibits a strong, significant negative relationship with efficiency, suggesting that income from non-depository banking activity harms efficiency.
6. Conclusion
This study examines the relationship between income smoothing and technical efficiency, focusing on the role of LLR and LLP as earnings management vehicles. Using aggregated bank data from 567 banks in 22 frontier marker economies from 2001 to 2018, a downward trend in the overall efficiency scores is seen. This is contrary to Liao (2020)'s China-based study but aligns with Maity and Sahu (2020) India-based study. Attribution of the trend can be directed to a decrease in loan quality as input utilisation remains low and suggests structural changes are required. Further, this study presents evidence that EM plays an adverse role in efficiency and that bank size is not associated with efficiency. This latter conclusion implies scale efficiencies was not present despite larger work forces or greater assets and is consistent with Colesnic et al. (2019), who find large banks less efficient due to costlier non-performing loan disposals. Country growth showed a positive efficiency association, suggesting that growth impacts both directly and indirectly on fund flow and, by extension, efficiency. Results herein are robust to the use of different empirical specifications and the inclusion of bank and county-specific macroeconomic, as well as financial control variables.
6.1. Theoretical implications
Overall, the results of this study provide a theoretical framework for a better understanding of EM and its association with efficiency. To begin, resource allocation theory sheds new light on strategic consequences as frontier markets open up and new market entrants create disruption. Banks that are currently prone to excess bureaucratisation, and conventional modes of management practices may not be able to exploit resources for maximum gain (Clark and Thrift, 2005). This dimension suggests that foreign banks play an important role in allocating capital, leading to greater efficiency. Second, the study supports Kumbhakar et al. (2001)'s theory on efficiency. The positive association between bank ROA and efficiency suggests that greater technical efficiency has a spillover effect in achieving economic efficiency. Third, findings show that managers that smooth earnings via LLPs and LLRs, have lower technical efficiency, which agrees with prospect theory. There is a compelling evidence that managing earnings as a risk-taking behaviour function is steeper than risk-averting behaviour. This is consistent with Wu et al. (2016)'s non-parametric efficiency assessment model as well as Kahneman and Tversky (1979); Shu et al. (2002); Shen and Chih (2005)'s behavioural studies.
6.2. Practical implications
Practical implications from the results of this study suggest that banks reevaluate their use of income smoothing and credit provisioning vehicles. The use of non-discretionary LLPs and LLRs as EM vehicles adversely impacts a bank's efficiency, consequently impacting competitiveness (Poshakwale and Qian, 2011). Maintaining competitiveness is the core of a company's success (Porter, 1997) and is influential on depositors, owners, and regulators' behaviour. As a result, banks must maximise returns on invested inputs and recognise that the use of income smoothing vehicles harms efficiency and competitiveness. Additionally, findings suggest that the adoption of alternative loss provisioning systems, such as a dynamic provisioning system whereby provisions adapt to economic stages should be considered. This implementation will contribute to credit cycle smoothing by increasing the effectiveness of macro-prudential policies while preserving the financial system and financial reports' temerity. This paper's findings may also benefit regulators charged with enforcing corporate governance standards. When EM is significant enough to jeopardise information transparency and quality, new governance measures may be required and place a higher premium on effective governance implementation. Results also demonstrate that both large and small banks should optimise resource allocations to stem the trending temporal decline in efficiency. This study also illuminates the frontier market idiosyncrasies, a consequence of their limited transparency, weak management capabilities, and inadequate investment in productivity-enhancing capabilities such as technology, (Iqbal, 2007), implying investors receive compensation for the additional risk.
6.3. Limitations and future research
Inputs and outputs of this study were examined in aggregate and compared to the estimated frontier. As a theoretical extension of previous research, future research may benefit by examining the sensitivity of individual efficiency inputs and outputs to help banks determine where gains can be best gotten. Significant constraints in income-increasing EM can be achieved with this addition (Kanagaretnam et al., 2010). Future studies may also consider the inclusion of additional bank-level (i.e., auditor reputations and earnings quality) and country-level control variables (i.e., anti-director rights, legal enforcement, timeliness of financial disclosure, and analyst coverage) to account for bank and country-specific heterogeneity.
Declarations
Author contribution statement
Wil Martens: Conceived and designed the experiments; Performed the experiments; Analyzed and interpreted the data; Contributed reagents, materials, analysis tools or data; Wrote the paper.
Prem W.S. Yapa, Maryam Safari and Sean Watts: Contributed reagents, materials, analysis tools or data.
Funding statement
This research did not receive any specific grant from funding agencies in the public, commercial, or not-for-profit sectors.
Data availability statement
The authors do not have permission to share data.
Declaration of interests statement
The authors declare no conflict of interest.
Additional information
No additional information is available for this paper.
Footnotes
To provide background on issues in frontier markets, this study highlights Lithuania, a frontier market country that lost access to parts of its assets held in Russia after the collapse of the Soviet Empire (Zoli, 2001). Examples of solvency concerns are those experienced by Central and Eastern European countries and the Commonwealth of Independent States; during their transition processes of removing enterprise subsidies and towards internal and external liberalisation, they possessed extensive non-performing loans (Tang et al., 1999). To inform of crises, this study notes the 1994 Latin America debt crisis, 1997 East Asian financial crisis due to currency devaluations (Patel and Sarkar, 1998; Leung, 2009), as well as the 2007-2008 Subprime mortgage crisis.
Source: World Bank, 2017.
The Morgan Stanley Capital International (MSCI) Frontier Market Index captures large and mid-cap representation across frontier markets, covering about 85% of the free float-adjusted market capitalisation in each country in 2017.
Source: Refinitiv January 2014 to December 2018. S& P return 40.7%. MSCI Frontier Market Index return -14.9%.
Transition economies are those countries moving from a centrally planned economy to a market economy (Turley and Luke, 2012).
Study sample: Bahrain, Bangladesh, Brunei, Egypt, Indonesia, Jordan, Kuwait, Malaysia, Mauritania, Pakistan, Palestine, Qatar, Sudan, Tunisia, Turkey, UAE, and Yemen.
As defined by capital adequacy ratios and earnings before provisions and contingencies.
Examples of progress include Leontief production function, constant elasticity of substitution (CES), and transcendental logarithmic production and cost functions.
Scale efficiency measures the level of output for which the average cost is examined. Scope efficiency examines the average cost and the creation of varieties of outputs. Operational efficiency measures maximum achievable output for a given level of inputs (Said, 2012).
LLP is an income statement and expense account utilised to reflect expected future losses that can arise from loan portfolios. LLP are applied to LLR, a balance sheet contra-asset for loans which serves as a cushion in the event of loan losses (Ahmed et al., 1999)).
The choice for the random effects regression stems from its out-performance over the fixed effect model in explaining mean technical efficiency (Odeck and Bråthen, 2012). The Breusch-Pagan Lagrange Multiplier test supports the Hausman test, which indicates that the random effects (RE) model is most appropriate. Support for the truncated regression over the use of a Tobit regression as per Casu and Molyneux (2003) and Batir et al. (2017), follows suggestions made by Simar and Wilson (2007) and Perelman and Serebrisky (2010), who note that the choice of a truncated model is dictated by the nature of the technical efficiency measure, which by definition is bounded at 1.0.
Local banks suffered heavy losses during the global financial crisis, losses which were amortised from 2012 onward (Račickas and Vasiliauskaitė, 2010).
Hussain et al. (2020b) note that inflation reduces the real value of non-performing loans and thus is preferred by banks, while Kamarudin et al. (2016) posit that volatile economic growth (proxied by GDP growth) decreases demand for financial services, increases loan defaults, and lowers outputs.
References
- Abebe S. St. Mary's University; 2020. Assessment of loan recovery performance in Wegagen Bank SC. Ph.D. thesis. [Google Scholar]
- Abernathy J.L., Beyer B., Rapley E.T. Earnings management constraints and classification shifting. J. Bus. Finance Account. 2014;41:600–626. [Google Scholar]
- Abidi N., Hacibedel M.B., Nkusu M.M. International Monetary Fund; 2016. Changing times for frontier markets: a perspective from portfolio investment flows and financial integration. [Google Scholar]
- Adams B., Carow K.A., Perry T. Earnings management and initial public offerings: the case of the depository industry. J. Bank. Finance. 2009;33:2363–2372. [Google Scholar]
- Adelopo I., Lloydking R., Tauringana V. Determinants of bank profitability before, during, and after the financial crisis. Int. J. Manag. Finance. 2018;14:378–398. [Google Scholar]
- Aghimien P.A., Kamarudin F., Hamid M., Noordin B. Efficiency of gulf cooperation council banks: empirical evidence using data envelopment analysis. Rev. Int. Bus. Strategy. 2016 [Google Scholar]
- Ahmed A., Mohammed A.Y., Adisa A.O. Loan loss provision and earnings management in Nigerian deposit money banks. Mediterr. J. Soc. Sci. 2014;5:49. [Google Scholar]
- Ahmed A.S., Takeda C., Thomas S. Bank loan loss provisions: a reexamination of capital management, earnings management and signaling effects. J. Account. Econ. 1999;28:1–25. [Google Scholar]
- Ajao A., Ogunniyi L. Technical and scale efficiency of commercial banks in Nigeria. IUP J. Appl. Econ. 2010;9:59. [Google Scholar]
- Alsharif M., Nassir A.M., Kamarudin F., Zariyawati M. The productivity of gcc Islamic and conventional banks after basel iii announcement. J. Islam. Account. Bus. Res. 2019 [Google Scholar]
- Altamuro J., Beatty A. How does internal control regulation affect financial reporting? J. Account. Econ. 2010;49:58–74. [Google Scholar]
- Altunbas Y., Carbo S., Gardener E.P., Molyneux P. Examining the relationships between capital, risk and efficiency in European banking. Eur. Financ. Manag. 2007;13:49–70. [Google Scholar]
- Altunbas Y., Evans L., Molyneux P. Bank ownership and efficiency. J. Money Credit Bank. 2001:926–954. [Google Scholar]
- Anandarajan A., Hasan I., Lozano-Vivas A. Loan loss provision decisions: an empirical analysis of the Spanish depository institutions. J. Int. Account. Audit. Tax. 2005;14:55–77. [Google Scholar]
- Anandarajan A., Hasan I., McCarthy C. 2006. The Use of Loan Loss Provisions for Capital Management, Earnings Management, and Signaling by Australian Banks. Discussion Papers. Bank of Finland Research. [Google Scholar]
- Anandarajan A., Hasan I., McCarthy C. Use of loan loss provisions for capital, earnings management and signalling by Australian banks. Account. Finance. 2007;47:357–379. [Google Scholar]
- Anwar M., Nidar S.R., Komara R., Layyinaturrobaniyah L. Rural bank efficiency and loans for micro and small businesses: evidence from West Java Indonesia. Int. J. Emerg. Mark. 2019 [Google Scholar]
- Ariff M., Luc C. Cost and profit efficiency of Chinese banks: a non-parametric analysis. China Econ. Rev. 2008;19:260–273. [Google Scholar]
- Arora N., Arora N.G., Kanwar K. Non-performing assets and technical efficiency of Indian banks: a meta-frontier analysis. Benchmarking. 2018 [Google Scholar]
- Arshad S., Rizvi S.A.R., Haroon O. Understanding Asian emerging stock markets. Bul. Ekon. Monet. Perbank. 2019;21:495–510. [Google Scholar]
- Azad M.A.K., Munisamy S., Masum A.K.M., Saona P., Wanke P. Bank efficiency in Malaysia: a use of Malmquist meta-frontier analysis. Eurasian Bus. Rev. 2017;7:287–311. [Google Scholar]
- Balla E., Rose M.J. Loan loss reserves, accounting constraints, and bank ownership structure. Account. Constr. Bank Ownership Struct. (November 17, 2011) 2011 [Google Scholar]
- Bank W. Market capitalization of listed domestic companies (% of gdp) — data. 2020. https://data.worldbank.org/indicator/CM.MKT.LCAP.GD.ZS
- Bao S.R., Lewellyn K.B. Ownership structure and earnings management in emerging markets—an institutionalized agency perspective. Int. Bus. Rev. 2017;26:828–838. [Google Scholar]
- Batir T.E., Volkman D.A., Gungor B. Determinants of bank efficiency in Turkey: participation banks versus conventional banks. Borsa Istanb. Rev. 2017;17:86–96. [Google Scholar]
- Battese G.E., Coelli T.J. A model for technical inefficiency effects in a stochastic frontier production function for panel data. Empir. Econ. 1995;20:325–332. [Google Scholar]
- Battese G.E., Heshmati A., Hjalmarsson L. Efficiency of labour use in the Swedish banking industry: a stochastic frontier approach. Empir. Econ. 2000;25:623–640. [Google Scholar]
- Bdour J.I., Al-khoury A.F. Predicting change in bank efficiency in Jordan: a data envelopment analysis. J. Account. Organ. Change. 2008;4:162–181. [Google Scholar]
- Beatty A.L., Ke B., Petroni K.R. Earnings management to avoid earnings declines across publicly and privately held banks. Account. Rev. 2002;77:547–570. [Google Scholar]
- Berger A.N., Humphrey D.B. Efficiency of financial institutions: international survey and directions for future research. Eur. J. Oper. Res. 1997;98:175–212. [Google Scholar]
- Berger A.N., Mester L.J. Inside the black box: what explains differences in the efficiencies of financial institutions? J. Bank. Finance. 1997;21:895–947. [Google Scholar]
- Bouvatier V., Lepetit L. Banks' procyclical behavior: does provisioning matter? J. Int. Financ. Mark. Inst. Money. 2008;18:513–526. [Google Scholar]
- Bouvatier V., Lepetit L. Effects of loan loss provisions on growth in bank lending: some international comparisons. Econ. Int. 2012:91–116. [Google Scholar]
- Boyd J.H., De Nicolo G. The theory of bank risk taking and competition revisited. J. Finance. 2005;60:1329–1343. [Google Scholar]
- Casu B., Molyneux P. A comparative study of efficiency in European banking. Appl. Econ. 2003;35:1865–1876. [Google Scholar]
- Chen M.P., Chen P.F., Lee C.C. Frontier stock market integration and the global financial crisis. N. Am. J. Econ. Finance. 2014;29:84–103. [Google Scholar]
- Chipalkatti N., Rishi M. Do Indian banks understate their bad loans? J. Dev. Areas. 2007:75–91. [Google Scholar]
- Cho M., Chung K.H. The effect of commercial banks' internal control weaknesses on loan loss reserves and provisions. J. Contemp. Account. Econ. 2016;12:61–72. [Google Scholar]
- Choi J.H., et al. 2017. Accrual Accounting and Resource Allocation: a General Equilibrium Analysis. Technical Report. [Google Scholar]
- Clark G.L., Thrift N. The return of bureaucracy: managing dispersed knowledge in global finance. Soc. Fin. Mark. 2005:229–249. [Google Scholar]
- Cobb C.W., Douglas P.H. A theory of production. Am. Econ. Rev. 1928;18:139–165. [Google Scholar]
- Colesnic O., Kounetas K., Michael P. Estimating risk efficiency in middle East banks before and after the crisis: a metafrontier framework. Global Finance J. 2019;100484 [Google Scholar]
- De B. Fifth Annual Conference on Money and Finance in the Indian Economy. Indira Gandhi Institute of Development Research (IGIDR); Mumbai: 2003. Ownership effect on bank performance. [Google Scholar]
- Devine P.J., Lee N., Jones R., Tyson W.J. Routledge; 2018. An Introduction to Industrial Economics. [Google Scholar]
- Dietrich A., Wanzenried G. The determinants of commercial banking profitability in low-, middle-, and high-income countries. Q. Rev. Econ. Finance. 2014;54:337–354. [Google Scholar]
- Ding D., Sickles R.C. Frontier efficiency, capital structure, and portfolio risk: an empirical analysis of us banks. BRQ Bus. Res. Q. 2018;21:262–277. [Google Scholar]
- Djalilov K., Piesse J. Determinants of bank profitability in transition countries: what matters most? Res. Int. Bus. Finance. 2016;38:69–82. [Google Scholar]
- Dolar B. Cyclicality of loan loss provisioning in the US banking industry: evidence from the period 1993–2007. J. Bus. Econ. Stud. 2019;23:1–17. [Google Scholar]
- Dolar B., Drickey K.M. The differential impact of size on earnings management practices of banks: evidence from the financial crisis of 2008. J. Bus. Finance Account. 2017;10:63–80. [Google Scholar]
- Dong X. Research on the relationship of commercial bank's loan loss provision and earning management and capital management. J. Serv. Sci. Manage. 2012;05:171–179. [Google Scholar]
- Duffie D. Financial regulatory reform after the crisis: an assessment. Manag. Sci. 2018;64:4835–4857. [Google Scholar]
- Emrouznejad A., Yang G.l. A survey and analysis of the first 40 years of scholarly literature in dea: 1978–2016. Socio-Econ. Plan. Sci. 2018;61:4–8. [Google Scholar]
- Farandy A.R., Suwito D.A., Dabutar L.K. Efficiency of Islamic banks in Indonesia: data envelopment analysis. Int. J. Econ. Manage. Account. 2017;25:337–354. [Google Scholar]
- Ferro G., León S., Romero C.A., Wilson D. From scratch to efficiency gains after a financial crisis? A tale of a restructured banking system. Int. Rev. Appl. Econ. 2018;32:119–133. [Google Scholar]
- Fonseca A., González F. Cross-country determinants of bank income smoothing by managing loan-loss provisions. J. Bank. Finance. 2008;32:217–228. [Google Scholar]
- FTSE 2020. https://research.ftserussell.com/products/downloads/FTSE-Country-Classification-Update-2018.pdf FTSE-Country-Classification-Update-2018.pdf.
- Ghosh S. Loan loss provisions, earnings, capital management and signalling: evidence from Indian banks. Glob. Econ. Rev. 2007;36:121–136. [Google Scholar]
- Girardone C., Molyneux P., Gardener E.P. Analysing the determinants of bank efficiency: the case of Italian banks. Appl. Econ. 2004;36:215–227. [Google Scholar]
- Gishkori M.A., Ullah N. Technical efficiency of Islamic and commercial banks: evidence from Pakistan using dea model (2007-2011) J. Bus. Manag. 2013;7:68–76. [Google Scholar]
- Grant W., Wilson G.K. Oxford University Press; 2012. The Consequences of the Global Financial Crisis: The Rhetoric of Reform and Regulation. [Google Scholar]
- Gulzar M.A., et al. Corporate governance characteristics and earnings management: empirical evidence from Chinese listed firms. Int. J. Account. Financ. Rep. 2011;1:133. [Google Scholar]
- Hasan I., Hunter W.C. Loan loss provision and income smoothing: an analysis of the thrift industry. Adv. Quant. Anal. Finance Account. 1999;7:67–81. [Google Scholar]
- Hassan K.M., Sanchez B. 2009. Efficiency analysis of microfinance institutions in developing countries. Networks Financial Institute Working Paper. [Google Scholar]
- Hjalmarsson L., Kumbhakar S.C., Heshmati A. Dea, dfa and sfa: a comparison. J. Product. Anal. 1996;7:303–327. [Google Scholar]
- Huang X.S., Sun L. Managerial ability and real earnings management. Adv. Account. 2017;39:91–104. [Google Scholar]
- Hussain H.I., Kamarudin F., Mohamad Anwar N.A., Nassir A.M., Sufian F., Tan K.M. Impact of country's governance dimensions on bank revenue efficiency: overview on middle East, southeast Asia, and South Asia countries. Transform. Bus. Econ. 2020;19 [Google Scholar]
- Hussain H.I., Kot S., Kamarudin F., Wong C.M. The nexus of competition freedom and the efficiency of microfinance institutions. J. Compet. 2020;12:67. [Google Scholar]
- IMF Imf occasional paper 188 – financial sector crisis and restructuring–lessons from Asia. 2020. https://www.imf.org/external/pubs/ft/op/opFinsec/op188.pdf
- Iqbal Z. Challenges facing Islamic financial industry. J. Islam. Econ. Bank. Finance. 2007;3:1–14. [Google Scholar]
- Jackson S.B., Liu X. The allowance for uncollectible accounts, conservatism, and earnings management. J. Account. Res. 2010;48:565–601. [Google Scholar]
- Jemric I., Vujcic B. Efficiency of banks in Croatia: a dea approach. Comp. Econ. Stud. 2002;44:169–193. [Google Scholar]
- Jin J., Kanagaretnam K., Lobo G.J. Discretion in bank loan loss allowance, risk taking and earnings management. Account. Finance. 2018;58:171–193. [Google Scholar]
- Johnes J., Izzeldin M., Pappas V. A comparison of performance of Islamic and conventional banks 2004–2009. J. Econ. Behav. Organ. 2014;103:S93–S107. [Google Scholar]
- Kahneman D., Tversky A. An analysis of decision under risk. Econometrica. 1979;47 [Google Scholar]
- Kamarudin F., Amin Nordin B.A., Nasir A.M. Price efficiency and returns to scale of banking sector in gulf cooperative council countries: empirical evidence from Islamic and conventional banks. Econ. Comput. Econ. Cybern. Stud. Res. 2013;47 [Google Scholar]
- Kamarudin F., Anwar N.A.M., Nassir A.M., Sufian F., Tan K.M., Hussain H.I. Does country governance and bank productivity nexus matters? J. Islam. Market. 2020 [Google Scholar]
- Kamarudin F., Hue C.Z., Sufian F., Anwar N.A.M. Does productivity of Islamic banks endure progress or regress? Empirical evidence using data envelopment analysis based Malmquist productivity index. Humanomics. 2017 [Google Scholar]
- Kamarudin F., Nasir A., Yahya M.H., Said R.M., Nordin B.A.A. Islamic banking sectors in gulf cooperative council countries: analysis on revenue, cost and profit efficiency concepts. J. Econ. Cooper. Dev. 2014;35:1–42. [Google Scholar]
- Kamarudin F., Sufian F., Nassir A.M. Does country governance foster revenue efficiency of Islamic and conventional banks in gcc countries? EuroMed J. Bus. 2016 [Google Scholar]
- Kamau A.W. Intermediation efficiency and productivity of the banking sector in Kenya. Interdiscip. J. Res. Bus. 2011;1:12–26. [Google Scholar]
- Kanagaretnam K., Krishnan G.V., Lobo G.J. Is the market valuation of banks' loan loss provision conditional on auditor reputation? J. Bank. Finance. 2009;33:1039–1047. [Google Scholar]
- Kanagaretnam K., Lee J., Lim C.Y., Lobo G.J. Relation between auditor quality and tax aggressiveness: implications of cross-country institutional differences. Auditing. 2016;35:105–135. [Google Scholar]
- Kanagaretnam K., Lim C.Y., Lobo G.J. Auditor reputation and earnings management: international evidence from the banking industry. J. Bank. Finance. 2010;34:2318–2327. [Google Scholar]
- Kanagaretnam K., Lim C.Y., Lobo G.J. Influence of national culture on accounting conservatism and risk-taking in the banking industry. Account. Rev. 2014;89:1115–1149. [Google Scholar]
- Kanagaretnam K., Lobo G.J., Yang D.H. Joint tests of signaling and income smoothing through bank loan loss provisions. Contemp. Account. Res. 2004;21:843–884. [Google Scholar]
- Kanagaretnam K., Lobo G.J., Wang C. Religiosity and earnings management: international evidence from the banking industry. J. Bus. Ethics. 2015;132:277–296. [Google Scholar]
- Kea S., Li H., Pich L. Technical efficiency and its determinants of rice production in Cambodia. Economies. 2016;4:22. [Google Scholar]
- Kilic E., Lobo G.J., Ranasinghe T., Sivaramakrishnan K. The impact of sfas 133 on income smoothing by banks through loan loss provisions. Account. Rev. 2012;88:233–260. [Google Scholar]
- Koch T.W., Wall L.D. 2000. The use of accruals to manage reported earnings: Theory and evidence. Federal Reserve Bank of Atlanta working paper 23. [Google Scholar]
- Kumar S., Gulati R. Measuring efficiency, effectiveness and performance of Indian public sector banks. Int. J. Product. Perform. Manage. 2009;59:51–74. [Google Scholar]
- Kumbhakar S.C., Lozano-Vivas A., Lovell C.K., Hasan I. The effects of deregulation on the performance of financial institutions: the case of Spanish savings banks. J. Money Credit Bank. 2001:101–120. [Google Scholar]
- Laeven L., Majnoni G. Loan loss provisioning and economic slowdowns: too much, too late? J. Financ. Intermed. 2003;12:178–197. [Google Scholar]
- Leika M., Perez-Saiz H., Stankova O.I., Wezel T. Stress testing in sub-Saharan Africa: practices, communications, and capacity development. J. Issue. 2020;2020:7. [Google Scholar]
- Leung S. Banking and financial sector reforms in Vietnam. ASEAN Econ. Bull. 2009:44–57. [Google Scholar]
- Leuz C., Nanda D., Wysocki P.D. Earnings management and investor protection: an international comparison. J. Financ. Econ. 2003;69:505–527. [Google Scholar]
- Leventis S., Dimitropoulos P.E., Anandarajan A. Loan loss provisions, earnings management and capital management under ifrs: the case of eu commercial banks. J. Financ. Serv. Res. 2011;40:103–122. [Google Scholar]
- Liao C.S. Evaluation and comparison of bank efficiency in cross-strait after ecfa. J. Asian Finance Econ. Bus. 2020;7:783–793. [Google Scholar]
- Licht A.N., Goldschmidt C., Schwartz S.H. Culture rules: the foundations of the rule of law and other norms of governance. J. Comp. Econ. 2007;35:659–688. [Google Scholar]
- Lin Y.R., Fu X.M. Does institutional ownership influence firm performance? Evidence from China. Int. Rev. Econ. Finance. 2017;49:17–57. [Google Scholar]
- Liu C.C., Ryan S. Income smoothing over the business cycle: changes in banks coordinated management of provisions for loan losses and loan charge-offs from the pre-1990 bust to the 1990s boom. Account. Rev. 2003;81 [Google Scholar]
- Lobo G.J., Yang D.H. Bank managers' heterogeneous decisions on discretionary loan loss provisions. Rev. Quant. Finance Account. 2001;16:223–250. [Google Scholar]
- Loong F., Kamarudin F., Sufian F., Naseem N. Estimating efficiency in domestic and foreign Islamic banking and its determinants among three neighboring countries-Malaysia, Indonesia and Brunei. Int. J. Econ. Manage. 2017;11 [Google Scholar]
- López Salazar A., Contreras Soto R., Espinosa Mosqueda R. The impact of financial decisions and strategy on small business competitiveness. Glob. J. Bus. Res. 2012;6:93–103. [Google Scholar]
- Ma C.K. Loan loss reserves and income smoothing: the experience in the US banking industry. J. Bus. Finance Account. 1988;15:487–497. [Google Scholar]
- Maity S., Sahu T.N. Is the efficiency of banks degenerating due to the mounting of non-performing assets? An empirical investigation using dea. Malaysian Manage. J. 2020;23:65–86. [Google Scholar]
- Martens W., Yapa P., Safari M. Earnings management in frontier market: do institutional settings matter? Economies. 2021;9:17. [Google Scholar]
- Martens W., Yapa P.W., Safari M. The impact of financial statement comparability on earnings management: evidence from frontier markets. Int. J. Financ. Stud. 2020;8:73. [Google Scholar]
- Mester L.J. A study of bank efficiency taking into account risk-preferences. J. Bank. Finance. 1996;20:1025–1045. [Google Scholar]
- Miencha I.O., Murugesan S., Vasanth V., Lingaraja K., Raja M. Efficiency measurement of Kenyan commercial banks. Mediterr. J. Soc. Sci. 2015;6:621. [Google Scholar]
- Mlambo K., Ncube M. Competition and efficiency in the banking sector in South Africa. Afr. Dev. Rev. 2011;23:4–15. [Google Scholar]
- MSC1 Market classification - MSCI. 2019. https://www.msci.com/market-classification
- MSCI Market classification - msci. 2019. https://www.msci.com/market-classification
- Murillo-Zamorano L.R., Vega-Cervera J.A. The use of parametric and non-parametric frontier methods to measure the productive efficiency in the industrial sector: a comparative study. Int. J. Prod. Econ. 2001;69:265–275. [Google Scholar]
- Navaretti G.B., Calzolari G., Pozzolo A.F., de Daverio M.T.T. Few large with many small: banks size distribution and cross-border financial linkages. J. Financ. Serv. Res. 2019;56:229–258. [Google Scholar]
- Nguyen T.P.T., Nghiem S.H., Roca E., Sharma P. Bank reforms and efficiency in Vietnamese banks: evidence based on sfa and dea. Appl. Econ. 2016;48:2822–2835. [Google Scholar]
- Noble G.W., Ravenhill J. Cambridge University Press; 2000. The Asian Financial Crisis and the Architecture of Global Finance. [Google Scholar]
- Novickytė L., Droždz J. Measuring the efficiency in the Lithuanian banking sector: the dea application. Int. J. Financ. Stud. 2018;6:37. [Google Scholar]
- Odeck J., Bråthen S. A meta-analysis of dea and sfa studies of the technical efficiency of seaports: a comparison of fixed and random-effects regression models. Transp. Res., Part A, Policy Pract. 2012;46:1574–1585. [Google Scholar]
- Odell J., Ali U. Esg investing in emerging and frontier markets. J. Appl. Corp. Finance. 2016;28:96–101. [Google Scholar]
- Olson D., Zoubi T.A. Efficiency and bank profitability in mena countries. Emerg. Mark. Rev. 2011;12:94–110. [Google Scholar]
- Ozili P.K. Bank earnings smoothing, audit quality and procyclicality in Africa: the case of loan loss provisions. Rev. Account. Finance. 2017;16:142–161. [Google Scholar]
- Ozili P.K. Discretionary provisioning practices among western European banks. J. Financ. Econ. Policy. 2017;9:109–118. [Google Scholar]
- Patel S.A., Sarkar A. Crises in developed and emerging stock markets. Financ. Anal. J. 1998;54:50–61. [Google Scholar]
- Perelman S., Serebrisky T. The World Bank; 2010. Measuring the Technical Efficiency of Airports in Latin America. [Google Scholar]
- Peterson O.K., Arun T.G. Income smoothing among European systemic and non-systemic banks. Br. Account. Rev. 2018;50:539–558. [Google Scholar]
- Porter M.E. Competitive strategy. Meas. Bus. Excell. 1997;1:12–17. [Google Scholar]
- Poshakwale S.S., Qian B. Competitiveness and efficiency of the banking sector and economic growth in Egypt. Afr. Dev. Rev. 2011;23:99–120. [Google Scholar]
- Račickas E., Vasiliauskaitė A. Global financial crisis and its impact on Lithuanian economy. Ekon. Vadyb. 2010:1006–1017. [Google Scholar]
- Rozzani N., Rahman R.A. Determinants of bank efficiency: conventional versus Islamic. Int. J. Bus. Manag. 2013;8:98–109. [Google Scholar]
- Ruslan A., Pahlevi C., Alam S., Nohong M. The role of efficiency mediation in the effect of banks size on bank profitability in Indonesia. Hasanuddin Econ. Bus. Rev. 2019;3:49–58. [Google Scholar]
- Said A. Comparing the change in efficiency of the western and Islamic banking systems. J. Money Invest. Bank. 2012;23:149–180. [Google Scholar]
- Sakouvogui K. A comparative approach of stochastic frontier analysis and data envelopment analysis estimators: evidence from banking system. J. Econ. Stud. 2020 [Google Scholar]
- Saurina J. Loan loss provisions in Spain. A working macroprudential tool. Rev. Estab. Financ. 2009;17:11–26. [Google Scholar]
- Sealey C.W., Jr, Lindley J.T. Inputs, outputs, and a theory of production and cost at depository financial institutions. J. Finance. 1977;32:1251–1266. [Google Scholar]
- Shamshur A., Weill L. Does bank efficiency influence the cost of credit? J. Bank. Finance. 2019;105:62–73. [Google Scholar]
- Shen C.H., Chih H.L. Investor protection, prospect theory, and earnings management: an international comparison of the banking industry. J. Bank. Finance. 2005;29:2675–2697. [Google Scholar]
- Shu P.G., Yeh Y.H., Yamada T. The behavior of Taiwan mutual fund investors—performance and fund flows. Pac.-Basin Finance J. 2002;10:583–600. [Google Scholar]
- Siems T.F., et al. Quantifying management's role in bank survival. Econ. Rev. 1992;20:29–41. [Google Scholar]
- Silva T.C., Tabak B.M., Cajueiro D.O., Dias M.V.B. A comparison of dea and sfa using micro- and macro-level perspectives: efficiency of Chinese local banks. Phys. A, Stat. Mech. Appl. 2017;469:216–223. [Google Scholar]
- Silva T.C., Tabak B.M., Cajueiro D.O., Dias M.V.B. Adequacy of deterministic and parametric frontiers to analyze the efficiency of Indian commercial banks. Phys. A, Stat. Mech. Appl. 2018;506:1016–1025. [Google Scholar]
- Simar L., Wilson P.W. Estimation and inference in two-stage, semi-parametric models of production processes. J. Econom. 2007;136:31–64. [Google Scholar]
- Speidell L. 2011. Frontier Markets Equity Investing: Finding the Winners of the Future. CFA Institute Research Foundation M2011-2. [Google Scholar]
- Speidell L.S., Krohne A. The case for frontier equity markets. J. Invest. 2007;16:12–22. [Google Scholar]
- Sufian F., Akbar Noor Mohamad Noor M. The determinants of Islamic banks' efficiency changes: empirical evidence from the mena and Asian banking sectors. Int. J. Islam. Middle Eastern Finance Manage. 2009;2:120–138. [Google Scholar]
- Sufian F., Kamarudin F. Efficiency and returns to scale in the Bangladesh banking sector: empirical evidence from the slack-based dea method. Asia-Pac. J. Bus. 2014;5:1–11. [Google Scholar]
- Sufian F., Kamarudin F. The impact of ownership structure on bank productivity and efficiency: evidence from semi-parametric Malmquist productivity index. Cogent Econ. Finance. 2014;2 [Google Scholar]
- Sufian F., Kamarudin F. The impact of globalization on the performance of banks in South Africa. Rev. Int. Bus. Strategy. 2016 [Google Scholar]
- Taktak N.B., Zouari S.B.S., Boudriga A. Do Islamic banks use loan loss provisions to smooth their results? J. Islam. Account. Bus. Res. 2010 [Google Scholar]
- Tang H., Zoli E., Klytchnikova I. The World Bank; 1999. Banking Crises in Transition Economies: Fiscal Costs and Related Issues. [Google Scholar]
- Tek Wei Saw A., Kamarudin F., Latiff A.S.A. Price efficiency of Islamic and conventional banks: evidence from panel data. Int. J. Econ. Manage. 2020;14 [Google Scholar]
- Thiemann M. In the shadow of basel: how competitive politics bred the crisis. Rev. Int. Polit. Econ. 2014;21:1203–1239. [Google Scholar]
- Tochkov K., Nenovsky N. Institutional reforms, eu accession, and bank efficiency in transition economies: evidence from Bulgaria. Emerg. Mark. Finance Trade. 2011;47:113–129. [Google Scholar]
- Turley G., Luke P.J. Routledge; 2012. Transition Economics: Two Decades on. [Google Scholar]
- Turner L.E., Godwin J.H. Auditing, earnings management, and international accounting issues at the securities and exchange commission. Account. Horiz. 1999;13:281. [Google Scholar]
- Vo X.V. The role of bank funding diversity: evidence from Vietnam. Int. Rev. Finance. 2020;20:529–536. [Google Scholar]
- Vu H.T., Turnell S. Cost efficiency of the banking sector in Vietnam: a Bayesian stochastic frontier approach with regularity constraints. Asian Econ. J. 2010;24:115–139. [Google Scholar]
- Wahlen J.M. The nature of information in commercial bank loan loss disclosures. Account. Rev. 1994:455–478. [Google Scholar]
- Wang H.J. A stochastic frontier analysis of financing constraints on investment: the case of financial liberalization in Taiwan. J. Bus. Econ. Stat. 2003;21:406–419. [Google Scholar]
- Webb J.W., Bruton G.D., Tihanyi L., Ireland R.D. Research on entrepreneurship in the informal economy: framing a research agenda. J. Bus. Venturing. 2013;28:598–614. [Google Scholar]
- Wu J. 2010. The role of state ownership in commercial banks: Experience of cee transition countries. [Google Scholar]
- Wu Y.C., Ting I.W.K., Lu W.M., Nourani M., Kweh Q.L. The impact of earnings management on the performance of asean banks. Econ. Model. 2016;53:156–165. [Google Scholar]
- Yavas B.F., Rezayat F. Country etf returns and volatility spillovers in emerging stock markets, Europe and USA. Int. J. Emerg. Mark. 2016 [Google Scholar]
- Young K. Financial industry groups' adaptation to the post-crisis regulatory environment: changing approaches to the policy cycle. Regul. Gov. 2013;7:460–480. [Google Scholar]
- Zainal N., Kamarudin F., Hook L.S., Bakri M.H., Sufian F., Nassir A.M. Regulation, supervision and social and financial efficiency of microfinance institutions in asean-5 countries. Malays. J. Econ. Stud. 2020;57:253–273. [Google Scholar]
- Zoli M.E. International Monetary Fund; 2001. Cost and Effectiveness of Banking Sector Restructuring in Transition Economies; pp. 1–157. [Google Scholar]
Associated Data
This section collects any data citations, data availability statements, or supplementary materials included in this article.
Data Availability Statement
The authors do not have permission to share data.