

ABSTRACT
Early initiated adequate antibiotic treatment is essential in intensive care. Shortening the length of antibiotic susceptibility testing (AST) can accelerate clinical decision-making. Our objective was to develop a simple flow cytometry (FC)-based AST that produces reliable results within a few hours. We developed a FC-based AST protocol (MICy) and tested it on six different bacteria strains (Escherichia coli, Klebsiella pneumoniae, Pseudomonas aeruginosa, Staphylococcus aureus, Streptococcus pyogenes, Enterococcus faecalis) in Mueller-Hinton and Luria–Bertani broth. We monitored the bacterial growth by FC to define the optimal time of AST. All bacteria were tested against 12 antibiotics and the MIC values were compared to microdilution used as reference method. McNemar and Fleiss’ kappa inter-observer tests were performed to analyze the bias between the two methods. Susceptibility profiles of the two methods were also compared. We found that FC is able to detect the bacterial growth after 4-h incubation. The point-by-point comparison of MICy and microdilution resulted in exact match above 87% (2642/3024) of all measurements. The MIC values obtained by MICy and microdilution agreed over 80% (173/216) within ±1 dilution range that gives a substantial inter-observer agreement with weighted Fleiss’ kappa. By using the EUCAST clinical breakpoints, we defined susceptibility profiles of MICy that were identical to microdilution in more than 92% (197/213) of the decisions. MICy resulted 8.7% major and 3.2% very major discrepancies. MICy is a new, simple FC-based AST method that produces susceptibility profile with low failure rate a workday earlier than the microdilution method.
IMPORTANCE MICy is a new, simple and rapid flow cytometry based antibiotic susceptibility testing (AST) method that produces susceptibility profile a workday earlier than the microdilution method or other classical phenotypic AST methods. Shortening the length of AST can accelerate clinical decision-making as targeted antibiotic treatment improves clinical outcomes and reduces mortality, duration of artificial ventilation, and length of stay in intensive care unit. It can also reduce nursing time and costs and the spreading of antibiotic resistance. In this study, we present the workflow and methodology of MICy and compare the results produced by MICy to microdilution step by step.
KEYWORDS: flow cytometry, MIC, antibiotic susceptibility testing, rapid tests
INTRODUCTION
Proper antibiotic treatment is essential in all disciplines of medicine, especially in intensive care. Targeted antibiotic treatment based on antimicrobial susceptibility testing (AST) reduces mortality, duration of artificial ventilation, and length of stay in intensive care unit (1–3). It can also reduce nursing time and costs (4) and the spreading of antibiotic resistance (5, 6). Up-to-date clinical guidelines identified early AST as one of the most critical issues that need to be improved (5, 7, 8). Numerous studies report methods that can determine the susceptibility profile of a pathogen faster (9). An ideal AST should be reliable, fast, inexpensive, automatized, capable of high throughput, and coupled with simple data processing (10, 11). Still, the most frequently used diagnostic methods in clinical practice are the classical techniques such as microdilution. These methods are simple and capable of high throughput but also slow and labor intensive (9, 12). Although several new methods have been developed following the suggestions of the WHO (13), no test became superior to the classical methods in clinical practice (9, 12).
Flow cytometry (FC) is a robust technique that is able to detect bacteria as single particles, and it can also provide information on the integrity and the viability of antibiotic-treated bacteria (14–16). Despite many advantages of FC, it is still not implemented in the practice of clinical microbiology. The hitherto presented FC based AST studies focused on changes in light scattering characteristics (17, 18), membrane potential (19, 20) and membrane permeability (21, 22) to differentiate dead and viable bacteria. Although these parameters are crucial indicators of bacterial viability, there are no existing clinical standards or reference values to interpret changes of these parameters. No systematic clinical studies were performed to validate these preliminary FC observations. Moreover, the FC assays are challenging and need complex data processing and experts for data evaluation (23). These requirements and the lack of clinical experience are strong limitations of the use of multi-parametric FC-based non-phenotypic ASTs (12, 24). Some studies applied FC bacteria counting to follow the bacterial growth after antibiotic treatment (25, 26). Although these methods resulted in phenotypic MIC values, no systematic study was performed to validate these methods. Accordingly, FC based AST has reached limited success and the early scientific interest declined in the last 10 years (9, 12).
In a recent study, our group demonstrated that an FC-based assay can reliably quantify the antibacterial effect of neutrophils and subcellular structures a workday earlier than the reference methods (27). Based on these observations, we hypothesized that FC is suitable for rapid AST as well. In this study, we present a simple FC-based AST named “MICy” (combined from MIC and cytometry) that measures bacterial count changes in the presence of antibiotics. We compared the measured phenotypic MIC values and the defined susceptibility profiles to the gold standard.
RESULTS
Fluorescent labeling and fixation of bacteria.
Labeling the bacteria and stopping their growth is a reasonable one-step process. Fig. 1A demonstrates three independent measurements of Gram positive and negative bacteria analyzed by FC immediately after fixation or 2 and 4 h later. During the test period, samples were held at room temperature under usual laboratory light exposition. Neither significant bacterial growth nor detectable decrease of the number of fluorescent particles (due to fluorescence quenching) was observed (Fig. 1B).
FIG 1.

Determination of incubation time for detectable bacterial growth and stability of fluorescent labeling. (A) FC quantification of AO labeled bacteria immediately after fixation and 5 min labeling (red bars) and 2 (light blue bars) or 4 (dark blue bars) hours later. Roman numbers indicate three independent measurements. (B) Scatter diagram of all the 18 measurements of panel A. Data were analyzed by one-way RM ANOVA analysis with Tukey’s post hoc test. (C) Representative dot plots of E.coli samples tested at the indicated length of incubation. Ø represents the non-inoculated MH broth. (D) FC quantification of the change of bacterial count to monitor bacterial growth. Samples were taken in every hour up to 6 h. Mean + SEM, n = 3. Data were analyzed with one-way RM ANOVA with Dunetts’s multiple-comparison test. *, P < 0.05.
Determination of incubation time for reliably detectable bacterial growth.
We inoculated six different bacterial species into MH and LB broth and measured the changes of bacterial count to determine the sufficient time for FC monitoring of bacterial growth. Some bacteria showed no clearly detectable growth in the first 3 h of incubation either in LB (not shown) or in MH (Fig. 1C and D). After a 4 h incubation, bacterial count began to increase continuously in the case of all tested bacteria (Fig. 1D) except the aggregate-forming S. aureus (see later). Since prior studies reported promising data after 2 h incubation (22, 26), we performed pilot measurements with 2 h incubation, but these measurements resulted in poor quality data as bacteria did not reach log phase (not shown). In the following experiments, we applied 4 h incubation for MICy measurements.
Empirical definition of flow cytometric MIC value.
We performed 432 AST measurements both with microdilution and MICy: six species of bacteria were tested against 12 antibiotics in three independent repeats both in LB and MH broth. After pairing the FC data with microdilution results, we empirically defined two rules to convert the parametric data of MICy into binary results (growth or inhibition). The first rule refers to bacterial growth: MICy measurements may not be evaluated if the growth rate was lower than 4-fold during the incubation period. Growth rate was measured as the ratio of positive control and the initial bacterial count.
In the case of lower growth ratio, the FC counting was not precise enough to differentiate between growth and inhibition.
The second rule was set to define a cut-off value that discriminates “grown up” samples from inhibited samples. The empirically defined cut-off value was equal to the initial bacterial count. In cases when MICy measured no increased bacteria count than the initial bacterial count, we found inhibition with microdilution a day later. However, microdilution indicated inhibition also in some cases when bacterial count exceeded the initial bacterial count, but there was no further increase in the following dilution. Combining these two observations, we defined the second rule: The first “grown up” sample in an antibiotic serial dilution is the point where the bacterial count exceeds the initial bacterial count and the following serial dilution point exceeds the double of the initial count. Regarding the lowest tested antibiotic concentration (where there was no following data point), we defined it as “grown up” if it was above the initial bacterial count.
After converting the FC data into binary (growth and inhibition) results, MIC was defined as usual: the lowest concentration of an antibiotic that inhibited the bacterial growth.
Modified evaluation of staphylococcal samples.
During the analysis of S. aureus samples, we became aware of an intriguing phenomenon. During the testing, staphylococci start to form aggregates. These aggregates disturb FC counting, since the same amount of bacteria appears as fewer but larger events. This results in a decrease in density of the bacterial population and shifts its geometric mean to higher SSC values (Fig. S2A). To avoid underestimation of bacterial growth, we measured both the event number and the geometric mean of SSC and multiplied them to get a combined parameter. This combined parameter was compared to the similarly generated parameter of the initial bacterial sample by using the second rule.
Point-by-point comparison of data generated by microdilution and MICy.
To reveal the possible bias of the FC measurement, we compared the results of all data points produced by MICy to the parallel microdilution. We found exact match in more than 87% of all measurements regardless of the used medium. The inter-observer agreements Fleiss’ kappa showed substantial agreement between MICy and the microdilution (Table 1 and Table S1). Although there was a better match in case of Gram negative than in the case of Gram positive bacteria, the percentage of +/− (reference/MICy) mismatch was higher in the Gram negative group. The summarized +/− mismatch percentage was around 3% in both MH and LB (Table 1). On the other hand, the −/+ mismatch rate was higher than +/− mismatch rate (Table 1). The unequal distribution of errors was confirmed by the McNemar test (P < 0.0001).
TABLE 1.
Summary table of point-by-point comparison of data generated by microdilution and MICya
| Broth | Bacteria | Measurement | +/+ | −/− | Match % | −/+ | +/− | Mismatch % | Fleiss’ kappa ± SE |
|---|---|---|---|---|---|---|---|---|---|
| Both | All | 3024 | 1271 | 1371 | 87.4% | 286 (9.6%) | 96 (3.2%) | 12.6% | 0.748 ± 0.012 |
| LB | Gram positive | 756 | 234 | 413 | 85.6% | 103 (13.6%) | 6 (0.8%) | 14.4% | 0.700 ± 0.026 |
| Gram negative | 756 | 394 | 277 | 88.8% | 36 (4.8%) | 49 (6.5%) | 11.2% | 0.770 ± 0.024 | |
| LB sum | Both | 1512 | 628 | 690 | 87.2% | 139 (9.2%) | 55 (3.6%) | 12.8% | 0.744 ± 0.017 |
| MH | Gram positive | 756 | 249 | 397 | 85.4% | 98 (12.9%) | 12 (1.6%) | 14.6% | 0.701 ± 0.026 |
| Gram negative | 756 | 394 | 284 | 89.7% | 49 (6.5%) | 29 (3.8%) | 10.3% | 0.789 ± 0.023 | |
| MH sum | Both | 1512 | 643 | 681 | 87.6% | 147 (9.7%) | 41 (2.7%) | 12.4% | 0.752 ± 0.017 |
Indicated numbers represent the number of data points fit in the column. Percentages represent the ratio to all measurements in the category. “+” represents grown up sample, “−” represents inhibition. First part of relations (before slash) refers to microdilution, second part (after slash) to MICy.
Comparison of MIC values.
Next, we compared the MIC values generated by the two methods (Table S2). Fig. S2B shows the MIC value comparison of E. coli measurements originating from three experiments carried out independently on three different days. Since this example of E. coli measurements shows that replicates scatter in both methods, we compared standard deviations (SDs). The pattern of the SDs and the average SD of MICy were similar to the control method (Fig. 2A). This suggests that the reproducibility of MICy is comparable to the microdilution.
FIG 2.

(A) Comparison of reproducibility of MICy and microdilution. Relative units of y axis represent SD of 3 independent replicates, where “1” represents a 2-fold dilution difference. (B) Distribution of MIC differences of the two tested methods. Negative values represent lower MIC defined by MICy, positive values represent higher MIC defined by MICy, n = 216 both for LB (blue bars) and MH (red bars).
Similar to the previous point-by-point data comparison, we found a good correlation between MIC values. The overall MIC essential agreement (MIC pairs matched within ±1 dilution range) in MH was over 80% and the weighted Fleiss’ kappa showed a substantial inter-observer agreement (Table 2). We performed discrepancy resolution testing according to the new ISO/DIS 20776-2 (2021) standard (www.isa.org; downloaded on 10/10/2021) to reveal the true rate of essential agreement (EA). This resulted in over 94% EA in Gram negative and over 83% EA in Gram positive bacteria. We also investigated the bias of MICy. According to the data of the point-by-point comparison, the MICs defined by MICy were slightly higher than the MICs from microdilution (Fig. 2B). We calculated the bias of MICy measurements according to the ISO/DIS 20776-2 standard. The percentage of MICy results greater than the reference method was 39.9% (71 measurements from 178), and the percentage of MICy less than the reference was 22.7%, thus the calculated bias was 17.2%.
TABLE 2.
Comparison table of MIC values originating of microdilution and MICya
| Broth | Bacteria | Measurement | Essential agreement | Discrepancy resolution testing EA | Weighted Fleiss’ kappa ± SE |
|---|---|---|---|---|---|
| Both | All | 432 | 340 (78.7%) | 83.3% | 0.714 |
| LB | Gram positive | 108 | 88 (81.5%) | 69.4% | 0.66 |
| Gram negative | 108 | 79 (73.1%) | 86.1% | 0.731 | |
| LB sum | Both | 216 | 167 (77.3%) | 77.8% | 0.706 |
| MH | Gram positive | 108 | 83 (76.9%) | 83.3% | 0.662 |
| Gram negative | 108 | 90 (83.3%) | 94.4% | 0.76 | |
| MH sum | Both | 216 | 173 (80.1%) | 88.9% | 0.72 |
Essential agreement represents the number and percent of MIC values originating from MICy that were in ±1 2-fold dilution range to the reference method. Essential agreement percent of discrepancy resolution testing was calculated according to ISO/DIS 20776-2:2021 standard.
Analysis of susceptibility profiles.
Susceptibility profiles were generated by comparing measured MIC values in MH to the EUCAST database (Version 9.0, 2019.) breakpoints (Fig. 3). The non-interpretable antibiotics and bacteria combinations were not analyzed any further. In case of Gram positive bacteria there was only a 7.7% major discrepancy between susceptibility results without any minor or very major error (resistant in microdilution but sensitive in MICy) (Table 3). Worse correlation was seen in the profile of Gram negative bacteria. MICy and microdilution resulted in 92% identical decisions. The rate of major discrepancy was 8.7%, and it was 3.2% for very major discrepancies. Intriguingly, most of the inter- and intra-test discrepancies were found in the case of ESBL producing K. pneumoniae. It should be noted that MICy showed resistance in all combinations where natural resistance is known. The summarized susceptibility agreement resulted in a kappa value over 0.84 in Fleiss’ inter-observer test that was referred as almost perfect agreement according to Landis (28); however, the rate of major and very major discrepancies was above the limits demanded by the standards.
FIG 3.

Comparison of susceptibility profiles generated by microdilution and MICy. (A) Gram positive bacteria, (B) Gram negative bacteria. Microdilution (“D”) and MICy (“M”) measurements are paired. Arabic numbers indicate independent replicates. Green box represents susceptibility, red represents resistance, gray represents natural resistance, orange represents intermediate susceptibility, and brown indicates bacteria antibiotics combinations that were not interpreted. Orange circles show minor errors, light blue circles show major errors, black circles show very major errors. n = 216.
TABLE 3.
Summary table of comparison of susceptibility profiles defined by microdilution or MICya
| Bacteria | Measurement | R/R | S/S | Match % | Minor discrep. | Major discrep. | Very major discrep. | Fleiss’ kappa ± SE |
|---|---|---|---|---|---|---|---|---|
| Gram positive | 105 | 40 | 60 | 95.2% | 0 (0%) | 5 (7.7%) | 0 (0%) | 0.865 ± 0.049 |
| Gram negative | 108 | 52 | 45 | 89.8% | 3 (2.8%) | 5 (10%) | 3 (5.5%) | 0.795 ± 0.058 |
| Both | 213 | 92 | 105 | 92.5% | 3 (1.4%) | 10 (8.7%) | 3 (3.2%) | 0.849 ± 0.036 |
“R” represents resistance “S” represents susceptibility. Minor, major, and very major discrepancies were calculated according to ISO 20776-2 (2007) standard.
DISCUSSION
Fast microbiological diagnostics, especially pathogen identification and AST, are important steps for appropriate clinical decision-making, a must for successful and cost-effective treatment of infectious diseases. In this work, we present a simple FC based AST method that produces susceptibility profile with low failure rate a workday earlier than the microdilution method.
The experimental setup of MICy is based on the microdilution (Fig. 4), but the result can be read after 4 h of incubation time. The time advantage of MICy comes from the more sensitive detection of bacterial count changes by FC compared to visual inspection. We also demonstrated that stopping the incubation and fluorescent labeling can be performed as a one-step process. We used AO fluorescent dye to stain bacteria that was intensive enough to be used under common laboratory circumstances (Fig. 1A and B). AO labels bacteria irrespective of their viability as it binds the nucleic acid content of both living and dead cells (29). This attribute makes our MICy method similar to turbidity-based classical methods. Other advantages of AO are the low costs (for 1 million data points it costs circa $150) and the simple fluorescent excitation, which can be important aspects for later clinical usage.
FIG 4.
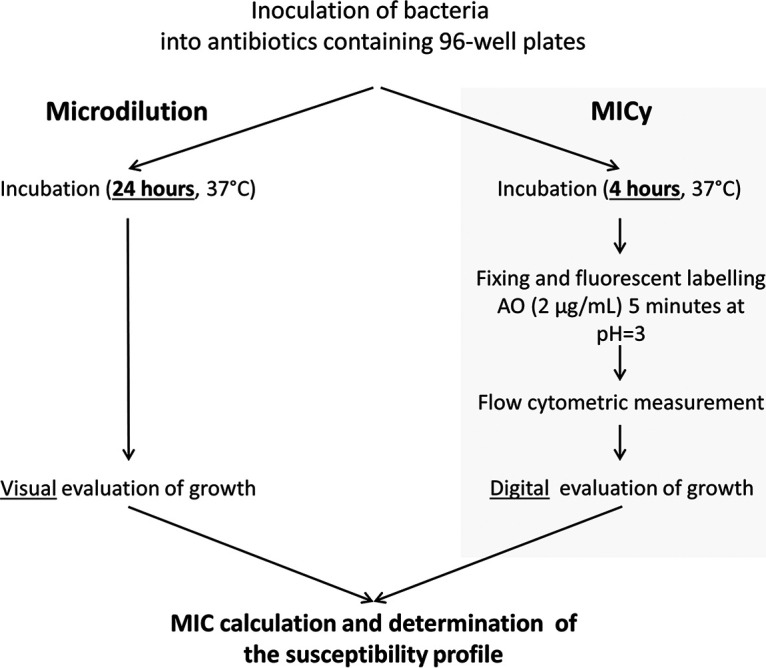
Experimental workflow of microdilution and MICy.
Speeding up the susceptibility testing is beneficial; however, inadequately short incubation time can result in misleading susceptibility profile and may lead to an inappropriate clinical decision. Earlier studies reported 90 min or even shorter testing time for FC based AST (22, 23, 26). In our hands, a minimum of 4 h incubation time was needed for reliable detection of bacterial growth (Fig. 1C and D). For good quality phenotypic AST, the incubation time should be long enough to allow logarithmic bacterial growth of slower multiplying species as well. Too short an incubation period can deteriorate the quality of results, and on the other hand, longer incubations reduce the time advantage of a test. The limitation of the present study is that all examined bacteria were ATCC isolates with relative fast duplication cycle, but isolates from clinical samples may grow slower, thus longer incubation time could be needed for clinical tests. The optimization of our approach, therefore, should be performed also with these strains. However, in the case of slower growing bacteria, the time advantage of MICy may be more explicit compared to methods based on turbidity changes.
We compared the reproducibility and reliability of MICy to the gold standard method. According to the SD of replicates, the reproducibility of MICy did not significantly differ from the microdilution (Fig. 2A). The overall point-by-point inter-observer agreement between MICy and the gold standard method was over 87%, and importantly, no discrepancy was observed in case of intrinsically resistant bacteria and antibiotics combinations (Table 1 and Table S1 and 2). Based on this, 80% of the calculated MIC pairs fit together within one dilution range in MH. Moreover, essential agreement ratio was above 88% by calculating the discrepancy resolution test according to the ISO/DIS 20776-2:2021 standard (Table 2), and the bias of MICy (17.2%) was in the range required by the standard (≤±30%). Finally, the discrepancy rates of the susceptibility profiles of the MICy were 8.7% for major discrepancies and 3.2% for very major discrepancies (Table 3). Although these results do not fully meet the criteria required by international standards (EA ≥ 90%, bias ≤±30%, major and very major discrepancy rates ≤3%), MICy’s achievement is a promising basis for further investigations to refine the methodology in order to fit in the criteria.
Beyond the time and quality performance, other aspects of antibiotic susceptibility testing were investigated. An ideal AST should be capable of high throughput and automatized processing and produce minimal amount of contaminated waste (10). FC is a robust technique and the technical improvement of the FCs ensured its leading position in high-throughput measurements. The simple data processing—MICy measures bacterial count and calculates the MIC values for 12 antibiotics in circa 60 min—makes it possible to automatize the test. Moreover, the defined phenotypic MIC values can be interpreted according to the clinical breakpoint standards of EUCAST. Thus, by fitting MICy to existing microbiological experience, there may be no need to generate new clinical standards. The costs of the consumables and the waste production of a single MICy test are comparable to the microdilution method; the extra materials used for the sample preparation before FC measurements were the followings: 0.5 ml HBSS/data points, HCl to adjust pH of HBSS to 3, 1 μg Acridine orange/data points (1 g AO costs circa $150), one FC tube/data point, and a few pipet tips for pipetting samples from plates into FC tubes. These costs could be reduced further with an FC that measures directly from a 96-well plate. The only significant extra need of MICy testing is the FC device and its regular maintenance. However, regarding the life span of a modern FC, instrumental costs are minimal per one MICy, especially when compared to the expected advantages of earlier adequate antimicrobial treatment.
In conclusion, we present a simple method for rapid susceptibility testing based on flow cytometry that may have great diagnostic potential. To reveal the real time advantage and the clinical applicability of MICy further testing is needed on clinical samples that can harbor a range of resistance mechanisms such as ESBL production.
MATERIALS AND METHODS
Hanks' Balanced Salt Solution (HBSS) was from GE Healthcare (South Logan, UT, USA). The Mueller-Hinton broth (MH) and the ingredients of Luria–Bertani broth (LB) were from Sigma-Aldrich (St. Louis, USA). Acridine orange (AO, N,N,N′,N′-Tetramethylacridine-3,6-diamine) was from Serva-Feinbiochemica (Heidelberg, Germany). Fixing solution was prepared from HBSS by adding AO to reach a final concentration of 2 μg/ml and HCL to adjust pH to 3. The 96-well polystyrene plates were from Tomtec (Budapest, Hungary). Antibiotics (vancomycin, ciprofloxacin, levofloxacin, ceftriaxone, cefepime, amoxicillin/clavulanate, piperacillin-tazobactam, trimethoprim-sulfamethoxazole, cefazolin, colistin, imipenem, gentamicin) and all other reagents were of research grade. Escherichia coli (ATCC:25922), Klebsiella pneumoniae (ATCC:700603), Pseudomonas aeruginosa (ATCC:27855), Enterococcus faecalis (ATCC:29212), Streptococcus pyogenes (HNCMB 80003) and Staphylococcus aureus (ATCC:29213) were used as test bacteria.
FC detection of bacteria.
FC measurements were carried out in a BD FACSCalibur (Franklin Lakes, USA). Since the size of most bacteria is between 500 and 1000 nm, a conventional FC is able to detect and count bacteria as single particles (20, 26, 30). However, the size of smaller bacteria is near to the detection limit (ca. 300 nm) of a conventional FC (31). Therefore, to improve the detection reliability, fluorescent labeling was used to count bacteria (Fig. S1). Fixing solution was used for setting the thresholds to eliminate instrumental noise detected by the side scatter (SSC) and the “green” fluorescence detector (530/30 nm) (Fig. S1A). The upper size limit of bacterial detection was set with 3.8 μm fluorescent beads (SPHERO Rainbow Alignment Particles from Spherotech, USA). The lower SSC threshold was set to exclude 90% of the instrumental noise. Bacteria were enumerated in the R1 gate. The optimal flow rate was defined with a 10-fold serial dilution scale of fluorescent bacteria to avoid swarm detection (27, 30)—it was held under 2000 events/s. FC data were analyzed with Flowing 2.5 Software (Turku Centre for Biotechnology, Finland). Fig. S1 shows representative dot plots of E. coli at the start (C) and the end (D) of a 4 h incubation in MH.
Determination of optimal incubation time for flow cytometric AST.
To determine the shortest incubation time to detect bacterial growth and to control the linearity of FC measurements, we inoculated 90 μl MH or LB medium with bacteria (10 μl from 10-fold diluted 0.5 McFarland standard) and monitored their growth in three independent experiments. Samples were taken every hour up to 6 h into 500 μl fixing solution. The final pH of the fixing solution with the added sample was pH 3. After fixing the samples for 5 min, they were measured by FC as described above.
Antibiotics layout for AST.
The layout of antibiotics was the same for both microdilution and MICy for all six tested bacteria irrespective of their natural resistance or sensitivity (Table S1). All antibiotics were applied in standard polystyrene plastic plates in seven different concentrations as described in Table S1. In each plate there were four parallel wells for positive control that contained broth without antibiotics inoculated at the beginning of incubation, and four wells for negative control that were not inoculated at all. To measure the initial bacterial count, four wells were inoculated after the incubation period immediately before the fixing with the same amount of bacteria (that were stored at 4°C in saline).
MIC determination.
Quantitative antibiotic susceptibility levels of bacteria were measured by determining MIC values according to the guidelines of EUCAST. The MIC originating from MICy was compared to the gold standard method. Microdilution data were analyzed after 24 h (due daily work schedule issues), a deviation from the standard 16–20 h period (Fig. 4). In case of MICy, bacteria were transferred into sterile 0.9% NaCl solution to reach solution turbidity equivalent to a 0.5 McFarland standard. Bacteria were further diluted 10-fold with saline. A 96-well plate with the described antibiotics layout (Table S1) were inoculated similar to the microdilution method. Wells contained 90 μl broth that were inoculated with 10 μl bacterial solution. The plates were sealed and incubated at 37°C under aerophilic conditions. At the end of the 4 h incubation, 90 μl of inoculated broth was added to 500 μl fixing solution. After 5 min fixing, samples were measured by FC.
Statistics.
Statistical analyses were performed with the on-line version of GraphPad Prism (https://www.graphpad.com/quickcalcs/ accessed on January 7, 2020, La Jolla, CA, USA). Fleiss’ Kappa was used to assess the agreement between microdilution and MICy. McNemar test was used to analyze the bias between microdilution and MICy. One-way RM ANOVA analysis was performed using GraphPad Prism 6 (La Jolla, CA, USA). Difference was taken significant if the P value was <0.05.
ACKNOWLEDGMENTS
We thank Professors Barna Vásárhelyi, Zoltán Prohászka, László Hunyady, Dóra Szabó, and Endre Ludwig and Viktória Szeifert for valuable discussions, and Regina Tóth-Kun, Jánosné Pesti, and Sándorné Vajda for excellent and devoted technical assistance. We thank Julianna Bozsó for supporting the work.
Experimental work was supported by research grant No. 119236 from NKFIH and 2.3.2.-16 from VEKOP to E.L. and by research grant No FK 137770 from NKFIH to Á.M.L. This paper was supported by the János Bolyai Research Scholarship of the Hungarian Academy of Sciences to Á.M.L., and by the ÚNKP-20-5 New National Excellence Program of the Ministry for Innovation and Technology from the source of the National Research, Development and Innovation Fund to Á.M.L.
Footnotes
Supplemental material is available online only.
Contributor Information
Ákos M. Lőrincz, Email: lorincz.akos@med.semmelweis-univ.hu.
Tomefa E. Asempa, Hartford Hospital
REFERENCES
- 1.Doern GV, Vautour R, Gaudet M, Levy B. 1994. Clinical impact of rapid in vitro susceptibility testing and bacterial identification. J Clin Microbiol 32:1757–1762. doi: 10.1128/jcm.32.7.1757-1762.1994. [DOI] [PMC free article] [PubMed] [Google Scholar]
- 2.Huang AM, Newton D, Kunapuli A, Gandhi TN, Washer LL, Isip J, Collins CD, Nagel JL. 2013. Impact of rapid organism identification via matrix-assisted laser desorption/ionization time-of-flight combined with antimicrobial stewardship team intervention in adult patients with bacteremia and candidemia. Clin Infect Dis 57:1237–1245. doi: 10.1093/cid/cit498. [DOI] [PubMed] [Google Scholar]
- 3.Wagner B, Filice GA, Drekonja D, Greer N, MacDonald R, Rutks I, Butler M, Wilt TJ. 2014. Antimicrobial stewardship programs in inpatient hospital settings: a systematic review. Infect Control Hosp Epidemiol 35:1209–1228. doi: 10.1086/678057. [DOI] [PubMed] [Google Scholar]
- 4.Barenfanger J, Drake C, Kacich G. 1999. Clinical and financial benefits of rapid bacterial identification and antimicrobial susceptibility testing. J Clin Microbiol 37:1415–1418. doi: 10.1128/JCM.37.5.1415-1418.1999. [DOI] [PMC free article] [PubMed] [Google Scholar]
- 5.Rhodes A, Evans LE, Alhazzani W, Levy MM, Antonelli M, Ferrer R, Kumar A, Sevransky JE, Sprung CL, Nunnally ME, Rochwerg B, Rubenfeld GD, Angus DC, Annane D, Beale RJ, Bellinghan GJ, Bernard GR, Chiche JD, Coopersmith C, De Backer DP, French CJ, Fujishima S, Gerlach H, Hidalgo JL, Hollenberg SM, Jones AE, Karnad DR, Kleinpell RM, Koh Y, Lisboa TC, Machado FR, Marini JJ, Marshall JC, Mazuski JE, McIntyre LA, McLean AS, Mehta S, Moreno RP, Myburgh J, Navalesi P, Nishida O, Osborn TM, Perner A, Plunkett CM, Ranieri M, Schorr CA, Seckel MA, Seymour CW, Shieh L, Shukri KA, et al. 2017. Surviving Sepsis campaign: International guidelines for management of sepsis and septic shock. Crit Care Med 45:486–552. doi: 10.1097/CCM.0000000000002255. [DOI] [PubMed] [Google Scholar]
- 6.Guo Y, Gao W, Yang H, Ma C, Sui S. 2016. De-escalation of empiric antibiotics in patients with severe sepsis or septic shock: A meta-analysis. Heart Lung 45:454–459. doi: 10.1016/j.hrtlng.2016.06.001. [DOI] [PubMed] [Google Scholar]
- 7.Maxson T, Mitchell DA. 2016. Targeted treatment for bacterial infections: prospects for pathogen-specific antibiotics coupled with rapid diagnostics. Tetrahedron 72:3609–3624. doi: 10.1016/j.tet.2015.09.069. [DOI] [PMC free article] [PubMed] [Google Scholar]
- 8.Weiss SL, Peters MJ, Alhazzani W, Agus MSD, Flori HR, Inwald DP, Nadel S, Schlapbach LJ, Tasker RC, Argent AC, Brierley J, Carcillo J, Carrol ED, Carroll CL, Cheifetz IM, Choong K, Cies JJ, Cruz AT, De Luca D, Deep A, Faust SN, De Oliveira CF, Hall MW, Ishimine P, Javouhey E, Joosten KFM, Joshi P, Karam O, Kneyber MCJ, Lemson J, MacLaren G, Mehta NM, Moller MH, Newth CJL, Nguyen TC, Nishisaki A, Nunnally ME, Parker MM, Paul RM, Randolph AG, Ranjit S, Romer LH, Scott HF, Tume LN, Verger JT, Williams EA, Wolf J, Wong HR, Zimmerman JJ, Kissoon N, et al. 2020. Surviving sepsis campaign international guidelines for the management of septic shock and sepsis-associated organ dysfunction in children. Intensive Care Med 46:10–67. doi: 10.1007/s00134-019-05878-6. [DOI] [PMC free article] [PubMed] [Google Scholar]
- 9.Maugeri G, Lychko I, Sobral R, Roque ACA. 2019. Identification and antibiotic-susceptibility profiling of infectious bacterial agents: a review of current and future trends. Biotechnol J 14:e1700750. doi: 10.1002/biot.201700750. [DOI] [PMC free article] [PubMed] [Google Scholar]
- 10.Anonymous. 2019. Antibiotic susceptibility diagnostics for the future. Nat Microbiol 4:1603. doi: 10.1038/s41564-019-0577-4. [DOI] [PubMed] [Google Scholar]
- 11.van Belkum A, Burnham CD, Rossen JWA, Mallard F, Rochas O, Dunne WM. Jr, 2020. Innovative and rapid antimicrobial susceptibility testing systems. Nat Rev Microbiol 18:299–311. doi: 10.1038/s41579-020-0327-x. [DOI] [PubMed] [Google Scholar]
- 12.Syal K, Mo M, Yu H, Iriya R, Jing W, Guodong S, Wang S, Grys TE, Haydel SE, Tao N. 2017. Current and emerging techniques for antibiotic susceptibility tests. Theranostics 7:1795–1805. doi: 10.7150/thno.19217. [DOI] [PMC free article] [PubMed] [Google Scholar]
- 13.Piddock LJ. 2012. The crisis of no new antibiotics—what is the way forward? Lancet Infect Dis 12:249–253. doi: 10.1016/S1473-3099(11)70316-4. [DOI] [PubMed] [Google Scholar]
- 14.Steen HB, Boye E. 1981. Escherichia coli growth studied by dual-parameter flow cytophotometry. J Bacteriol 145:1091–1094. doi: 10.1128/jb.145.2.1091-1094.1981. [DOI] [PMC free article] [PubMed] [Google Scholar]
- 15.Bronk BV, Van de Merwe WP, Stanley M. 1992. In vivo measure of average bacterial cell size from a polarized light scattering function. Cytometry 13:155–162. doi: 10.1002/cyto.990130208. [DOI] [PubMed] [Google Scholar]
- 16.Gauthier C, St-Pierre Y, Villemur R. 2002. Rapid antimicrobial susceptibility testing of urinary tract isolates and samples by flow cytometry. J Med Microbiol 51:192–200. doi: 10.1099/0022-1317-51-3-192. [DOI] [PubMed] [Google Scholar]
- 17.Walberg M, Gaustad P, Steen HB. 1997. Rapid assessment of ceftazidime, ciprofloxacin, and gentamicin susceptibility in exponentially-growing E. coli cells by means of flow cytometry. Cytometry 27:169–178. doi:. [DOI] [PubMed] [Google Scholar]
- 18.Martinez OV, Gratzner HG, Malinin TI, Ingram M. 1982. The effect of some beta-lactam antibiotics on Escherichia coli studied by flow cytometry. Cytometry 3:129–133. doi: 10.1002/cyto.990030211. [DOI] [PubMed] [Google Scholar]
- 19.Suller MT, Stark JM, Lloyd D. 1997. A flow cytometric study of antibiotic-induced damage and evaluation as a rapid antibiotic susceptibility test for methicillin-resistant Staphylococcus aureus. J Antimicrob Chemother 40:77–83. doi: 10.1093/jac/40.1.77. [DOI] [PubMed] [Google Scholar]
- 20.Novo DJ, Perlmutter NG, Hunt RH, Shapiro HM. 2000. Multiparameter flow cytometric analysis of antibiotic effects on membrane potential, membrane permeability, and bacterial counts of Staphylococcus aureus and Micrococcus luteus. Antimicrob Agents Chemother 44:827–834. doi: 10.1128/AAC.44.4.827-834.2000. [DOI] [PMC free article] [PubMed] [Google Scholar]
- 21.Durodie J, Coleman K, Simpson IN, Loughborough SH, Winstanley DW. 1995. Rapid detection of antimicrobial activity using flow cytometry. Cytometry 21:374–377. doi: 10.1002/cyto.990210409. [DOI] [PubMed] [Google Scholar]
- 22.Fonseca ESD, Andrade FF, Gomes R, Silva-Dias A, Martins-Oliveira I, Perez-Viso B, Ramos MH, Rodrigues AG, Canton R, Pina-Vaz C. 2020. Ultra-rapid flow cytometry assay for colistin MIC determination in Enterobacterales, Seudomonas aeruginosa, and Acinetobacter baumannii. Clin Microbiol Infect 26:1559.e1–1559.e4. doi: 10.1016/j.cmi.2020.08.019. [DOI] [PubMed] [Google Scholar]
- 23.Alvarez-Barrientos A, Arroyo J, Canton R, Nombela C, Sanchez-Perez M. 2000. Applications of flow cytometry to clinical microbiology. Clin Microbiol Rev 13:167–195. doi: 10.1128/CMR.13.2.167. [DOI] [PMC free article] [PubMed] [Google Scholar]
- 24.van Belkum A, Dunne WM. Jr, 2013. Next-generation antimicrobial susceptibility testing. J Clin Microbiol 51:2018–2024. doi: 10.1128/JCM.00313-13. [DOI] [PMC free article] [PubMed] [Google Scholar]
- 25.Cohen CY, Sahar E. 1989. Rapid flow cytometric bacterial detection and determination of susceptibility to amikacin in body fluids and exudates. J Clin Microbiol 27:1250–1256. doi: 10.1128/jcm.27.6.1250-1256.1989. [DOI] [PMC free article] [PubMed] [Google Scholar]
- 26.Broeren MA, Maas Y, Retera E, Arents NL. 2013. Antimicrobial susceptibility testing in 90 min by bacterial cell count monitoring. Clin Microbiol Infect 19:286–291. doi: 10.1111/j.1469-0691.2012.03800.x. [DOI] [PMC free article] [PubMed] [Google Scholar]
- 27.Lőrincz ÁM, Szeifert V, Bartos B, Ligeti E. 2018. New flow cytometry-based method for the assessment of the antibacterial effect of immune cells and subcellular particles. J Leukoc Biol 103:955–963. doi: 10.1002/JLB.4TA0817-317R. [DOI] [PubMed] [Google Scholar]
- 28.Landis JR, Koch GG. 1977. An application of hierarchical kappa-type statistics in the assessment of majority agreement among multiple observers. Biometrics 33:363–374. doi: 10.2307/2529786. [DOI] [PubMed] [Google Scholar]
- 29.Kepner RL, Jr, Pratt JR. 1994. Use of fluorochromes for direct enumeration of total bacteria in environmental samples: past and present. Microbiol Rev 58:603–615. doi: 10.1128/mr.58.4.603-615.1994. [DOI] [PMC free article] [PubMed] [Google Scholar]
- 30.Lőrincz ÁM, Timár CI, Marosvári KA, Veres DS, Otrokocsi L, Kittel Á, Ligeti E. 2014. Effect of storage on physical and functional properties of extracellular vesicles derived from neutrophilic granulocytes. J Extracell Vesicles 3:25465. doi: 10.3402/jev.v3.25465. [DOI] [PMC free article] [PubMed] [Google Scholar]
- 31.van der Pol E, van Gemert MJ, Sturk A, Nieuwland R, van Leeuwen TG. 2012. Single vs. swarm detection of microparticles and exosomes by flow cytometry. J Thromb Haemost 10:919–930. doi: 10.1111/j.1538-7836.2012.04683.x. [DOI] [PubMed] [Google Scholar]
Associated Data
This section collects any data citations, data availability statements, or supplementary materials included in this article.
Supplementary Materials
Supplemental material. Download SPECTRUM00901-21_Supp_2_seq1.xlsx, XLSX file, 0.01 MB (15.7KB, xlsx)
Supplemental material. Download SPECTRUM00901-21_Supp_3_seq2.xlsx, XLSX file, 0.1 MB (89.3KB, xlsx)
Supplemental material. Download SPECTRUM00901-21_Supp_1_seq8.pdf, PDF file, 0.7 MB (760.6KB, pdf)