

Abstract
A promising application of paper microfluidics is the translation of gold-standard multi-step laboratory tests to a disposable paper-based format for decentralized diagnostic or therapeutic testing. This often entails conversion of bench-top processing of macro-volume samples to the processing of micro-volume samples within a porous matrix, and requires detailed characterization of fluid and reagent interactions within the porous material(s) of the device. The current study focuses on rational device design through the characterization of fluid and reagent interactions in polysulfone and glass fiber substrates for multi-step sample processing. Specifically, we demonstrate how the characterization of fluidic compatibility between substrates, chemical compatibility between reagents and substrates, sample pH, and sample transport can be used to inform device design in the context of a two-reaction detection scheme for phenylalanine in porous materials. Finally, we demonstrate detection of phenylalanine from human whole blood, and discuss the multiple strengths of the current design over a previous version.
Introduction
Paper microfluidics is a rapidly growing subfield of microfluidics in which porous materials are used to create analytical devices. Advantages of the use of porous materials include a generally lower cost compared to conventional microfluidic materials, and capillary flow, enabling fluid transport without the need for pumping equipment. In addition, paper microfluidics builds upon the established technology of the conventional lateral flow test format used to detect a wide variety of analytes including infectious agents and chemical contaminants. An active area of paper microfluidics device development is the translation of gold-standard laboratory-based tests to a disposable paper-based format for decentralized diagnostic or therapeutic testing. This translation requires (i) the reduction of macro-volumes of sample and reagents to micro-volumes, and (ii) the mapping of multiple benchtop manipulations requiring external fluid handling to capillary-based transport in a porous matrix. There have been some demonstrations of this, including multi-step signal amplified immunoassays for malaria detection1–3 and influenza detection,4 as well as nucleic acid amplification assays.5 Although certainly advancing applications in paper microfluidics, these studies have mostly focused on presenting final device design and performance specifications, with little discussion of the rationale for critical design choices.
The rational development of paper microfluidic devices requires understanding fluid and reagent interactions within the porous material(s) of interest. The paper microfluidics literature includes multiple contributions that have improved our understanding of fluid transport in porous channels under various system constraints.6–9 Further, there have been several systematic investigations of analyte transport in porous substrates that demonstrate the complexity of analyte-substrate interactions at work. For example, Lahr et. al.10 used Raman spectral imaging to characterize the transport of various protein-metal nanoparticle conjugates through cellulose, noting the substantial effect of protein surface charge. Complementary to this, Evans et al.11 demonstrated that colorimetric reagents disperse differently in their systematic evaluation of different cellulose substrates. Fridley et al.12 investigated reagent rehydration in a nitrocellulose porous matrix, a critical element of field-use devices. Also relevant, Ota et. al.13 used colorimetric readout to quantify the transport efficiency of several model analytes, representative of protein and small molecules, in cellulose, and demonstrated that channel geometry and analyte charge can have a strong impact on device sensitivity. Most relevant to the current work, Nguyen et al.14 considered the rational design of a cellulose-based lateral flow device for heavy metal detection, focusing on reducing sample retention in the device through the investigation of design parameters such as channel dimensions and washing protocol. In the current study, we build on the literature supporting rational development of paper microfluidic devices by systematically characterizing our multi-step detection process, using the results to inform our device design, and assessing our device performance relative to a previous implementation.
The context of our work is a paper-based test for phenylalanine that could be used by patients with the genetic disorder phenylketonuria (PKU). PKU patients cannot metabolize the amino acid phenylalanine and uncontrolled phenylalanine levels in the body can lead to lasting neurological damage.15 Current personal phenylalanine monitoring is infrequent, and commonly consists of either venipuncture blood samples taken in the clinic or blood spots dried onto filter paper in the home and sent to a laboratory for analysis of phenylalanine concentration.16 Common laboratory methods of phenylalanine detection include fluorometry,17 high-performance liquid chromatography,18,19 and tandem mass spectrometry.20,21
However, laboratory-based testing does not provide the rapid feedback that would be most useful for optimizing patient therapy. Frequent, rapid feedback of blood phenylalanine levels could empower PKU patients, enabling them to achieve a personalized therapy regimen, including diet, nutritional supplements, and medication, that is optimal for each individual at each stage of development during their lifetime. Specific potential advantages to regular phenylalanine monitoring include improved therapy compliance from timely positive/negative feedback on patient actions and an increased flexibility in dietary options.22 PKU patients have self-reported an increased adherence to nutritional therapy before a scheduled test, lending direct support for the former.23 The utility of a phenylalanine test for use by PKU patients in the field is clear22,24–26 with PKU patients broadly indicating an interest in being empowered to perform blood phenylalanine monitoring with increased frequency.23
There have been multiple reports on the development of phenylalanine detection methods. A common theme has been to couple the phenylalanine-based reaction catalyzed by the enzyme phenylalanine dehydrogenase, to various detection schemes including fluorescence detection27 and electrochemical detection.28 However, the majority of reported methods characterization has been earlier stage, and thus completed in ideal buffers rather than in real human samples. A recent noteworthy report with the potential for translation, described phenylalanine detection from whole blood using a fluorescent engineered protein.29 However, their device required multiple user pre-processing steps that substantially reduced overall ease of use, and would not be appropriate in lower-resource, point-of-care settings. Our group previously reported the development of a whole blood paper-based phenylalanine measurement device.30 Though promising, we identified areas of needed improvement that would require rational reevaluation of many of the original design parameters.
In this study, we present systematic characterization of our paper microfluidic phenylalanine detection platform that includes (i) fluidic and chemical compatibility testing, (ii) investigation of reagent affinity for porous substrates, and (iii) characterizing the critical reaction condition of pH on device. In each case, we describe how we used the results to direct device design choices, including substrate type, spatial localization of reagents, and the pH of reaction zones. Although our methods for characterization were demonstrated in the context of the development of our second-generation, paper-based test for phenylalanine detection, the methods are generalizable to other systems. Our system presented a noteworthy optimization challenge due to the requirement for two reaction zones with disparate optimal pHs and reagent storage incompatibilities. Finally, we describe substantial improvements in our current device compared to the previous prototype30 including a two-fold reduction in sample volume, from 40 μL to 20 μL, (to be consistent with the use of a minimally-invasive lancet), a two-fold reduction in time to result to four minutes, and improvements in phenylalanine quantitative resolution and reproducibility.
Materials and Methods
Note: Experiments adhered to Oregon State University’s ethical guidelines based on the Belmont Report. Procedures involving human subjects were approved by Oregon State University’s Institutional Review Board (IRB).
Detection scheme
The context for our study was the detection of phenylalanine in blood via the following two reactionsa.
| (1) |
| (2) |
In this section, we describe materials and methods used to define the three modules of our device; (i) whole blood to plasma processing, (ii) “enzymatic reaction” generation of NADH (reduced form of nicotinamide adenine dinucleotide) from input Phe (phenylalanine), NAD+ (oxidized form of nicotinamide adenine dinucleotide), and phenylalanine dehydrogenase (PheDH), and (iii) “colorimetric reaction” generation of signal from NADH, NBT (nitro blue tetrazolium), and mPMS (1-methoxy-5-methylphenazinium methylsulfate). Reactions in wells were monitored using absorbance (340 nm for NADH produced in the enzymatic reaction and 550 nm for the colorimetric product) and intensity (from image data) as described in more detail in the subsections below.
Substrates of interest
The main materials evaluated for use in the device are summarized in Table 1.
Table 1.
Materials Investigated and Used.
| Component and Function | Composition | Materials Name |
|---|---|---|
| Membrane for plasma separation from whole blood | Polysulfone | Vivid GR-plasma separation membrane |
| Vivid GX-plasma separation membrane | ||
| Porous pads to house the enzymatic and colorimetric reactions | Glass fiber | A/C glass fiber |
| A/E glass fiber | ||
| Nonporous support and protective layers for the porous pads and the reagents within | Polyester with adhesive | 254 μm thick polyester |
| 127 μm thick polyester |
Highlighted materials were used in the final card design.
Measuring substrate capacity (μL/cm2):
A/E or A/C glass fiber (Pall Corporation, Port Washington, NY, USA) was cut into a 1 cm × 1 cm square pad using a CO2 laser system (Universal, VLS 3.5, Scottsdale, AZ, USA). Membrane mass was measured (AT261 DeltaRange, Mettler Toledo, Columbus, OH, USA) before being placed on a saturated glass fiber pad connected to a source of deionized water (DIW), and allowed to fill for 15 seconds (N = 5). The membrane mass was then measured again. The volume of water within the substrate was determined by calculating the difference in mass before and after fluid addition and dividing by the density of water (1 mg/μL). The fluid capacity of the substrate was reported as the fluid volume that can be taken up by the substrate per l cm2 lateral area of the substrate.
Plasma transfer from plasma separation membrane (PSM) to downstream glass fiber pads:
An A/C glass fiber pad (fluid capacity 7 μL), representing the enzymatic pad (see Figure 1), was adhered to a polyester backing and the mass of the assembly was measured. Next, either the GR- or the GX-PSM (Vivid™, Pall Corporation, Port Washington, NY, USA, sized to process 20 μL of whole blood) was adhered to the polyester backing such that it overlapped the glass fiber pad by 0.15 cm. Pooled human whole blood (20 μL), obtained using an IRB-approved study protocol, was then pipetted onto the PSM. After a specified time, between 15 seconds to 3 minutes, the PSM was removed with tweezers, and the mass of the assembly was measured again. The difference in mass, corresponding to the plasma mass transferred from the PSM to the glass fiber pad was divided by the density of plasma (1.02 mg/μL31) in order to estimate the volume of plasma transferred from the PSM to the glass fiber pad.
Figure 1. Schematic of the phenylalanine detection device.

The device has three functional modules: (i) blood to plasma separation, (ii) enzymatic reaction, and (iii) colorimetric reaction. The system constraints included different preferred pH in the modules, as well as incompatibilities in reagent storage requirements. The label in bold near each substrate indicates the reagent(s) that are stored in the substrate. Specifically, the enzymatic reaction required a pH near 9 to achieve the desired signal to noise ratio, while the colorimetric reaction required a pH of lower than 8 to minimize nonspecific signal from the colorimetric reagents. In addition, significant conversion of the cofactor NAD+ to NADH at alkaline pH required storage of the NAD+ off the enzymatic pad and in the PSM.
The volume of plasma transferred from the PSM through the first glass fiber pad, representing the enzymatic pad, and into a second, smaller capacity, glass fiber pad, representing the colorimetric pad, was determined using similar methods. The weighed assembly only included the smaller A/C glass fiber pad (fluid capacity 3.1 μL or 4.2 μL) adhered to polyester backing. Pooled human whole blood (20 μL) was added to the GR-PSM and then allowed to transfer to the first glass fiber pad for two minutes. Then the smaller pad assembly was aligned with the first pad assembly and pressed together. After an additional two minutes, the smaller pad assembly was removed, weighed, and the volume of plasma that flowed into the smaller pad was estimated as described above.
Chemical compatibility of porous substrates with enzymatic and colorimetric reactions:
Potential poisoning of the enzymatic reaction due to substrates was investigated. The substrate material, either A/C glass fiber or GR-PSM, was filled with DIW to the pad’s fluid capacity, and centrifuged for 5 minutes at 11,800 g (Galaxy 16D, VWR, Radnor, PA, USA) to remove the fluid and any transferable species from the material. This fluid was added to a well, along with PheDH (Creative Enzymes, Shirley, NT, USA), Phe (Sigma Aldrich, St. Louis, MO, USA), and NAD+ (Sigma Aldrich, St. Louis, MO, USA) at final concentrations of 0.5 U/mL, 40 mg/dL, and 10 mM, respectively in Bis-Tris Propane buffer (BTP, Sigma Aldrich, St. Louis, MO, USA) (220 mM pH 9.3). The fluid spun out from the pads constituted 50% of the total fluid volume in the well. The 340 nm absorbance signal at 10 minutes was recorded in a plate reader (Synergy-2, BioTek, Winooski, WA, USA), and compared to the absorbance signal of the positive control reaction using DIW that had not encountered the porous material.
A similar procedure was used to test for potential poisoning of the colorimetric reaction. The spun-out fluid again constituted 50% of the total fluid volume. The reactants were mPMS (Dojindo Molecular Technologies, Kumamoto, Japan), NBT (Sigma Aldrich, St. Louis, MO, USA) and NADH (Sigma Aldrich, St. Louis, MO, USA) at final concentrations of 1.2 mM, 100 μM, and 200 μM, respectively in BTP (220 mM, pH 6.3). The 550 nm absorbance was recorded after 2 minutes and compared to the absorbance signal of the positive control reaction using fluid that had not encountered the porous material.
NAD+ retention in PSM:
The retention of NAD+ that had been dried and then subsequently rehdryated within GR-PSM was investigated. A GR-PSM pad (sized to process 80 μL of whole blood) was hand-spotted with NAD+ in DIW (16 μL, 50 mM), and dried in a desiccator for 2 hours. Next, DIW (48 μL) was added to the GR-PSM pad to rehydrate the dried NAD+, and the fluid was spun out as described above. The spun-out fluid was added to a well with Phe (40 mg/dL) and PheDH (0.5 U/mL), and after 10 minutes the signal at 340 nm was compared to our NAD+ calibration curve (0.25 mM – 5 mM) in order to estimate the NAD+ concentration from the spun-out fluid.
Reagent affinity to glass fiber under flow:
The level of association of PheDH to glass fiber was evaluated, and compared to positive controls of the high level of association of an antibody (mouse polyclonal Anti-HRP, ThermoFisher, Grand Island, NY, USA) to A/C glass fiber and to nitrocellulose (HiFlow Plus, EMD Millipore, Darmstadt, Germany). PheDH and the antibody were diluted (both 0.4 mg/mL) in 0.1 M phosphate-buffered saline (PBS) pH 7.4 (Sigma Aldrich St. Louis, MO, USA). A strip of the substrate (fluid capacity 70 μL) was placed on a polyester backing, spotted with protein sample (1 μL) using an automated reagent dispensing system (AD3320, BioDot, Irvine, CA, USA), and dried in a desiccator for an hour. The strip was dipped into a well with two times the volume of the strip capacity, allowed to fill, and dried in a desiccator for 3 hours. The dried strip was stained for protein using the Pierce Reversible Stain Kit (#24580, Thermo Fisher Scientific, Waltham, MA), and the scanned image (Epson V700) was compared to image data from strips that did not have lateral fluid flow through the glass fiber.
The affinity of colorimetric reagents to glass fiber under lateral flow was evaluated using a similar protocol. The colorimetric reaction reagents, mPMS (200 μM) and NBT (2.4 mM), were spotted separately onto an A/C glass fiber strip (fluid capacity 62 μL) at different spacings (0.35 cm, 1.4 cm, or 2.45 cm) along the direction of flow. The strip (N = 3) was dried in the desiccator for 1 hour and then dipped into a well containing NADH in DIW (186 μL, 200 μM). Each strip was scanned after 6 minutes of fluid flow through. The intensity of colorimetric output at the spotted downstream reagent was used as an indicator of the mobility of the spotted upstream reagent under flow.
Movement of colorimetric reagents in glass fiber during vertical flow was evaluated by spotting and drying 1 μL of an NBT and mPMS mixture (1.2 mM and 100 μM respectively in 220 mM BTP pH 6.3) on a 1 cm2 square A/C glass fiber pad (N = 4). A second square A/C pad, filled with 200 μM NADH in DIW, was then folded over onto the first pad to facilitate the vertical transfer of fluid. An image of the resulting colorimetric signal was acquired using a scanner 2 minutes after folding, and the diameter of the colorimetric signal was compared in Fiji32 to the diameter of a 1 μL dried spot of dye, an indicator for the extent of fluid spread in the substrate.
Effect of pH on enzymatic and colorimetric reagents:
The effect of BTP buffer pH (220 mM, pH 6.2–9.4) on the enzymatic reaction was assessed by measuring the absorbance signal of NADH at 340 nm after 10 minutes in a well format (N = 3) and using concentrations as noted previously. Further, the effect of pH on the reaction was assessed via colorimetric product formation in glass fiber (N = 3) by drying down PheDH (10 U/mL, 7 μL) in A/C pads with different pH buffer backgrounds (220 mM BTP at pH: 7.5, 8.3, 9.1, 9.3). A mixture (3 μL) containing NBT (1.2 mM) and mPMS (100 μM) in BTP buffer (440 mM, pH 6.3) was added to the colorimetric pad. Both pads were adhered to mylar, protected from light and dried in a vacuum dryer for 1 hour. Then a mixture of NAD+ and Phe was added to the enzymatic pad (10 mM NAD+ and 4 mg/dL Phe in 50 mM BTP, 7 μL) and allowed to incubate for 2 minutes. The colorimetric pad was folded over to make contact with the enzymatic pad and scanned after 2 minutes.
The effect of solution pH on NAD+ autoconversion to NADH was investigated by measuring the absorbance signal of NADH at 340 nm. NAD+ (30 mM) was added to DI water (~pH 5), BTP (220 mM, pH 6.3, 9.5) and PBS (4 mM, pH 7.4) in a well. The absorbance was measured each minute for a period of 1 hour (N = 3). Further, the magnitude of colorimetric response due to this autoconversion was investigated in glass fiber at times of 2 and 10 minutes in a multi-pad card and using whole blood as the input. NAD+ (50 mM in DI water, 4 μL) was dried on a GR-PSM pad for 2 hours in the desiccator and then placed on a card composed of an enzymatic pad (BTP 440 mM, pH 9.3) devoid of enzyme, a colorimetric pad dried down with colorimetric reagents (NBT 1.2 mM and mPMS 100 μM, 440 mM BTP pH 6.3, 3μL), and polyester backing as appropriate. A multichannel pipette was used to enable running four different samples simultaneously. After 2 or 10 minutes, the colorimetric pad was folded over onto the enzymatic pad to enable fluid transfer. After an additional 2 minutes, an image of the colorimetric response was acquired with a scanner.
The effect of BTP buffer pH (220 mM, pH 6.2–9.4) on the colorimetric reagents, mPMS (100 μM) and NBT (1.2 mM), was assessed by measuring the absorbance signal of the tetrazolium product at 550 nm as a function of time at 0, 2, 15, 30, and 60 minutes.
Characterization of plasma sample pH at different stages in the device:
Pooled human whole blood was centrifuged at 3,000 g for 12 minutes, and plasma was pipetted from the top of the centrifuged sample and stored at 4 °C until use. GR-PSM pad (fluid capacity of 50 μL, N = 5) was filled with plasma, the fluid spun out using a centrifuge, and the pH of the fluid was measured with a small volume pH probe (MI-410, Microelectrodes Inc, Bedford, NH, USA). Spun-out fluid was added to an A/C glass fiber pad (fluid capacity of 44 μL, N = 5) and that contained dried BTP buffer (220 mM or 440 mM, pH 9.3). Fluid was spun out and the pH of a portion of the fluid measured. Fluid was then transferred to a glass fiber pad (fluid capacity of 20 μL), and that contained dried BTP buffer (110 mM or 440 mM, pH 6.3). Fluid was spun out and the pH of a portion of the fluid measured. Additionally, the pH of plasma spun out from a virgin A/C glass fiber pad was measured.
Assay response using Phe-spiked blood samples:
The card design is shown schematically in Figure 1. Assay card components were cut using a CO2 laser. The A/C glass fiber enzymatic pad (fluid capacity 7 μL), containing dried BTP buffer (440 mM, pH 9.3), and a virgin A/C glass fiber colorimetric pad (fluid capacity 3 μL) were attached to a polyester/adhesive backing. PheDH (60 U/mL, 1 μL) was hand-spotted at the top center of the enzymatic pad. A mixture (3μL) containing NBT (1.2 mM) and mPMS (100 μM) in BTP buffer (440 mM, pH 6.3) was added to the colorimetric pad. These components were protected from light and dried in a vacuum dryer for 45 minutes. NAD+ in DIW (50 mM, 4 μL) was added to the GR-PSM (sized to process 20 μL of whole blood) and the PSM dried in the desiccator for 2 hours. The GR-PSM was attached to the polyester/adhesive backing such that it overlapped with the enzymatic pad by 0.15 cm. Additional polyester/adhesive was used to enclose the assembly.
The assay response was characterized using a multi-device card that contained six individual devices per card. Pooled human whole blood (20 μL), either unspiked or spiked with 2, 4, 6, or 12 mg/dL of Phe, was added to each GR-PSM via a small opening in the polyester layer on the card. A multichannel pipette was used to enable running six different samples simultaneously. After 2 minutes, the colorimetric pad was folded over onto the enzymatic pad to enable fluid transfer from the latter to the former. After an additional 2 minutes, an image of the colorimetric response was acquired with a scanner. For each Phe concentration, five replicates were performed.
Images were analyzed with a custom-coded MATLAB (Mathworks, Natick, MA) script. Iraw signal, was the average raw greyscale intensity value in a rectangular region of interest (1.4 mm × 0.7 mm) located 0.5 mm from the top center of the colorimetric pad. Ibackground was the average greyscale intensity in an analogous region of interest from a negative control card without any enzyme. The assay normalized signal was defined as . Average quantitative resolution within the approximately linear range was estimated as . Each of the Phe-spiked whole blood samples was independently evaluated for plasma Phe concentration using liquid chromatography-mass spectrometry (LC-MS) conducted by the Linus Pauling Institute Analytical Services Core Laboratory. Briefly, a portion of each of the Phe-spiked whole blood sample was centrifuged for 5 minutes at 2000 g, and the plasma extracted and stored at −80 °C until processing with LC-MS.
Results and Discussion
Our overall device design consisted of three functional modules, (i) whole blood to plasma processing, (ii) enzymatic reaction (see Reaction (1)), and (iii) colorimetric reaction (see Reaction (2)). Although there have been multiple demonstrations of paper microfluidic devices that use a single material and colocalized reactants/reactions, constraints of our phenylalanine detection scheme dictated spatial separation of certain reagents during storage, and different preferred pH conditions for the two reactions. The schematic in Figure 1 highlights the spatial separation of the reagents, as well as the constraints. In this section, we describe three sets of characterization experiments: (i) fluidic and chemical compatibility for substrate selection, (ii) affinity of reagent for the substrate to inform localization of reagents, and (iii) pH manipulation within the device to achieve robust signal-to-noise ratio. We discuss each of these in the context of our phenylalanine detection device, but the methods are generalizable to other systems.
Substrate fluid capacity and fluidic compatibility
In order to obtain consistent colorimetric signal, processing whole blood to remove red blood cells while extracting plasma (with minimal hemolysis) for further downstream manipulation was a high priority requirement. We chose to focus on commercially-available polysulfone membranes with a graded pore structure, trapping blood cells within the membrane, while allowing plasma to flow through. For health conditions like PKU, in which patients would benefit from frequent testing, the use of a high-volume lancet for blood collection would be invasive and likely painful. Thus, we also had the goal of designing our device to work with an input blood volume that is compatible with a finger stick from less invasive lancets, so chose a target sample volume of 20 μL. Material fluid capacity was an important characteristic that influenced our final choice of glass fiber substrate for a reduced sample volume device (a two-fold reduction from the original 40 μL). Specifically, we were motivated to use A/C glass fiber (a thinner version of the A/E glass fiber used in the original prototype30) as the downstream substrate for our reactions, because it had a smaller fluid capacity relative to A/E. The fluid capacity of the A/C glass fiber, 28 ± 1 μL/cm2, was significantly smaller than the fluid capacity of the previously used A/E glass fiber, 39 ± 2 μL/cm2 (see Tables S1A and S1B for mass data). This enabled a reduction in required sample volume without a substantial reduction in pad lateral area. The latter was important for ease of handling and assembly of device components.
Characterizing fluidic transfer within the device was critical to improving our understanding of several aspects of device operation. We evaluated GR- and GX-PSMsb for plasma volume transferred to downstream A/C glass fiber in a given time interval. The data in Figure 2A indicate better performance by the GR-PSM with (i) reasonably rapid transfer (maximum plasma volume transferred by 1 minute and with approximately 70% transferred by 15 seconds), and (ii) the transfer of approximately 20% more plasma, into the downstream A/C glass fiber than with the GX-PSM. (See Tables S2A and S2B for mass data.) Note that the faster filling of the GR-PSM relative to the GX-PSM at 15 seconds was likely due to the larger blood volume capacity of the former (45 uL/cm2 versus 25 μL/cm2), and thus a correspondingly smaller lateral footprint for the blood/plasma within the membrane to have to traverse. Based on these results, we chose to use the GR-PSM in our device. Note that if one made the naive assumption that the enzymatic pad was filled to capacity based on the observation that the pad appeared fully wetted, the volume transferred would have been an overestimate. We observed a plateau in the volume of plasma transferred, 80% at 3 minutes.
Figure 2: Fluid transfer in porous materials of the device.

(A) The plot shows the average volume of plasma transferred from the plasma separation membrane (PSM) to the enzymatic glass fiber pad for two different types of PSMs at multiple time points after the addition of whole blood to the PSM. Each bar shows an average of three replicate measurements and each error bar displays the 95% confidence interval. The GR-PSM (solid) enabled a greater volume of plasma into the glass fiber pad compared to the GX-PSM (cross hatched), plateauing at 80% and 60% of the fluid capacity of the enzymatic pad after one minute, respectively. The fluid capacity of the enzymatic glass fiber pad is indicated by a dashed line. (B) The plot shows the average volume of plasma vertically transferred from the GR-PSM and enzymatic glass fiber pad to the colorimetric glass fiber pad after 2 minutes for two different colorimetric pad sizes. The volume transferred to the colorimetric pad was slightly greater for the larger downstream pad compared to the smaller downstream pad. Each solid bar is an average of three replicate measurements (using the same blood sample) and the associated error bar displays the 95% confidence interval. The fluid capacity of the colorimetric glass fiber pad is indicated by a dashed line.
In order to achieve robust colorimetric signal, it was critical that a consistent plasma volume transferred from the enzymatic pad to the overlapping colorimetric pad (also A/C glass fiber). We evaluated the plasma volume vertically transferred through the device into two different colorimetric pad sizes, both smaller than the enzymatic pad. The data in Figure 2B indicate that after two minutes (chosen time for the colorimetric reaction), the plasma volume transferred was close to 50% of the colorimetric pad fluid capacity for both cases. (See Tables S3A and S3B for mass data.) For our goal of consistent signal development in a modest lateral region of interest on the pad, the smaller volume transferred was sufficient, and thus, the smaller colorimetric pad size was chosen.
Substrate chemical compatibility with reactions
Another important piece of characterization work was determining chemical compatibility between the porous substrates and our chemical reactions for phenylalanine detection. Although evaluating the chemical compatibility of materials with reagents is not often described, it is a useful process in rational device design, and critical when exploring materials that have not been extensively used (i.e., unlike Whatman cellulose). Since the pores within the material served as microwells for the reactions, it was important to determine whether the material had an unintended effect on the reaction of interest, such as introducing additives (e.g., from the material manufacturing process) which inhibit the specific reaction or create unintended nonspecific signal. The data of Figure 3A indicate that the rinse fluid from the A/C glass fiber did not inhibit the enzymatic reaction, with a signal comparable to that of the positive control (using fluid that was not exposed to A/C glass fiber). However, the reaction fluid from the GR-PSM produced a modest signal reduction of less than 10% compared to the positive control. This inhibitory effect may have been due to a lowering of the fluid pH to pH 8.9 upon exposure to the GR-PSM (compared to a pH of approximately 9.2 for the solution exposed to A/C only), which then resulted in lower activity PheDH. The data of Figure 3B indicate that the colorimetric reaction was also not affected by the rinse fluid from the A/C glass fiber, and modestly inhibited by the rinse fluid from the GR-PSM, in this case by approximately 20%. Further, the level of non-specific background signal was similar to the negative control of colorimetric reagents mPMS and NBT only (run with fluid that was not exposed to the material). We deemed the level of signal reduction acceptable for our purposes, but emphasize that for another application this level may have been considered unacceptable. Knowledge of the extent of signal inhibition enables one to make rational design decisions based on relevant application requirements and constraints.
Figure 3: Chemical compatibility of porous materials with the enzymatic and colorimetric reactions.
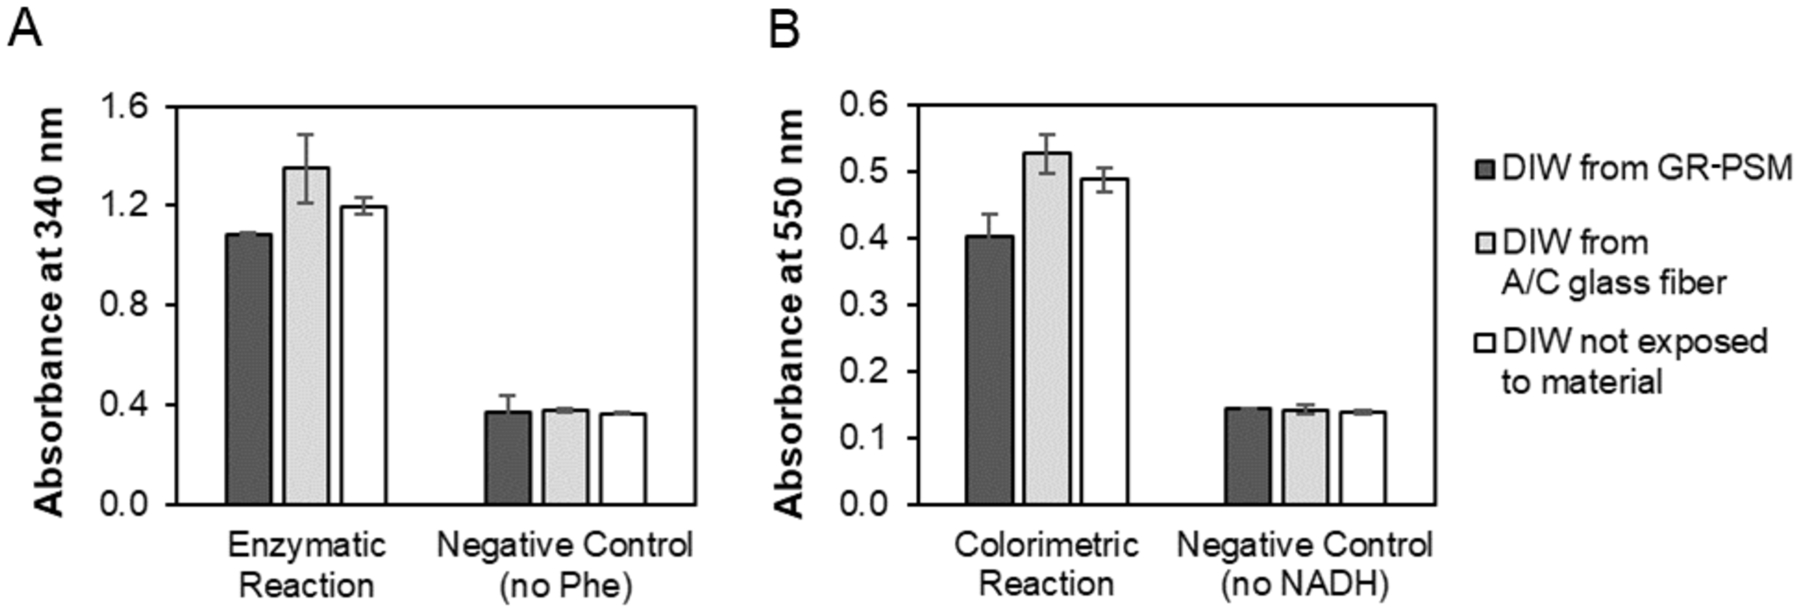
(A) Signal of the enzymatic reaction in the presence of fluid exposed to the A/C glass fiber was comparable to that of the positive control reaction (reaction fluid not exposed to any substrate). The signal in the presence of fluid exposed to the GR-PSM indicated a modest decrease compared to that of the positive control reaction. The signals from the negative control wells with no Phe were comparable, indicating that neither of the porous materials contributed to nonspecific signal. (B) Signal of the colorimetric reaction in the presence of fluid exposed to A/C glass fiber was comparable to that of the positive control reaction, while there was a modest decrease in the signal generated, reduced by 20% from fluid exposed to the PSM. The signals from the negative control wells with colorimetric reagents only and no NADH were comparable, indicating that neither of the porous materials contributed to nonspecific signal. For (A) and (B), each bar shows an average of three replicate measurements and the error bar displays the 95% confidence interval.
Reagent affinity for substrate
Development of an effective paper microfluidic device requires basic characterization of reagent affinity for the porous material. For example, antibodies used as the capture species in conventional lateral flow assays (LFAs) are known to have a high affinity for nitrocellulose substrates, and this knowledge is critical in the design and fabrication of LFAs.33 The signal in our device is dependent on different reagents rehydrating, mixing, and moving within the device, or remaining fixed, so knowledge of the affinity of each of our reagents with each of our porous substrates is critical. Different reagents were stored dry in each of the porous pads depending on pH constraints on the reactants/reactions. As highlighted in Figure 1, the NAD+ required for the enzymatic reaction could not be stored under the alkaline pH conditions of the enzymatic glass fiber pad, since NAD+ undergoes significant levels of conversion to NADH in alkaline conditions (and would result in substantial nonspecific signal).34 Thus, the design choice was made to store the NAD+ in the upstream PSM (under acidic conditions that minimize nonspecific signal). We investigated the affinity of NAD+ to the PSM polysulfone material by rehydrating dried NAD+ in the PSM, centrifuging the NAD+ containing fluid from the PSM, and evaluating the level of NAD+ in that fluid using the enzymatic reaction (see Equation (1)) and the resulting absorbance signal for NADH at 340 nm. Results, shown in Figure 4A, indicate that approximately 21% of the dried NAD+ was recovered in the spun-out fluid. (This conclusion was enabled by the knowledge that the signals from a fresh solution of NAD+ and NAD+ rehydrated from our short-term drying protocol were comparable, so the drying process did not appreciably affect NAD+.) Although this process does not exactly match the on-device process shown schematically in Figure 1 where plasma in the GR-PSM rehydrates dried NAD+ and flows to the enzymatic pad, the results can be used to infer that a majority of the NAD+ remains in the PSM in our device, with 21% serving as an upper limit to the mass of NAD+ available to the downstream enzymatic reaction. Coupled with the characterization results of the plasma volume transferred to the enzymatic pad (described above), we can accurately estimate the concentration of NAD+ in the enzymatic reaction on device.
Figure 4: Enzymatic reagent affinity to PSM and glass fiber:

(A) NAD+ affinity to GR-PSM was assessed by quantifying the concentration of NAD+ in the spun-out fluid from a GR-PSM into which NAD+ had been dried and then rehydrated with DIW (N = 4). The NAD+ calibration curve data points (solid circles) are background corrected averages of three replicates and the error bars display 95% confidence intervals. The signal from the spun-out fluid (hollow square) suggests that approximately 21% of the original NAD+ mass deposited into the GR-PSM would be available for transport to the downstream enzymatic reaction. (B) Representative images of PheDH enzyme localization in A/C glass fiber after spotting versus after spotting and fluid flow through the substrate. PheDH showed an affinity for the glass fiber, though not as great as antibody for glass fiber (more intense blue stain) or nitrocellulose substrates (smaller spot size). Note that for these experiments, the buffer PBS was used in place of BTP buffer, due to a high level of nonspecific staining signal from the latter. (C) The colorimetric reagents mPMS and NBT showed significant mobility in the glass fiber under lateral flow. The farther away that mPMS was spotted from NBT (left), the less mPMS was transported downstream with the NADH sample to enable the colorimetric reaction, thus producing decreasing signal. An even more extreme decrease in colorimetric signal was produced when spotting NBT upstream of mPMS (right), such that at the largest spotting separation, there was no significant amount of NBT transported downstream to produce a color change at the end of the strip. This indicates that NBT has a higher affinity for the glass fiber, or less mobility in the glass fiber, compared to mPMS. The approximate locations of the mPMS spots are outlined with a solid line, while the approximate locations of the NBT spots are outlined with a dashed line. (D) Under vertical fluid transfer, the original spotted diameter of the mixed colorimetric reagents (left) increased 9% after 2 minutes (middle) and 14% after 6 minutes (right), indicating only modest movement laterally of the co-located mPMS and NBT. Error bars display 95% confidence intervals (N = 4).
Once into the enzymatic pad, plasma flowed laterally within the pad and rehydrated the dried PheDH (and BTP buffer salts) stored there, as shown schematically in Figure 1. The data in Figure 4B indicate that PheDH has a reasonably high affinity for A/C glass fiber with a strong protein staining signal even after the lateral flow of water through the protein-spotted region. For comparison, the expected strong protein staining signal for antibody spotted onto nitrocellulose is also presented. Further, antibody appears to have a high affinity for the glass fiber. Based on these results, we relied on nonspecific absorption of PheDH onto A/C glass fiber in our device.
The enzymatic reaction was allowed to run for approximately two minutes within our device, and then contact between the wetted enzymatic pad and a smaller dry colorimetric glass fiber pad enabled the sample to flow vertically and rehydrate the dried colorimetric reagents mPMS and NBT (and BTP buffer salts), as shown schematically in Figure 1. We chose this design due to the need for separate reaction zones for the enzymatic and colorimetric reactions (pH incompatibilities described further below), and based on the affinity of the colorimetric reagents for glass fiber in different configurations. Regarding the latter, both mPMS and NBT were found to have undesirable substantial mobility under lateral flow in glass fiber as shown in Figure 4C. However, when restricted to vertical fluid flow only, the co-localized colorimetric reagents showed only modest lateral diffusion from their original spotted region within the colorimetric pad. The data of Figure 4D indicate that the area over which the colorimetric product developed during vertical transfer was within 10% of the area defined by the volume of deposited reagent solution. Thus, we inferred that under vertical flow, the majority of the rehydrated colorimetric reagents would be available for reaction in their original spotted location. In order to ensure consistent signal generation, we filled the colorimetric pad uniformly with the colorimetric reagents.
Manipulating pH within the device
One of the challenges in designing for multiple reactions in porous materials was balancing different preferred conditions for the reactions. As described in the schematic of Figure 1, the target pH for the enzymatic reaction was near pH 9, while the target pH for the colorimetric reaction was at pH less than 8. Our design accommodated this difference through choice of storage buffer concentration and pH such that upon rehydration by the plasma sample, each reaction occurred at an appropriate pH. The first reaction required the enzyme PheDH, which has its highest activity at pH 11.5,35 and showed a significant decrease in enzyme activity below pH 9, as indicated by the absorbance signal (at 340 nm) data and the colorimetric data in Figure 5A. While PheDH activity was optimal at higher alkaline pH, this had to be balanced by the nonspecific conversion of NAD+ to NADH under alkaline conditions, as shown by the absorbance signal (at 340 nm) data in Figure 5B(i) of only NAD+ at different pH conditions. Thus, we were wary of potential background signal from NAD+ in our colorimetric assay signal. The images in Figure 5B(ii) indicate that nonspecific NADH production at pH 9.3 led to visible color change in glass fiber over a 10 minute timescale, but was not appreciable on the shorter timescale of 2 minutes relevant in our device.
Figure 5: Effect of pH on the two-reaction system for phenylalanine detection.

(A) Enzymatic reaction signal in buffer, NADH absorbance at 340 nm (NAD+ background subtracted) at different pH (left) indicated enzyme activity decreased with decreasing pH below our chosen pH near 9.0. Similarly, colorimetric readout of the enzymatic reaction in buffer within porous materials at different pHs indicated substantial reduction in signal with decreasing reaction pH (right). (B) (i) Increased conversion of NAD+ to NADH occurred during the enzymatic reaction in buffer at pH 9.3 as measured by absorbance signal at 340 nm. (ii) Similarly, images of colorimetric readout of the nonspecific conversion of NAD+ to NADH in the absence of other reactants indicated minimal nonspecific signal at 2 minutes, and appreciable nonspecific signal at 10 minutes (using the same blood sample). (C) Colorimetric reagents in buffer produced nonspecific absorbance signal at 550 nm above pH 8 on the timescale of minutes. Thus, a critical requirement for generating minimal nonspecific signal in the colorimetric reaction was to reduce the sample pH to less than pH 8. For (A), (B) and (C), each error bar displays the 95% confidence interval (N = 3).
The colorimetric reagents produced significant nonspecific absorbance signals (at 550 nm) at short timescales for solutions above pH 8, as shown in Figure 5C. However, there was no significant nonspecific signal between pH 6.5 and pH 8, so we set the goal of maintaining the colorimetric reaction at pH less than 8. For simplicity, one buffer, BTP, with a large buffering range of pH 6.2 to 9.5, was used in our device.
Plasma is known to have a pH near 7.5 and be weakly buffering.36 Therefore, rehydrated buffer stored in the enzymatic pad must overcome the sample of weakly buffing plasma and shift the pH to near 9. Similarly, the rehydrated buffer stored in the colorimetric pad must then shift the plasma pH to below 8. As described above, another constraint of our system was the need to have the NAD+ dried in the PSM at pH less than 7 to minimize nonspecific conversion of NAD+ to NADH. We observed a modest change in the pH of DIW exposed to the PSM, from pH 5.9 to pH 6.3, that was still within our target range of acceptable pH for NAD+ dry down.
The effect of each of the porous materials on the pH of a plasma sample initially at pH 7.6 is presented in Figure 6A. Namely, the exposure of plasma to the PSM did not significantly change the plasma pH, while exposure of plasma to A/C glass fiber substantially increased the plasma pH. Further, it was clear that manipulation of the plasma pH was needed in order to achieve a pH in the desired range for each device module. The schematic of Figure 6B and the data of Figure 6C show how the concentration and pH of the dried buffer in each of the pads can be used to change the pH of the plasma sample at successive stages within the device. Panels (ii) and (iv) show buffer combinations that led to pH in the desired ranges for the reactions. Specifically, for panel (iv), plasma pH was shifted from pH 7.5 to pH 8.9 with 440 mM BTP at pH 9.4 dried into the enzymatic pad. The plasma pH was then shifted to pH 7.8 with 440 mM BTP at pH 6.3 dried into the colorimetric pad. In contrast, panels (i) and (iii) show buffer combinations that led to pH conditions outside of the desired pH ranges for the colorimetric reaction. Thus, we were able to successfully manipulate the pH within our device.
Figure 6: Manipulating the pH of fluid added to porous glass fiber pads.

(A) Plasma did not change pH appreciably after exposure to the GR-PSM, but did change substantially after exposure to A/C glass fiber. Each error bar (N of at least 3) displays the standard deviation. (B) Schematic of experiment modeling how pH was manipulated and tracked in our device. (C) Different concentrations of BTP buffers were stored in the enzymatic pad at high pH (pH 9.4) and the colorimetric pad at low pH (pH 6.3), and the plasma pH measured after exposure to each porous material. (i) Plasma initially at pH 7.6 did not significantly change pH after exposure to the PSM, but shifted to pH 8.6 after exposure to the enzymatic pad with 220 mM BTP, and then shifted to pH 8.2 after exposure to the colorimetric pad with 110 mM BTP. (ii) Plasma shifted to pH 8.6 after exposure to the 220 mM BTP enzymatic pad, and then to pH 7.4 after exposure to the 440 mM BTP colorimetric pad. (iii) Plasma shifted to pH 8.9 after exposure to the 440 mM BTP enzymatic pad, and then shifted to pH 8.4 after exposure to the 110 mM BTP colorimetric pad. (iv) Plasma pH shifted to pH 8.9 after exposure to the 440 mM BTP enzymatic pad, and then to pH 7.8 after exposure to the colorimetric pad with 440 mM BTP. Cases (ii) and (iv) met our target pH ranges for the enzymatic (near the top dashed line) and colorimetric reactions (below the bottom dashed-double dotted line). Each bar shows an average of three replicate measurements (using the same plasma sample), and each error bar represents the 95% confidence interval.
Characterization of device response curve using spiked phenylalanine in human whole blood
Incorporating the improved design parameters described above, we evaluated device performance with serial dilutions of phenylalanine-spiked whole blood. The operation of the updated phenylalanine detection device was improved over that of the previous prototype in two ways. First, the updated device only required 20 μL of whole blood, a reduction of 50% from the previous prototype and compatible with a finger stick blood sample from the least invasive lancets. Second, the updated phenylalanine detection device had a time to result of four minutes, a 50% reduction from the previous prototype. For this evaluation, we used a multi-device card that enabled simultaneous running of six samples. Similar to in the previous prototype, the multi-device card required the operator to perform a folding step to achieve fluid transfer from the enzymatic to the colorimetric reaction zones of the device. Figure 7A shows representative images of the colorimetric signal for different total phenylalanine concentrations in whole blood. Figure 7B displays the device response curve over the phenylalanine concentration range investigated.
Figure 7: Evaluation of the updated phenylalanine detection device.
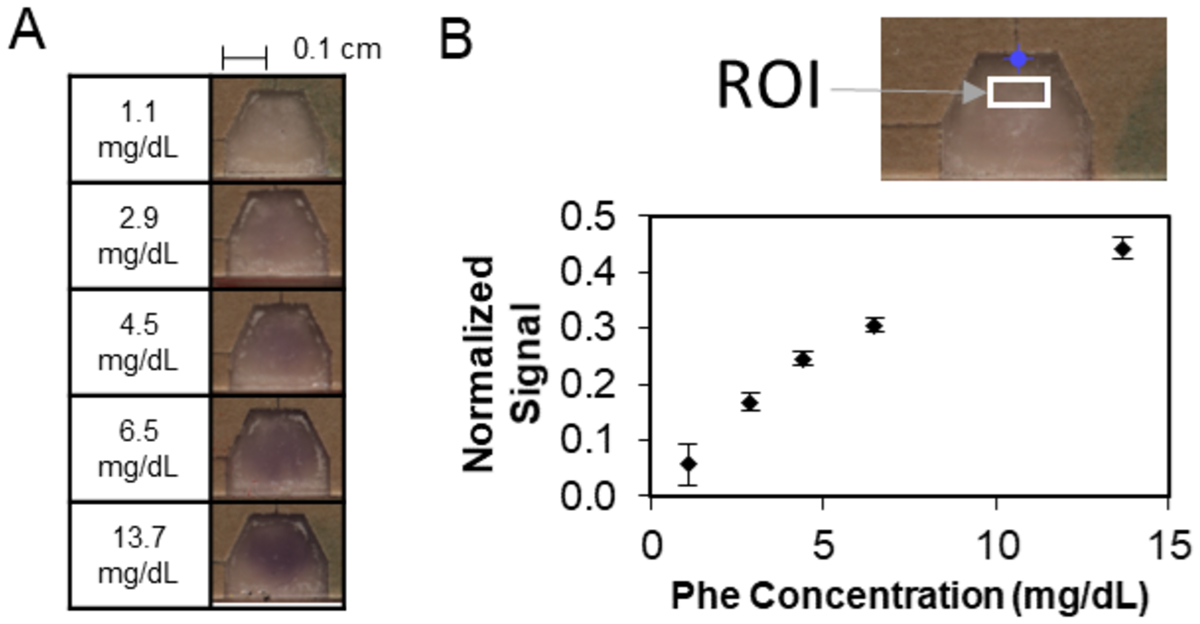
(A) Representative images of colorimetric output for a concentration series of total phenylalanine in human whole blood. (B) (top) Region of interest (ROI) where signal was analyzed. (bottom) Response curve of normalized signal vs. total phenylalanine concentration in whole blood in multi-device folding cards. Each data point is the average of five replicates (using the same blood sample), and each error bar represents the 95% confidence interval. Gold standard LC-MS was used to assess the actual phenylalanine concentrations in the samples assessed.
For context, phenylalanine blood levels in people without PKU are approximately 1 mg/dL. For people with PKU, phenylalanine blood levels in the range of 2 to 6 mg/dL are considered to be controlled, while phenylalanine levels above 6 mg/dL are considered elevated.37 Thus, PKU patients could be empowered with real-time feedback on their blood phenylalanine levels. Specifically, those with elevated phenylalanine levels could take steps to lower their levels, potentially through more stringent diet control. Further, patients with sustained elevated phenylalanine levels, especially over 10 mg/dL, could seek guidance from their healthcare provider.
A standard addition plot was created (see Figure S1 in SI) and a linear fit of the data corresponding to the lowest three spiked phenylalanine concentrations indicated an endogenous phenylalanine concentration (from the magnitude of the x-intercept) of approximately 1.3 mg/dL. This agrees reasonably well with the liquid chromatography-mass spectrometry (LC-MS) result of 1.1 mg/dL. A potential source of the discrepancy is the slight deviation from linearity at higher phenylalanine concentrations within this range. (Note that the line through the lowest two spiked phenylalanine concentrations indicated a lower endogenous phenylalanine concentration of approximately 1.0 mg/dL). The average coefficient of variation of device raw intensity was quantified as approximately 3%, indicating low signal variability. The average quantitative resolution of the assay normalized signal was 0.5 mg/dL for total phenylalanine concentrations between 1.1 and 6.5 mg/dL, inclusive. The quantitative resolution of the updated device is substantially improved, almost 3× for lower phenylalanine concentrations, over the original prototype benchmarked at 1.4 mg/dL,30 while requiring a significantly smaller volume blood sample and a substantially shorter time to result.
The current device characterization indicates promising baseline performance on samples containing phenylalanine in the same background blood/plasma matrix. Although human blood/plasma is considered a highly consistent body fluid relative to others, such as saliva, we expect that the variability in plasma samples from different people could potentially contribute to increased device variability in a clinical setting. Thus, our next step is to complete device development to enable testing on patient samples in the clinic setting for a more comprehensive characterization of device performance.
Summary
In this study, we have described an example of rational device design through the characterization of fluid and reagent interactions in nonstandard porous materials for multi-step sample processing. Specifically, we have discussed three sets of characterization experiments: (i) substrate-substrate fluidic compatibility and reagent-substrate chemical compatibility, (ii) reagent affinity for porous substrates, and (iii) step-wise pH monitoring. We have demonstrated the utility of measuring fluid volume transfer within the device and how the results can be significantly different from assumptions of pad filling based on fluid front progression within a material. We have also demonstrated the utility of testing for chemical compatibility between porous substrates and reactions of interest, in particular for adverse effects on signal. This type of quantification can be especially useful during device optimization, and enables design choices that appropriately balance system requirements and constraints. Further, we have shown that the characterization of reagent adsorption to substrates of interest without and after flow can aid in the design of reagent storage within the device. Our pH studies have indicated that pH may have a significant effect on the stability/activity of reagents and that understanding pH effects on both specific and nonspecific signal can inform device design and specifically motivate the need for strict control of pH for on-device reactions to ensure adequate device performance. Finally, we have demonstrated the detection of phenylalanine from human whole blood using a second-generation paper-based phenylalanine test that has multiple strengths over a previous version.
Supplementary Material
Acknowledgements
We gratefully acknowledge financial support from OSU, and NIH Grant #1R01HD091175. The content of this article is solely the responsibility of the authors and does not necessarily represent the official views of the National Institutes of Health.
Footnotes
This general detection scheme has been used in a commercially-available absorbance-based colorimetric kit for phenylalanine detection (Enzolve Technologies). Although the kit showed promising performance for quantitative phenylalanine detection, the laboratory-based format was not compatible with point-of-care use due to a 4 hour time to result, the requirements for an absorbance plate reader, refrigerated reagents, and multiple manual manipulations.
According to Pall Corporation, GR-PSM has ≥ 80% plasma recovery with the ability to process 40–50 μL/cm2 blood, while GX- PSM has ≥ 60% plasma recovery, and a blood processing capability of 20–30 μL/cm2. Both have been treated with a proprietary process to reduce hemolysis.
References
- (1).Fu E; Liang T; Spicar-Mihalic P; Houghtaling J; Ramachandran S; Yager P Two-Dimensional Paper Network Format That Enables Simple Multistep Assays for Use in Low-Resource Settings in the Context of Malaria Antigen Detection. Anal. Chem 2012, 84 (10), 4574–4579, DOI: 10.1021/ac300689s. [DOI] [PMC free article] [PubMed] [Google Scholar]
- (2).Ramachandran S; Fu E; Lutz B; Yager P Long-Term Dry Storage of an Enzyme-Based Reagent System for ELISA in Point-of-Care Devices. Analyst 2014, 139 (6), 1456–1462, DOI: 10.1039/C3AN02296J. [DOI] [PMC free article] [PubMed] [Google Scholar]
- (3).Fridley GE; Le H; Yager P Highly Sensitive Immunoassay Based on Controlled Rehydration of Patterned Reagents in a 2-Dimensional Paper Network. Anal. Chem 2014, 86 (13), 6447–6453, DOI: 10.1021/ac500872j. [DOI] [PMC free article] [PubMed] [Google Scholar]
- (4).Huang S; Abe K; Bennett S; Liang T; Ladd PD; Yokobe L; Anderson CE; Shah K; Bishop J; Purfield M; et al. Disposable Autonomous Device for Swab-to-Result Diagnosis of Influenza. Anal. Chem 2017, 89 (11), 5776–5783, DOI: 10.1021/acs.analchem.6b04801. [DOI] [PMC free article] [PubMed] [Google Scholar]
- (5).Lafleur LK; Bishop JD; Heiniger EK; Gallagher RP; Wheeler MD; Kauffman P; Zhang X; Kline EC; Buser JR; Kumar S; et al. A Rapid, Instrument-Free, Sample-to-Result Nucleic Acid Amplification Test. Lab Chip 2016, 16 (19), 3777–3787, DOI: 10.1039/C6LC00677A. [DOI] [PubMed] [Google Scholar]
- (6).Perez-Cruz A; Stiharu I; Dominguez-Gonzalez A Two-Dimensional Model of Imbibition into Paper-Based Networks Using Richards’ Equation. Microfluid. Nanofluidics 2017, 21 (5), 1–12, DOI: 10.1007/s10404-017-1937-0. [DOI] [Google Scholar]
- (7).Elizalde E; Urteaga R; Berli CL A. Rational Design of Capillary-Driven Flows for Paper-Based Microfluidics. Lab Chip 2015, 15 (10), 2173–2180, DOI: 10.1039/c4lc01487a. [DOI] [PubMed] [Google Scholar]
- (8).Fu E; Ramsey SA; Kauffman P; Lutz B; Yager P Transport in Two-Dimensional Paper Networks. Microfluid. Nanofluidics 2011, 10 (1), 29–35, DOI: 10.1007/s10404-010-0643-y. [DOI] [PMC free article] [PubMed] [Google Scholar]
- (9).Rath D; Sathishkumar N; Toley BJ Experimental Measurement of Parameters Governing Flow Rates and Partial Saturation in Paper-Based Microfluidic Devices 2018, 34 (3), 8758–8766, DOI: 10.1021/acs.langmuir.8b01345. [DOI] [PubMed] [Google Scholar]
- (10).Lahr RH; Wallace GC; Vikesland PJ Raman Characterization of Nanoparticle Transport in Microfluidic Paper-Based Analytical Devices (MPADs). ACS Appl. Mater. Interfaces 2015, 7 (17), 9139–9146, DOI: 10.1021/acsami.5b01192. [DOI] [PubMed] [Google Scholar]
- (11).Evans E; Gabriel EFM; Coltro WKT; Garcia CD Rational Selection of Substrates to Improve Color Intensity and Uniformity on Microfluidic Paper-Based Analytical Devices. Analyst 2014, 139 (9), 2127–2132, DOI: 10.1039/c4an00230j. [DOI] [PMC free article] [PubMed] [Google Scholar]
- (12).Fridley GE; Le HQ; Fu E; Yager P Controlled Release of Dry Reagents in Porous Media for Tunable Temporal and Spatial Distribution upon Rehydration. Lab Chip 2012, 12 (21), 4321–4327, DOI: 10.1039/c2lc40785j. [DOI] [PMC free article] [PubMed] [Google Scholar]
- (13).Ota R; Yamada K; Suzuki K; Citterio D Quantitative Evaluation of Analyte Transport on Microfluidic Paper-Based Analytical Devices (MPADs). Analyst 2018, 143 (3), 643–653. DOI: 10.1039/c7an01702b. [DOI] [PubMed] [Google Scholar]
- (14).Nguyen MP; Meredith NA; Kelly SP; Henry CS Design Considerations for Reducing Sample Loss in Microfluidic Paper-Based Analytical Devices. Anal. Chim. Acta 2018, 1017, 20–25, DOI: 10.1016/j.aca.2018.01.036. [DOI] [PMC free article] [PubMed] [Google Scholar]
- (15).Al Hafid N; Christodoulou J Phenylketonuria: A Review of Current and Future Treatments. Transl. Pediatr 2015, 4 (4), 304–30417, DOI: 10.3978/j.issn.2224-4336.2015.10.07. [DOI] [PMC free article] [PubMed] [Google Scholar]
- (16).Thiessen G; Robinson R; De Los Reyes K; Monnat RJ; Fu E Conversion of a Laboratory-Based Test for Phenylalanine Detection to a Simple Paper-Based Format and Implications for PKU Screening in Low-Resource Settings. Analyst 2015, 140 (2), 609–615, DOI: 10.1039/C4AN01627K. [DOI] [PubMed] [Google Scholar]
- (17).Gerasimova NS; Steklova IV; Tuuminen T. Fluorometric Method for Phenylalanine Microplate Assay Adapted for Phenylketonuria Screening. Clin. Chem 1989, 35 (10), 2112–2115. [PubMed] [Google Scholar]
- (18).Roesel RA; Blankenship PR; Hommes FA HPLC Assay of Phenylalanine and Tyrosine in Blood Spots on Filter Paper. Clin. Chim. Acta 1986, 156 (1), 91–96, DOI: 10.1016/0009-8981(86)90183-x. [DOI] [PubMed] [Google Scholar]
- (19).Rudy JL; Rutledge JC; Lewis SL Phenylalanine and Tyrosine in Serum and Eluates from Dried Blood Spots as Determined by Reversed-Phase Liquid Chromatography. Clin. Chem 1987, 33 (7), 1152–1154. [PubMed] [Google Scholar]
- (20).Rashed MS; Ozand PT; Bucknall MP; Little D Diagnosis of Inborn Errors of Metabolism from Blood Spots by Acylcarnitines and Amino Acids Profiling Using Automated Electrospray Tandem Mass Spectrometry. Pediatr. Res 1995, 38 (3), 324–331, DOI: 10.1203/00006450-199509000-00009. [DOI] [PubMed] [Google Scholar]
- (21).Chace DH; Sherwin JE; Hillman SL; Lorey F; Cunningham GC Use of Phenylalanine-to-Tyrosine Ratio Determined by Tandem Mass Spectrometry to Improve Newborn Screening for Phenylketonuria of Early Discharge Specimens Collected in the First 24 Hours. Clin. Chem 1998, 44 (12), 2405–2409. [PubMed] [Google Scholar]
- (22).Wendel U; Langenbeck U Towards Self-Monitoring and Self-Treatment in Phenylketonuria — a Way to Better Diet Compliance. Eur. J. Pediatr 1996, 155 (S1), S105–S107. 10.1007/PL00014224. [DOI] [PubMed] [Google Scholar]
- (23).Bilginsoy C; Waitzman N; Leonard CO; Ernst SL Living with Phenylketonuria: Perspectives of Patients and Their Families. J. Inherit. Metab. Dis 2005, 28 (5), 639–649, DOI: 10.1007/s10545-005-4478-8. [DOI] [PubMed] [Google Scholar]
- (24).Seashore MR; Wappner R; Cho S; de la Cruz F Development of Guidelines for Treatment of Children With Phenylketonuria: Report of a Meeting at the National Institute of Child Health and Human Development Held August 15, 1995, National Institutes of Health, Bethesda, Maryland. Pediatrics 1999, 104 (6), e67–e67, DOI: 10.1542/peds.104.6.e67. [DOI] [PubMed] [Google Scholar]
- (25).Wappner R; Cho S; Kronmal RA; Schuett V; Seashore MR Management of Phenylketonuria for Optimal Outcome: A Review of Guidelines for Phenylketonuria Management and a Report of Surveys of Parents, Patients, and Clinic Directors. Pediatrics 1999, 104 (6), e68–e68, DOI: 10.1542/peds.104.6.e68. [DOI] [PubMed] [Google Scholar]
- (26).National Institutes of Health Consensus Development Panel. National Institutes of Health Consensus Development Conference Statement: Phenylketonuria: Screening and Management, October 16–18, 2000. Pediatrics 2001, 108 (4), 972–982, DOI: 10.1542/peds.108.4.972. [DOI] [PubMed] [Google Scholar]
- (27).Arakawa T; Koshida T; Gessei T; Miyajima K; Takahashi D; Kudo H; Yano K; Mitsubayashi K Biosensor for L-Phenylalanine Based on the Optical Detection of NADH Using a UV Light Emitting Diode. Microchim. Acta 2011, 173 (1–2), 199–205, DOI: 10.1007/s00604-010-0536-5. [DOI] [Google Scholar]
- (28).Omidinia E; Shadjou N; Hasanzadeh M Immobilization of Phenylalanine-Dehydrogenase on Nano-Sized Polytaurine: A New Platform for Application of Nano-Polymeric Materials on Enzymatic Biosensing Technology. Mater. Sci. Eng. C 2014, 42, 368–373, DOI: 10.1016/j.msec.2014.05.036. [DOI] [PubMed] [Google Scholar]
- (29).Yu Q; Xue L; Hiblot J; Griss R; Fabritz S; Roux C; Binz PA; Haas D; Okun JG; Johnsson K Semisynthetic Sensor Proteins Enable Metabolic Assays at the Point of Care. Science (80-.) 2018, 361 (6407), 1122–1126, DOI: 10.1126/science.aat7992. [DOI] [PubMed] [Google Scholar]
- (30).Robinson R; Wong L; Monnat RJ; Fu E Development of a Whole Blood Paper-Based Device for Phenylalanine Detection in the Context of PKU Therapy Monitoring. Micromachines 2016, 7 (2), 28, DOI: 10.3390/mi7020028. [DOI] [PMC free article] [PubMed] [Google Scholar]
- (31).Trudnowski RJ; Rico RC Specific Gravity of Blood and Plasma at 4 and 37 °C. Clin. Chem 1974, 20 (5), 615–616. [PubMed] [Google Scholar]
- (32).Schindelin J; Arganda-Carreras I; Frise E; Kaynig V; Longair M; Pietzsch T; Preibisch S; Rueden C; Saalfeld S; Schmid B; et al. Fiji: An Open-Source Platform for Biological-Image Analysis. Nat. Methods 2012, 9 (7), 676–682, DOI: 10.1038/nmeth.2019. [DOI] [PMC free article] [PubMed] [Google Scholar]
- (33).Fridley GE; Holstein CA; Oza SB; Yager P The Evolution of Nitrocellulose as a Material for Bioassays. MRS Bull 2013, 38 (4), 326–330, DOI: 10.1557/mrs.2013.60. [DOI] [Google Scholar]
- (34).Lowery OH; Passonneau JV; Rock MK The Stability of Pyridine Nucleotides. J. Biol. Chem 1961, 236 (10), 2756–2759. [PubMed] [Google Scholar]
- (35).Creative Enzymes. Native Thermoactinomyces intermedius Phenylalanine Dehydrogenase Data Sheet
- (36).Holmes O Fundamentals. In Human Acid-Base Physiology; Springer US: Boston, MA, 1993; pp 1–19. 10.1007/978-1-4899-7200-2_1. [DOI] [Google Scholar]
- (37).Singh RH; Rohr F; Frazier D; Cunningham A; Mofidi S; Ogata B; Splett PL; Moseley K; Huntington K; Acosta PB; et al. Recommendations for the Nutrition Management of Phenylalanine Hydroxylase Deficiency. Genet. Med 2014, 16 (2), 121–131, DOI: 10.1038/gim.2013.179. [DOI] [PMC free article] [PubMed] [Google Scholar]
Associated Data
This section collects any data citations, data availability statements, or supplementary materials included in this article.