

Abstract
Background
Wastewater-based epidemiology provides an opportunity for near real-time, cost-effective monitoring of community-level transmission of SARS-CoV-2. Detection of SARS-CoV-2 RNA in wastewater can identify the presence of COVID-19 in the community, but methods for estimating the numbers of infected individuals on the basis of wastewater RNA concentrations are inadequate.
Methods
This is a wastewater-based epidemiology study using wastewater samples that were collected weekly or twice a week from three sewersheds in South Carolina, USA, between either May 27 or June 16, 2020, and Aug 25, 2020, and tested for SARS-CoV-2 RNA. We developed a susceptible-exposed-infectious-recovered (SEIR) model based on the mass rate of SARS-CoV-2 RNA in the wastewater to predict the number of infected individuals, and have also provided a simplified equation to predict this. Model predictions were compared with the number of confirmed cases identified by the Department of Health and Environmental Control, South Carolina, USA, for the same time period and geographical area.
Findings
We plotted the model predictions for the relationship between mass rate of virus release and numbers of infected individuals, and we validated this prediction on the basis of estimated prevalence from individual testing. A simplified equation to estimate the number of infected individuals fell within the 95% confidence limits of the model. The rate of unreported COVID-19 cases, as estimated by the model, was approximately 11 times that of confirmed cases (ie, ratio of estimated infections for every confirmed case of 10·9, 95% CI 4·2–17·5). This rate aligned well with an independent estimate of 15 infections for every confirmed case in the US state of South Carolina.
Interpretation
The SEIR model provides a robust method to estimate the total number of infected individuals in a sewershed on the basis of the mass rate of RNA copies released per day. This approach overcomes some of the limitations associated with individual testing campaigns and thereby provides an additional tool that can be used to inform policy decisions.
Funding
Clemson University, USA.
Introduction
Early detection and containment of the SARS-CoV-2 virus is essential to containing community outbreaks of COVID-19.1 Clinical testing of every individual in a community is impractical and expensive.2 By contrast, environmental surveillance can enable continuous, cost-effective means of monitoring communities for early warnings of outbreaks and subsequent progress. Wastewater-based epidemiology is a promising tool to assess COVID-19 prevalence in an area.3 Both symptomatic and asymptotic individuals shed SARS-CoV-2 in their faeces, and studies have shown detection of SARS-CoV-2 genes in raw sewage and primary sewage treatment sludge is possible.4, 5, 6, 7, 8, 9, 10, 11
Wastewater-based epidemiology has been used extensively to detect the presence of infected individuals, ranging from an individual building level to the community level. In a building, determining the presence or absence of infection is sufficient to guide mitigation efforts, whereas at the community level, quantifying the extent (ie, having a viable means to estimate the number of cases) could allow local governments to informatively tailor policies on the basis of the severity of the outbreak. Before wastewater-based epidemiology can be widely adapted for COVID-19 prevention and management, a method is needed to estimate the number of active infections from the viral RNA load detected in wastewater. To capture the infection dynamics of COVID-19, we used a susceptible-exposed-infectious-recovered (SEIR) model, which has been previously used to predict SARS-CoV-2 transmission.12, 13, 14 The SEIR model used in this study estimated the number of infections on the basis of the mass rate of virus RNA in sewage (ie, gene copies per day1) for two of the three wastewater treatment plants (WWTPs) monitored, accounting for variability in factors such as faecal production rate, SARS-CoV-2 RNA density in faeces, and decay rates during transit in sewer lines. Expressing viral RNA load in terms of a mass rate minimises the impact of dilution of sewage from non-viral sources such as stormwater runoff and infiltration during rain events. This approach provides a platform for comparing results between sewersheds (ie, sewage catchment areas served by individual WWTPs) in any location.
Research in context.
Evidence before this study
We searched PubMed without any language restrictions for articles published from database inception to Dec 31, 2020, using the search terms “wastewater based epidemiology”, “COVID-19 RNA mass rate”, and “SEIR modeling”. After screening abstracts and full texts of the search results, our literature review showed that there are no published SEIR models that link numbers of infected individuals to RNA mass rates of the SARS-CoV-2 virus in wastewater. In particular, no previous studies had incorporated uncertainty in evaluating the multiple parameters that affect this relationship, including the basic reproduction number, the incubation time, duration of infection, time to reach the maximum viral load, the maximum viral load, mean viral load after the maximum is reached, travel time in the sewershed, temperature of the sewage, and decay rate of the RNA in the sewer system.
Added value of this study
To our knowledge, we report the first SEIR model that allows for robust predictions of the number of infected individuals located within a sewershed using the mass rate of SARS-CoV-2 RNA in sewage samples. The model prediction for the under-reported number of individuals with COVID-19 in Clemson, South Carolina, USA, based on sewage surveillance data, compares favourably to an independent estimate of 15 infections for every confirmed case in the US state of South Carolina.
Implications of all the available evidence
Given the high amounts of uncertainty associated with reporting new cases for individuals infected with the SARS-CoV-2 virus, and large numbers of asymptomatic individuals, the SEIR model shown in this Article provides policy makers with an added tool to help assess the extent to which a population is infected. The code that implements the proposed model is publicly available and can be adapted to any sewershed by adjusting the relevant input parameters.
Methods
Sewersheds
Wastewater from three sewersheds in South Carolina, USA, was monitored (figure 1 ). The Clemson University WWTP serves the main campus, with a student body of about 25 000, and a small adjacent residential area. The Cochran Road WWTP serves approximately one-half of the City of Clemson, including an area of high density off-campus student housing (about 9000 residents overall). The Pendleton–Clemson WWTP serves the Town of Pendleton and the other half of the City of Clemson, and serves a mixture of residential neighbourhoods and off-campus student housing (around 14 000 overall). During the summer months, there is a modest decline in the population within the combined sewersheds. The Clemson University WWTP services the dormitories (about 7000 students) plus all those who visit the campus on a daily basis. The Cochran Road WWTP and the Pendleton–Clemson WWTP sewersheds, taken together, align closely with the 29631 ZIP code area, for which the South Carolina Department of Health and Environmental Control (SCDHEC) reports COVID-19 cases. There are no major industrial dischargers operating in the three sewersheds.
Figure 1.

Sewersheds under surveillance for SARS-CoV-2 in wastewater
The 29631 ZIP code area overlaps mainly with the Cochran Road and Pendleton–Clemson sewersheds. The Clemson University sewershed encompasses the campus and a small residential area adjacent to the campus.
Sample collection, SARS-CoV-2 detection, and quantification
Sewage samples were collected weekly or twice a week, starting on May 27, 2020, from the Clemson University WWTP and on June 11, 2020, from both the Cochran Road WWTP and the Pendleton–Clemson WWTP, and finishing on Aug 25, 2020. Composite samples were collected continuously during a 24 h period and stored at around 4°C. Samples (500 mL in plastic bottles) were stored on ice and shipped overnight to SiREM Laboratory (Knoxville, TN, USA) for quantification of SARS-CoV-2. Details about the methods used to quantify SARS-CoV-2 in wastewater samples are provided in the appendix (p 2–4); briefly, samples were prepared by pasteurisation, centrifugation, and extraction of the virus RNA with salt and polyethylene glycol. The precipitated RNA was collected as a pellet after centrifugation and resuspended in TRIzol reagent (ThermoFisher Scientific, Waltham, MA, USA). Quantification of gene copies per L was done using quantitative reverse transcription PCR of the N protein gene. Detection limits ranged from 860 to 4000 gene copies per L.
Modelling infected individuals
The SEIR model organises individuals into four compartments according to their disease status and other criteria: susceptible (individuals who could acquire the infection); exposed (infected individuals who are not yet contagious); infectious (individuals who are infected and contagious); and recovered (those who are no longer infectious).15 Recovered individuals were assumed to be no longer susceptible to infection within the timeframe of this study,16 although this assumption could easily be modified if future evidence contradicts it. S(t) is the proportion of the population that is susceptible, E(t) the proportion that is exposed, I(t) the proportion that is infectious, and R(t) the proportion that is recovered, at t (a given time). The transitions between categories are governed by the following system of differential equations shown in (1), (2), (3), (4):
| (1) |
| (2) |
| (3) |
| (4) |
where β is the number of contacts per day that are sufficient to lead to infection, α is the rate of progression from exposed to infectious (the reciprocal is the incubation period), and γ denotes the rate of loss of infectiousness (the reciprocal is the infectious period). As is common, and without a loss of generality, we assumed that time is measured in days, and all associated rate parameters are interpreted accordingly. In particular, the basic reproduction number, R0, for an SEIR model is given by R0=βS(0)/γ, in which S(0) denotes the proportion of the population that is initially susceptible.17 Hethcote15 and Abou-Ismail18 provide an overview of SEIR models and related variants.
For this study, an α value of 0·20 was assumed, because the median incubation period of COVID-19 is 5 days.19 The recovered rate (γ) was set to 0·10, because a typical infectious period for COVID-19 is 10 days.20 We assumed that 0·005% of the population was initially infectious, another 0·005% of the population was initially exposed, and the remaining 99·99% of the population was initially susceptible.21 Three values of β were evaluated: 0·15 (corresponding to R0 1·50), 0·20 (R0 2·0), and 0·25 (R0 2·5), consistent with reported estimates for COVID-19.22, 23, 24
Using the SEIR model and the aforementioned parameter settings, we assumed that the number of new infections on the jth day (denoted as C j) obeys:
| (5) |
where N is the number of individuals in the sewershed. For each day j = 1, ..., J, we sampled C j from its distribution. For i = 1, ..., C j, let V ij(t) denote the number of copies of SARS-CoV-2 RNA entering the sewershed through the faeces of the ith individual from among the C j who became infected on day j. We refer to V ij(t) as the viral trajectory of individual (i, j). Specifically, we assumed that:
| (6) |
where δij is the number of g of faeces contributed by the ith individual who was infected on the jth day, ϕij is the log 10 maximum RNA copies per g of faeces being shed (assumed to occur 5 days after being infected), and ψij is the log10 RNA copies per g of faeces being shed 25 days after being infected. This model of viral trajectory assumes an incubation time of 5 days—ie, the number of days until symptoms appear.19 During this period, the individual's viral shedding is allowed to increase to its maximum. The maximum was determined on the basis of findings by Wölfel and colleagues,25 and the evidence that maximum shedding of SARS-CoV-2 occurs around the onset of symptoms.14 To control the decline of viral shedding during the course of the infection, we further assimilated findings from Wölfel and colleagues25 to set the log10 RNA copies per g of faeces at 25 days after infection (20 days after symptoms). The specific settings are log10 (δij) ∼ N(2·11,0·252), ϕij ∼ N(7·6,0·82), and ψij ∼ N(3·5,0·352). Given equation 6, the viral load being introduced into the sewershed at time t is given by:
| (7) |
To relate the viral load being introduced into the system to that being measured, we accounted for time- dependent degradation in the sewer system using the exponential decay model discussed by Hart and Halden.2 Accordingly, the measured viral load at time t is given by:
| (8) |
where τ denotes the holding time (ie, elapsed time between waste excretion and arrival at the WWTP), V (t, τ) is the so-called downstream RNA copies measured at the WWTP, V 0(t) is the viral load introduced into the sewershed, and τ* is the temperature-dependent half-life. τ for both sewersheds in this study was set at 1·1 h, based on the sewage residence times cited in Kapo and colleagues26 for systems with capacities of about 3·8 × 106 L per day. The temperature adjusted half-life is determined by:
| (9) |
in which τ0* is the half-life (h) at an ambient temperature of T 0, T is the current temperature of the system, and Q 0 is a temperature-dependent rate of change.27 Ahmed and colleagues28 reported that for SARS-CoV-2, τ0* ∈ {57, 202} at 20°C, and that Q 0 ∈ {2, 3}. On the basis of these values, we sampled τ0* ∈ N (130, 252) and Q 0 ∈ N (2·5, 0·152) during Monte Carlo simulations.
The code that implements the full SEIR model was curated into an R (version 3.6.2) package and is available via GitHub. This code can be used to do the full Monte Carlo simulation described in this study. A simplified version of the SEIR model was packaged as an R Shiny app. This application can provide real time assessments in a user-friendly manner and can be used to predict case counts on the basis of user-specified RNA concentrations. As a part of both of these sets of code, users can specify input parameters (eg, reproductive number, viral half-life, and sewage temperature) and rerun analyses, making the proposed approach adaptable to any sewershed.
Although the code described previously is publicly available and can be readily implemented, we also provide a simpler approach to estimating the number of infected individuals in a sewershed using wastewater data. The number of infected individuals in a given 24 h period (J t) can be estimated as previously described,4, 29 on the basis that the mass rate of virus copies present in sewage (numerator) and the mass rate for shedding of the virus (denominator) is:
| (10) |
where Q is the average flow rate at the WWTP (L per day) for a 24 h period, V is the virus copies per L, A is the rate of faeces production per person (g per day), and B is the maximum rate at which the virus is shed (RNA copies per g faeces per day). For this study, Q was obtained from records kept by the WWTPs; V was quantified in samples sent to SiREM (RNA copies per L); A was set at 128 g per day, the median value for developed countries;30 and B was set at 4·7 × 107 RNA copies per g faeces, the maximum rate reported by Wölfel and colleagues.25 The RNA mass rate is the numerator in equation 10—ie, a product of the sewage flow rate and virus RNA concentration.
Role of the funding source
The funder of the study reviewed the study design but had no role in data collection, data analysis, data interpretation, or the drafting of the manuscript.
Results
In anticipation of students returning to campus for the fall semester, Clemson University began surveillance for SARS-CoV-2 at its WWTP on May 27, 2020 (table 1 ). At that time, only essential staff and administrators were using the campus, along with a small number of graduate students and student athletes; no other undergraduates were present. Consequently, the flow rate through the treatment plant was between one-third and one-half of what typically occurs when campus access is unrestricted. The intent of monitoring during this period was to establish a baseline for comparison with operation when undergraduate students returned in mid-September. For the duration of the surveillance reported here, virus copies were close to, or below, detection thresholds.
Table 1.
SARS-CoV-2 RNA concentrations in samples taken in 2020 in three adjoining sewersheds
| Rainfall (cm) |
Clemson University WWTP* |
Cochran Road WWTP |
Pendleton–Clemson WWTP |
ZIP code 29631 area |
|||||||||
|---|---|---|---|---|---|---|---|---|---|---|---|---|---|
| Flow rate (106 L per day) | RNA (copies per L) | RNA rate (1012 copies per day) | Flow rate (106 L per day) | RNA (copies per L) | RNA rate (1012 copies per day) | Flow rate (106 L per day) | RNA (copies per L) | RNA rate (1012 copies per day) | Flow rate (106 L per day) | RNA rate (1012 copies per day) | Estimated infected individuals† | ||
| June 11 | 0·00 | 1·34 | BDL | .. | NST | NST | NST | NST | NST | NST | .. | .. | .. |
| June 16 | 0·00 | 1·64 | 5·5 × 103 | 0·0090 | 2·68 | 1·8 × 106 | 4·82 | NST | NST | NST | .. | .. | .. |
| June 18 | 1·27 | 1·39 | BDL | .. | 3·67 | 5·5 × 105 | 2·02 | NST | NST | NST | .. | .. | .. |
| June 23 | 1·80 | 1·39 | BDL | .. | 3·91 | 3·8 × 106 | 14·86 | 4·16 | 2·9 × 105 | 1·21 | 8·07 | 16·1 | 2649 |
| June 25 | 0·20 | 1·50 | BDL | .. | 3·84 | 9·7 × 105 | 3·72 | 4·23 | 9·0 × 105 | 3·81 | 8·07 | 7·53 | 1242 |
| June 30 | 0·00 | 1·33 | BDL | .. | 3·34 | 9·8 × 105 | 3·28 | NST | NST | NST | .. | .. | .. |
| July 2 | 0·00 | 1·36 | 1·8 × 104 | 0·0244 | NST | NST | NST | 3·69 | 2·9 × 105 | 1·07 | .. | .. | .. |
| July 7 | 3·40 | 1·66 | 1·0 × 104 | 0·0166 | 6·28 | 1·7 × 105 | 1·07 | 4·02 | 2·2 × 105 | 0·88 | 10·29 | 1·95 | 322 |
| July 9 | 0·00 | 1·44 | BDL | .. | 3·89 | 2·4 × 105 | 0·93 | 3·66 | 3·3 × 105 | 1·21 | 7·55 | 2·14 | 353 |
| July 14 | 0·00 | 1·44 | BDL | .. | 3·41 | 1·9 × 106 | 6·48 | 3·48 | 4·5 × 105 | 1·56 | 6·89 | 8·05 | 1327 |
| July 16 | 0·00 | 1·45 | BDL | .. | 3·71 | 4·9 × 105 | 1·82 | 3·47 | 1·2 × 105 | 0·42 | 7·17 | 2·23 | 368 |
| July 21 | 0·00 | 1·34 | 1·2 × 104 | 0·0160 | 3·35 | 5·9 × 104 | 0·20 | 3·45 | 2·0 × 105 | 0·69 | 6·81 | 0·89 | 147 |
| July 28 | 0·00 | 1·41 | 1·4 × 104 | 0·0197 | 3·33 | 9·1 × 105 | 3·03 | 3·39 | 1·3 × 105 | 0·44 | 6·72 | 3·47 | 573 |
| Aug 5 | 0·00 | 1·53 | BDL | .. | 2·59 | 7·0 × 105 | 1·81 | 3·69 | 1·6 × 105 | 0·59 | 6·28 | 2·41 | 397 |
| Aug 11 | 0·00 | 1·46 | BDL | .. | 2·80 | 7·6 × 104 | 0·21 | 3·89 | 1·1 × 105 | 0·43 | 6·69 | 0·64 | 106 |
| Aug 18 | 0·03 | 1·55 | 1·7 × 104 | 0·0264 | 3·52 | 7·0 × 104 | 0·25 | 4·17 | 1·5 × 105 | 0·63 | 7·69 | 0·87 | 144 |
| Aug 25 | 0·18 | 1·94 | BDL | .. | 3·50 | 8·0 × 105 | 2·80 | 4·05 | 2·3 × 105 | 0·93 | 7·55 | 3·73 | 616 |
BDL=below detection level. NST=no sample taken. WWTP=wastewater treatment plant.
The Clemson University WWTP was also sampled on May 27, May 28, May 2, June 4, and June 9, 2020, and all these results were BDL.
Calculated using equation 10.
Because most Clemson University students live off-campus, the surveillance plan included monitoring wastewater in the two WWTPs that adjoin the campus (the Cochran Road and Pendleton–Clemson WWTPs). Viral RNA concentrations were mostly above 105 copies per L in both sewersheds. A modest decrease in concentrations occurred at the Cochran Road WWTP starting in mid-July 2020, possibly related to a local law being passed on June 25, 2020, which required people to wear masks in the City of Clemson. Table 1 also reports mass rates for RNA copies, based on flow rate (Q) multiplied by concentration (V).
The SEIR model (figure 2A ) predicts decreases in the susceptible population as individuals become exposed and infected, then recover. The distribution of RNA copies per day present in sewage was estimated for the combined Cochran Road plus Pendleton–Clemson sewersheds (figure 1), with an estimated population during the summer months of 16 000 individuals (figure 2B). As the number of infected individuals increases, so does the mass rate of viral RNA production appearing in the sewage; as individuals recover and shedding rates decrease, the mass rate of viral copies discharged decreases.
Figure 2.

The susceptible-exposed-infectious-recovered model
(A) Proportions of the population that are susceptible to SARS-CoV-2 infection, exposed, infectious, and recovered. (B) Model predictions for mass rate of SARS-CoV-2 RNA in wastewater over time. Individual black points represent each Monte Carlo simulation. (C) Predictions of the number of infections versus RNA mass rate. Individual grey points represent each simulation, with the median, 75% CI, and 95% CI shown. Coloured datapoints correspond to measured RNA mass rates (table 1) and estimates of infected individuals based on equation 10 and estimated positive cases (n=320), assuming that 2% of the population was infected. The green rectangle represents the average RNA mass rates for July 16, 2020, to Aug 18, 2020, (table 1) versus the 320 positive cases.
Model predictions for the relationship between mass rate of virus release and numbers of infected individuals are shown in figure 2C. Using mass rates (table 1) for the 29631 ZIP code area, estimates of the number of infected individuals using equation 10 were plotted (blue circles) and fall within the 95% confidence interval. Predictions for the total number of infected individuals in the 29631 ZIP code area using equation 10 (table 1 and blue circles in figure 2C) were lower than those predicted with the SEIR model, probably because the simplified approach is based on the maximum shedding rate and does not consider virus decay during transit. Another estimate of the number of infected individuals is also plotted against the measured mass rates. For an estimated population of 16 000 during the summer months and a 2% level of infection (based on individual testing of Clemson University employees between July 20 and July 22, 2020, many of whom lived in the 29631 ZIP code area), the estimated number of active cases was 320. This estimate versus mass rates between July 16 and Aug 18, 2020 fell within the 95% confidence interval (figure 2C and table 1). When these measurements were averaged the mean RNA mass rates fell within the 75% confidence interval for the SEIR model (figure 2C).
The value of β used in the SEIR model was 0·20. β affected the timing and magnitude of the peak of the epidemic (figure 2A) but did not appreciably affect the association between active cases and the mass rate of gene copies detected in wastewater (figure 2C; appendix p 6). Likewise, varying the mean for the maximum viral shedding rate (ϕij) from 7 to 8, the mean for the viral shed at 25 days (ψij) from 3 to 4, and the time to maximum shedding from 4 to 6 days only modestly affected the SEIR model predictions, with the greatest effect being attributable to the mean for the maximum viral shedding rate (appendix 7–9).
Model predictions based on RNA mass rates were compared with SCDHEC data for confirmed COVID-19 cases for the 29631 ZIP code area, which were corrected for under-reporting using an estimated ratio of 10·9 actual cases for every one confirmed (figure 3 ). SCDHEC active cases were calculated as the sum of the confirmed cases within a 15-day window that was formed by the previous 10 days, the current day, and the following 4 days. This period was defined to match the exposed and infectious periods discussed previously, and to account for the likelihood that people would seek testing at the onset of symptoms—ie, at around day 5 of being infected. Wu and colleagues31 estimated that there were 15 infections for each confirmed case in South Carolina, USA. Our proposed model found a statistically similar ratio of 10·9 (95% CI 4·2–17·5) for the study area during a similar timeframe (ie, between June 23 and Aug 25). The model was run with additional wastewater RNA results and reported case data collected during the fall of 2020 (appendix pp 10–13). Because of a more intensive testing regime implemented by Clemson University from Sept 1 to Nov 30, 2020, our approach suggested that the ratio of unreported to reported cases should be decreased from 10·9 to 4·9 infections for each confirmed case; for further details see appendix pp 10–13).
Figure 3.
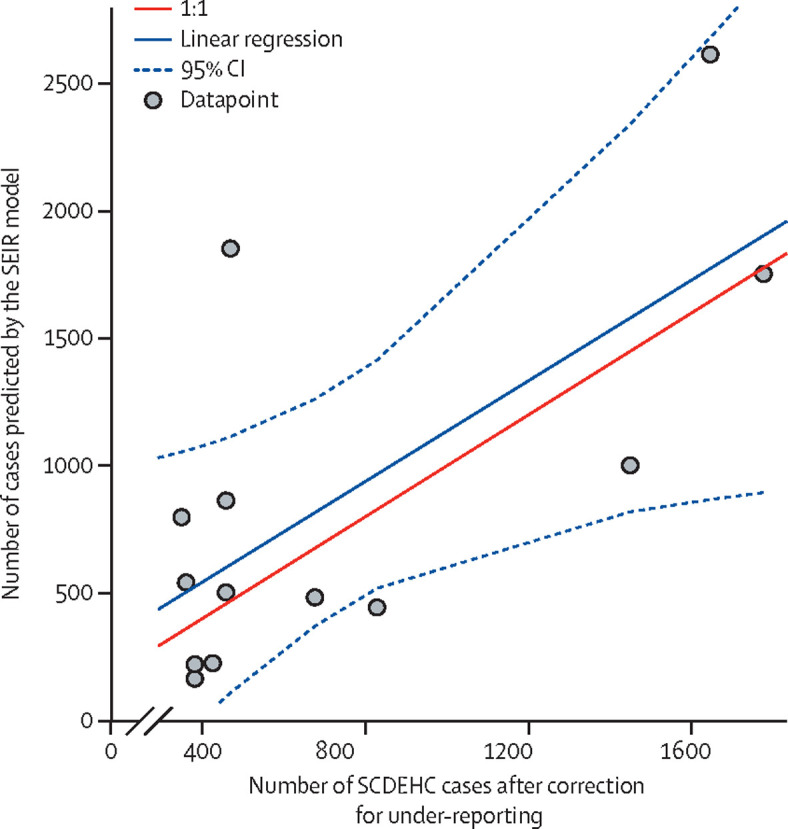
COVID-19 cases predicted by the SEIR model compared with SCDEHC cases after correction for under-reporting
SEIR model predictions of active COVID-19 cases in the 29631 ZIP code area based on RNA mass rates in wastewater compared with the number of cases confirmed by SCDEHC and corrected for under-reporting using an estimated ratio of ten actual cases to every nine cases confirmed by testing. Individual grey points represent each simulation. The 1:1 ratio represents a perfect match between the model and active cases. SCDEHC=South Carolina Department of Health and Environmental Control. SEIR=susceptible-exposed-infectious-recovered.
Discussion
Hundreds of communities worldwide are now using wastewater surveillance of SARS-CoV-2. Wastewater surveillance fills a gap left by incomplete individual testing.32 Nevertheless, the usefulness of wastewater-based epidemiology has been limited by the difficulty of relating the prevalence of the virus in wastewater to the number of infected individuals. The model presented here offers a method to estimate the number of infected individuals based on the mass rate of RNA in wastewater. Mass rate is a preferred method compared with using virus concentration. Sewerage collection systems in most areas are subject to dilution through stormwater runoff and infiltration, thereby lowering the concentration of virus during rain events. Use of a mass rate mitigates this effect by focusing on the product of flow rate and concentration—ie, mass rates are unaffected by a decrease in concentration when multiplied by an increase in flow rate, and vice versa. Consideration should also be given to monitoring virus concentrations using settled solids in place of raw sewage, as virus concentrations associated with settled solids are also less likely to be influenced by dilution.33
The usefulness of the SEIR model was shown for the two sewersheds that serve the community adjacent to Clemson University. Because these sewersheds coincide with the 29631 ZIP code area, it was possible to relate model estimates of infected individuals to new cases. In doing so, we can estimate under-reporting rates for two timeframes, which are differentiated on the basis of the initiation of large-scale testing efforts by Clemson University; for further discussion see the appendix p 10. Wu and colleagues31 estimated 15 infections for every confirmed case in South Carolina; during the first timeframe (ie, June 23 and Aug 25), our proposed model found a statistically similar ratio of 10·9 (95% CI 4·2–17·5) for the study area. One of the contributing factors to under-reporting in college communities (beyond typical issues such as bias caused by imperfect testing, inadequate testing resources, testing practices, testing hesitancy, and rate of asymptomatic infections within the target population) involves the misallocation of positive test results owing to residency—ie, student cases could be allocated to their county of residence, rather than the county in which the university is located. These issues associated with under-reporting further emphasise the value of using the model to estimate infected individuals, because the wastewater data directly reflect who is located within the sewershed, without the need to sort out whether the location of the infected individual is different from the ZIP code to which the infection is assigned.
It is not yet known how widely generalisable to other sewersheds the results we have reported here are. Many inherent differences exist among sewersheds; thus, to make our work more generalisable, we developed and disseminated code in the form of an R package (version 3.6.2) that makes running our model on new parameter configurations easy. All of the differences that are likely to exist between sewersheds are built into the model, including population density, temperature, and the time of travel to the wastewater treatment plant. The effect of stormwater runoff and infiltration on the concentration of the virus is likely to be specific to the waste management system. Nevertheless, the model relies on the mass rate (not the concentration) of viral RNA reaching the treatment plant, which is easily computable for any sewershed, using the flow rate and RNA concentrations.
One of the challenges with wastewater-based epidemiology is how to communicate results to policy makers and the public. Concentration measurements are difficult to comprehend and could be subject to considerable dilution in collection systems that combine sanitary waste with stormwater runoff. We propose a system that relates the percentage of people in a sewershed catchment area who are infected to the RNA copies present in sewage per person per day (table 2 ). For any given sewershed, RNA copies per person per day can be calculated using the sewage flow rate multiplied by the virus RNA concentration (ie, the RNA mass rate), divided by the number of people present. Ranges can be adjusted to conditions specific to individual sewersheds. In the absence of widespread and systematic human-based testing, concern levels from wastewater-based epidemiology provide a way to communicate the severity of transmission to the public. For example, concern level 2 can serve as a leading indicator that active transmission is underway, even before new cases are reported. The higher the concern level, the more compelling the need to implement policies that will mitigate transmission of the virus.
Table 2.
Proposed system for interpreting SARS-CoV-2 RNA concentrations in wastewater, by proportion of people infected
| Copies person−1 d−1* | Concern level | ||
|---|---|---|---|
| <0·01% | <6·0 × 105 | 0 | |
| 0·01 to <0·1% | 6·0 × 105 – 6·0 × 106 | 1 | |
| 0·1 to <1·0% | 6·0 × 106 – 6·0 × 107 | 2 | |
| 1·0 to 5·0% | 6·0 × 107 – 3·0 × 108 | 3 | |
| >5·0% | >3·0 × 108 | 4 | |
Estimated using the number of infected individuals within the sewershed multiplied by the denominator in equation 10 (ie, A × B), divided by the total number of individuals within the sewershed. For example, in a sewershed with 10 000 individuals, of whom 0·10% are infected, the copies per person per day=(10 000) × (0·001) × (128 g faeces−1 person−1 d−1) × (4·7 × 107 copies g faeces−1)/(10 000)=6·0 × 106 copies.
Because infected individuals continue to shed virus after they have recovered, SARS-CoV-2 RNA concentrations in wastewater becomes a lagging indicator. At that point, it is worth questioning the use of continuing to monitor for the virus in wastewater. However, the quantitative value of knowing a community's viral load (relative to public-health data with its recognised limitations) and the benefits to public-health policy and local governance decisions, strongly supports continued sewershed RNA level monitoring. Once RNA levels decline sufficiently, wastewater-based epidemiology can once again be used as a leading indicator of a resurgence of transmission.
This study has several limitations, including validation of the proposed model based on new case data. First, because of inadequate testing, the asymptomatic nature of many infected individuals, and testing hesitancy, the true number of new COVID-19 cases in our study area is unknown, as would be the case in practically all regions of the USA and elsewhere. Furthermore, given the population being studied, case reporting could be misallocated because of residency (ie, student cases could be allocated to their county of residence, rather than to the county in which Clemson University is located). Further, owing to mitigation strategies (eg, testing strategies) deployed by Clemson University, the relation between reported cases and actual cases changed throughout the fall semester. In particular, testing capacity and efforts both greatly expanded during the study period, leading to the detection of many asymptomatic infections that would have otherwise gone undetected. In addition to the validation issues, the model predictions rely on several key parameters for which there are sparse data, including the distribution of shedding rates, when shedding begins, and how long it continues. Although our sensitivity analyses showed that moderate misspecification of these parameters did not lead to appreciable differences, further investigations would strengthen this proposal. Furthermore, this study did not encompass the effect of variants, which might alter the model inputs.
In spite of these limitations, the SEIR model shown in this study provides a framework for quantifying the relationship between the mass rate of viral release in a sewershed and the numbers of infected individuals present. The model was validated on the basis of estimated prevalence from individual testing. Furthermore, the model was used to estimate the under-reporting rate of COVID-19 in the study area over two time periods. Equipped with a method to quantify the numbers of infected individuals within a sewershed (while considering the uncertainty about these numbers), policy makers now have an additional tool that can aid in tailoring policy and decision making.
Data sharing
With the exception of new case data that was obtained from SCDHEC, all of the data used in this study are provided in the Article or appendix. The new case data can be obtained by contacting the corresponding lead author (mcmaha2@clemson.edu). The model is available via GitHub (https://github.com/scwatson812/COVID19WastewaterModel). A simplified version of the model is also publicly available (https://rennertl.shinyapps.io/Wastewater_projections/).
Declaration of interests
We declare no competing interests.
Contributors
CSM and SS developed the model and worked with LR to make it available as an R package and R Shiny application. DG provided sample analysis and data interpretation. CC collected data on new cases from South Carolina Department of Health and Environmental Control. DLF managed the sample collection process, preparation of the data for modelling, and suggested the concept of basing model predictions on RNA mass rates. JAD and SCP drafted the original Article. DK provided guidance on model interpretation, validation, and the approach to communicating results to the public. TK and CK assisted with interpretation of the modelling results. All authors had full access to all the data, verified the underlying data, and contributed to the editing of the Article. All authors read and approved the final Article, and had final responsibility for the decision to submit for publication.
Supplementary Material
References
- 1.Dhama K, Khan S, Tiwari R, et al. Coronavirus Disease 2019—COVID-19. Clin Microbiol Rev. 2020;33:e00028–e00030. doi: 10.1128/CMR.00028-20. [DOI] [PMC free article] [PubMed] [Google Scholar]
- 2.Hart OE, Halden RU. Computational analysis of SARS-CoV-2/COVID-19 surveillance by wastewater-based epidemiology locally and globally: feasibility, economy, opportunities and challenges. Sci Total Environ. 2020;730 doi: 10.1016/j.scitotenv.2020.138875. [DOI] [PMC free article] [PubMed] [Google Scholar]
- 3.Daughton CG. Wastewater surveillance for population-wide COVID-19: the present and future. Sci Total Environ. 2020;736 doi: 10.1016/j.scitotenv.2020.139631. [DOI] [PMC free article] [PubMed] [Google Scholar]
- 4.Ahmed W, Angel N, Edson J, et al. First confirmed detection of SARS-CoV-2 in untreated wastewater in Australia: a proof of concept for the wastewater surveillance of COVID-19 in the community. Sci Total Environ. 2020;728 doi: 10.1016/j.scitotenv.2020.138764. [DOI] [PMC free article] [PubMed] [Google Scholar]
- 5.Chen C, Gao G, Xu Y, et al. SARS-CoV-2-positive sputum and feces after conversion of pharyngeal samples in patients with COVID-19. Ann Intern Med. 2020;172:832–834. doi: 10.7326/M20-0991. [DOI] [PMC free article] [PubMed] [Google Scholar]
- 6.Chen Y, Chen L, Deng Q, et al. The presence of SARS-CoV-2 RNA in the feces of COVID-19 patients. J Med Virol. 2020;92:833–840. doi: 10.1002/jmv.25825. [DOI] [PubMed] [Google Scholar]
- 7.Kumar M, Patel AK, Shah AV, et al. First proof of the capability of wastewater surveillance for COVID-19 in India through detection of genetic material of SARS-CoV-2. Sci Total Environ. 2020;746 doi: 10.1016/j.scitotenv.2020.141326. [DOI] [PMC free article] [PubMed] [Google Scholar]
- 8.La Rosa G, Iaconelli M, Mancini P, et al. First detection of SARS-CoV-2 in untreated wastewaters in Italy. Sci Total Environ. 2020;736 doi: 10.1016/j.scitotenv.2020.139652. [DOI] [PMC free article] [PubMed] [Google Scholar]
- 9.Peccia J, Zulli A, Brackney DE, et al. SARS-CoV-2 RNA concentrations in primary municipal sewage sludge as a leading indicator of COVID-19 outbreak dynamics. medRxiv. 2020 doi: 10.1101/2020.05.19.20105999. published online June 12. (preprint). [DOI] [Google Scholar]
- 10.Sherchan SP, Shahin S, Ward LM, et al. First detection of SARS-CoV-2 RNA in wastewater in North America: a study in Louisiana, USA. Sci Total Environ. 2020;743 doi: 10.1016/j.scitotenv.2020.140621. [DOI] [PMC free article] [PubMed] [Google Scholar]
- 11.Wu F, Xiao A, Zhang J, et al. SARS-CoV-2 RNA concentrations in wastewater foreshadow dynamics and clinical presentation of new COVID-19 cases. Sci Total Environ. 2021;805 doi: 10.1016/j.scitotenv.2021.150121. [DOI] [PMC free article] [PubMed] [Google Scholar]
- 12.Carcione JM, Santos JE, Bagaini C, Ba J. A Simulation of a COVID-19 epidemic based on a deterministic SEIR model. Front Public Heal. 2020;8:230. doi: 10.3389/fpubh.2020.00230. [DOI] [PMC free article] [PubMed] [Google Scholar]
- 13.Godio A, Pace F, Vergnano A. SEIR modeling of the Italian epidemic of SARS-CoV-2 using computational swarm intelligence. Int J Environ Res Public Health. 2020;17 doi: 10.3390/ijerph17103535. [DOI] [PMC free article] [PubMed] [Google Scholar]
- 14.He S, Peng Y, Sun K. SEIR modeling of the COVID-19 and its dynamics. Nonlinear Dyn. 2020 doi: 10.1007/s11071-020-05743-y. published online June 18. [DOI] [PMC free article] [PubMed] [Google Scholar]
- 15.Hethcote HW. The mathematics of infectious diseases. SIAM Rev. 2000;42:599–653. [Google Scholar]
- 16.Hansen CH, Michlmayr D, Gubbels SM, Mølbak K, Ethelberg S. Assessment of protection against reinfection with SARS-CoV-2 among 4 million PCR-tested individuals in Denmark in 2020: a population-level observational study. Lancet. 2021;397:1204–1212. doi: 10.1016/S0140-6736(21)00575-4. [DOI] [PMC free article] [PubMed] [Google Scholar]
- 17.van den Driessche P. Reproduction numbers of infectious disease models. Infect Dis Model. 2017;2:288–303. doi: 10.1016/j.idm.2017.06.002. [DOI] [PMC free article] [PubMed] [Google Scholar]
- 18.Abou-Ismail A. Compartmental models of the COVID-19 pandemic for physicians and physician-scientists. SN Compr Clin Med. 2020;2:1–7. doi: 10.1007/s42399-020-00330-z. [DOI] [PMC free article] [PubMed] [Google Scholar]
- 19.Lauer SA, Grantz KH, Bi Q, et al. The incubation period of coronavirus disease 2019 (COVID-19) from publicly reported confirmed cases: estimation and application. Ann Intern Med. 2020;172:577–582. doi: 10.7326/M20-0504. [DOI] [PMC free article] [PubMed] [Google Scholar]
- 20.US Centers for Disease Control and Prevention Ending isolation and precautions for people with COVID-19: interim guidance. Sept 14, 2021. https://www.cdc.gov/coronavirus/2019-ncov/hcp/duration-isolation.html#:~:text=For%20most%20adults%20with%20COVID,with%20improvement%20of%20other%20symptoms
- 21.Iwata K, Miyakoshi C. A simulation on potential secondary spread of novel coronavirus in an exported country using a stochastic epidemic SEIR model. J Clin Med. 2020;9:E944. doi: 10.3390/jcm9040944. [DOI] [PMC free article] [PubMed] [Google Scholar]
- 22.Fang Y, Nie Y, Penny M. Transmission dynamics of the COVID-19 outbreak and effectiveness of government interventions: a data-driven analysis. J Med Virol. 2020;92:645–659. doi: 10.1002/jmv.25750. [DOI] [PMC free article] [PubMed] [Google Scholar]
- 23.Liu Y, Gayle AA, Wilder-Smith A, Rocklöv J. The reproductive number of COVID-19 is higher compared to SARS coronavirus. J Travel Med. 2020;27 doi: 10.1093/jtm/taaa021. [DOI] [PMC free article] [PubMed] [Google Scholar]
- 24.Wang Y, Wang Y, Chen Y, Qin Q. Unique epidemiological and clinical features of the emerging 2019 novel coronavirus pneumonia (COVID-19) implicate special control measures. J Med Virol. 2020;92:568–576. doi: 10.1002/jmv.25748. [DOI] [PMC free article] [PubMed] [Google Scholar]
- 25.Wölfel R, Corman VM, Guggemos W, et al. Virological assessment of hospitalized patients with COVID-2019. Nature. 2020;581:465–469. doi: 10.1038/s41586-020-2196-x. [DOI] [PubMed] [Google Scholar]
- 26.Kapo KE, Paschka M, Vamshi R, Sebasky M, McDonough K. Estimation of US sewer residence time distributions for national-scale risk assessment of down-the-drain chemicals. Sci Total Environ. 2017;603–604:445–452. doi: 10.1016/j.scitotenv.2017.06.075. [DOI] [PubMed] [Google Scholar]
- 27.Hart OE, Halden RU. Modeling wastewater temperature and attenuation of sewage-borne biomarkers globally. Water Res. 2020;172 doi: 10.1016/j.watres.2020.115473. [DOI] [PubMed] [Google Scholar]
- 28.Ahmed W, Bertsch PM, Bibby K, et al. Decay of SARS-CoV-2 and surrogate murine hepatitis virus RNA in untreated wastewater to inform application in wastewater-based epidemiology. Environ Res. 2020;191 doi: 10.1016/j.envres.2020.110092. [DOI] [PMC free article] [PubMed] [Google Scholar]
- 29.Curtis K, Keeling D, Yetka K, Larson A, Gonzalez R. Wastewater SARS-CoV-2 concentration and loading variability from grab and 24-hour composite samples. medRxiv. 2020 doi: 10.1101/2020.07.10.20150607. published online July 11. (preprint). [DOI] [Google Scholar]
- 30.Rose C, Parker A, Jefferson B, Cartmell E. The characterization of feces and urine: a review of the literature to inform advanced treatment technology. Crit Rev Environ Sci Technol. 2015;45:1827–1879. doi: 10.1080/10643389.2014.1000761. [DOI] [PMC free article] [PubMed] [Google Scholar]
- 31.Wu SL, Mertens AN, Crider YS, et al. Substantial underestimation of SARS-CoV-2 infection in the United States. Nat Commun. 2020;11 doi: 10.1038/s41467-020-18272-4. [DOI] [PMC free article] [PubMed] [Google Scholar]
- 32.Bivins A, North D, Ahmad A, et al. Wastewater-based epidemiology: global collaborative to maximize contributions in the fight against COVID-19. Environ Sci Technol. 2020;54:7754–7757. doi: 10.1021/acs.est.0c02388. [DOI] [PubMed] [Google Scholar]
- 33.Graham KE, Loeb SK, Wolfe MK, et al. SARS-CoV-2 RNA in wastewater settled solids is associated with COVID-19 cases in a large urban sewershed. Environ Sci Technol. 2021;55:488–498. doi: 10.1021/acs.est.0c06191. [DOI] [PubMed] [Google Scholar]
Associated Data
This section collects any data citations, data availability statements, or supplementary materials included in this article.
Supplementary Materials
Data Availability Statement
With the exception of new case data that was obtained from SCDHEC, all of the data used in this study are provided in the Article or appendix. The new case data can be obtained by contacting the corresponding lead author (mcmaha2@clemson.edu). The model is available via GitHub (https://github.com/scwatson812/COVID19WastewaterModel). A simplified version of the model is also publicly available (https://rennertl.shinyapps.io/Wastewater_projections/).