

Abstract
Natural populations often exist in spatially diverse environments and may experience variation in the strength and targets of natural selection across their ranges. Drosophila provides an excellent opportunity to study the effects of spatially varying selection in natural populations, as both D. melanogaster and D. simulans live across a wide range of environments in North America. Here, we characterize patterns of variation in transposable elements (TEs) from six populations of D. melanogaster and nine populations of D. simulans sampled from multiple latitudes across North America. We find a nearly two-fold excess of TEs in D. melanogaster relative to D. simulans, with this difference largely driven by TEs segregating at the lowest and highest allele frequencies. We find no effect of latitude on either total TE abundance or average TE allele frequencies in either species. Moreover, we show that, as a class of mutations, the most common patterns of TE variation do not coincide with the sampled latitudinal gradient, nor are they consistent with local adaptation acting on environmental differences found in the most extreme latitudes. We also do not find a cline in ancestry for North American D. melanogaster—for either TEs or SNPs—suggesting a limited role for demography in shaping patterns of TE variation. Though we find little evidence for widespread clinality among TEs in Drosophila, this does not necessarily imply a limited role for TEs in adaptation. We discuss the need for improved models of adaptation to large-scale environmental heterogeneity, and how these might be applied to TEs.
Keywords: Local adaptation, cline, admixture, recombination, natural selection
Introduction
A central aim in evolutionary biology is to elucidate the genetic basis for local adaptation. One widely used approach for discovering candidate targets of spatially varying selection involves the sampling of many individuals or populations from a continuous geographical transect, such as latitude, longitude, or altitude (Endler 1977, 1986; reviewed in Adrion et al. 2015). Characterizing biological variation along such a transect allows for the identification of clines, broadly defined here as gradients in any measurable genotypic or phenotypic character (Endler, 1977). While demographic processes can also generate clinal variation (Endler, 1977; Vasemägi, 2006), only spatially varying selection is expected to preserve the long-term maintenance of clinal variation in the face of persistent gene flow.
The genus Drosophila provides an excellent opportunity to study the effects of spatially varying selection in natural populations, as both D. melanogaster and D. simulans have recently (within the last 500 years) been introduced in North America and Australia, having since colonized the bulk of both continents (David & Capy, 1988; Lachaise et al., 1988). D. melanogaster has been the subject of many studies on clinal variation in phenotypic traits, inversion polymorphisms, and single loci (reviewed in Adrion et al. 2015; Hoffmann and Weeks 2007). Recent studies utilizing whole-genome technologies have also identified candidate single nucleotide polymorphisms (SNPs) and copy number variants (CNVs) that are potential targets of spatially varying selection in both North America and Australia (Fabian et al., 2012; Kolaczkowski, Kern, Holloway, & Begun, 2011; Machado et al., 2016; Reinhardt, Kolaczkowski, Jones, Begun, & Kern, 2014; Schrider, Begun, & Hahn, 2013; Turner, Levine, Eckert, & Begun, 2008).
While early studies of single-gene clines used data from several populations (e.g. Berry and Kreitman 1993; Verrelli and Eanes 2001), the initial studies of genome-wide clines sampled only the endpoints of a geographic transect (e.g. Turner et al. 2008; Kolaczkowski et al. 2011). These studies typically used pairwise measures of genetic differentiation to identify candidate targets of selection; while pairwise comparisons can be a useful approach to identifying locally adapted variants, the lack of information about variation at intermediate localities along environmental transects means that such variation may not vary clinally (i.e. monotonically) with environmental factors. Recent work on genome-wide SNPs in these species has used more than two populations in North America (Fabian et al., 2012; Bergland, Behrman, O’Brien, Schmidt, & Petrov, 2014; Bergland, Tobler, González, Schmidt, & Petrov, 2016; Machado et al., 2016), offering the opportunity to better understand the effects of spatially varying selection on this type of variation.
Transposable elements represent another important source of genetic variation that could vary clinally, but that have not been studied as extensively as SNPs in this context. While the vast majority of TE insertions are expected to have deleterious fitness effects (reviewed in Charlesworth and Langley 1989; Barrón et al. 2014), TEs can also play a role in adaptation (González, Karasov, Messer, & Petrov, 2010; Hof et al., 2016; Schlenke & Begun, 2004; Schrader et al., 2014). TEs have been implicated in resistance to viral infection (Magwire, et al. 2011) and resistance to insecticides in D. melanogaster (Daborn, 2002; Schmidt et al., 2010), as well as insecticide resistance in the mosquito, Culex pipiens (Darboux, et al. 2007). Moreover, not only can TEs disrupt gene function via alterations of the peptide sequence (reviewed in Casacuberta and González 2013), TEs can also contribute to the modulation of gene expression (Cridland, Thornton, & Long, 2014; Lee, 2015; Lee & Karpen, 2017). However, investigations of clinal patterns in TEs have, thus far, been limited to exploring only a few TE families within D. melanogaster (González, et al. 2010; Ullastres, et al. 2015). For example, allele frequency clines on multiple continents were identified for a particular TE from the invader4 family in D. melanogaster (Ullastres et al., 2015).
Here, we investigate genome-wide TE variation from latitudinally sampled populations of D. melanogaster and D. simulans, with a focus on identifying clinal patterns of TE variation that might suggest a role for TEs in responding to spatially varying selection. Using our updated software, TEFLoN (Adrion, Song, Schrider, Hahn, & Schaack, 2017), we discover and estimate the allele frequencies of all TEs across the genomes of these two species. Comparisons between species allow us to quantify lineage-specific differences in TE abundance and chromosomal distributions that may be correlated with, or a consequence of, important life history differences. Combining a high-resolution recombination map in D. melanogaster with information about the distribution of heterochromatin, we are also able to test long-standing population genetic predictions about how TE density and allele frequencies should be shaped by recombination, demonstrating that the previously observed effects of recombination are likely influenced by heterochromatin. We test important predictions for a model of secondary contact in North American D. melanogaster, showing that there is little evidence for a cline in ancestry due to admixture. We cluster common patterns of TE allele frequency variation across the genome and identify clinal outliers to infer the extent to which TEs may be responding to spatially varying selection. Finally, we consider the consequences of employing different sampling regimes on evolutionary inferences. Our results demonstrate that many biological and evolutionary conclusions may be idiosyncratic to the particular sampling regime implemented, while the signatures of different types of selection may not be distinguishable when sampling along continent-wide climatic gradients.
Materials and Methods
Drosophila samples and sequences
We obtained paired-end Illumina sequence data for samples of both D. melanogaster and D. simulans collected from several localities around the globe at differing time points (Figure 1A, Table S1). Samples of D. melanogaster were collected from five locations along the East Coast of the United States over the span of several years (details in Table S1) and from Panama City, Panama in January 2012 (Zhao, Wit, Svetec, & Begun, 2015). All D. melanogaster samples, with the exception of Africa, were prepared as pooled libraries for sequencing, with variable numbers of whole female flies used to construct each pool (Table S1). To construct an artificial pooled sample from these African samples, we combined the reads from 27 individually sequenced haploid embryos. We then randomly sampled paired-end reads down to a similar level of coverage as found in our D. melanogaster sample from Panama using the package seqtk (https://github.com/lh3/seqtk).
Figure 1.
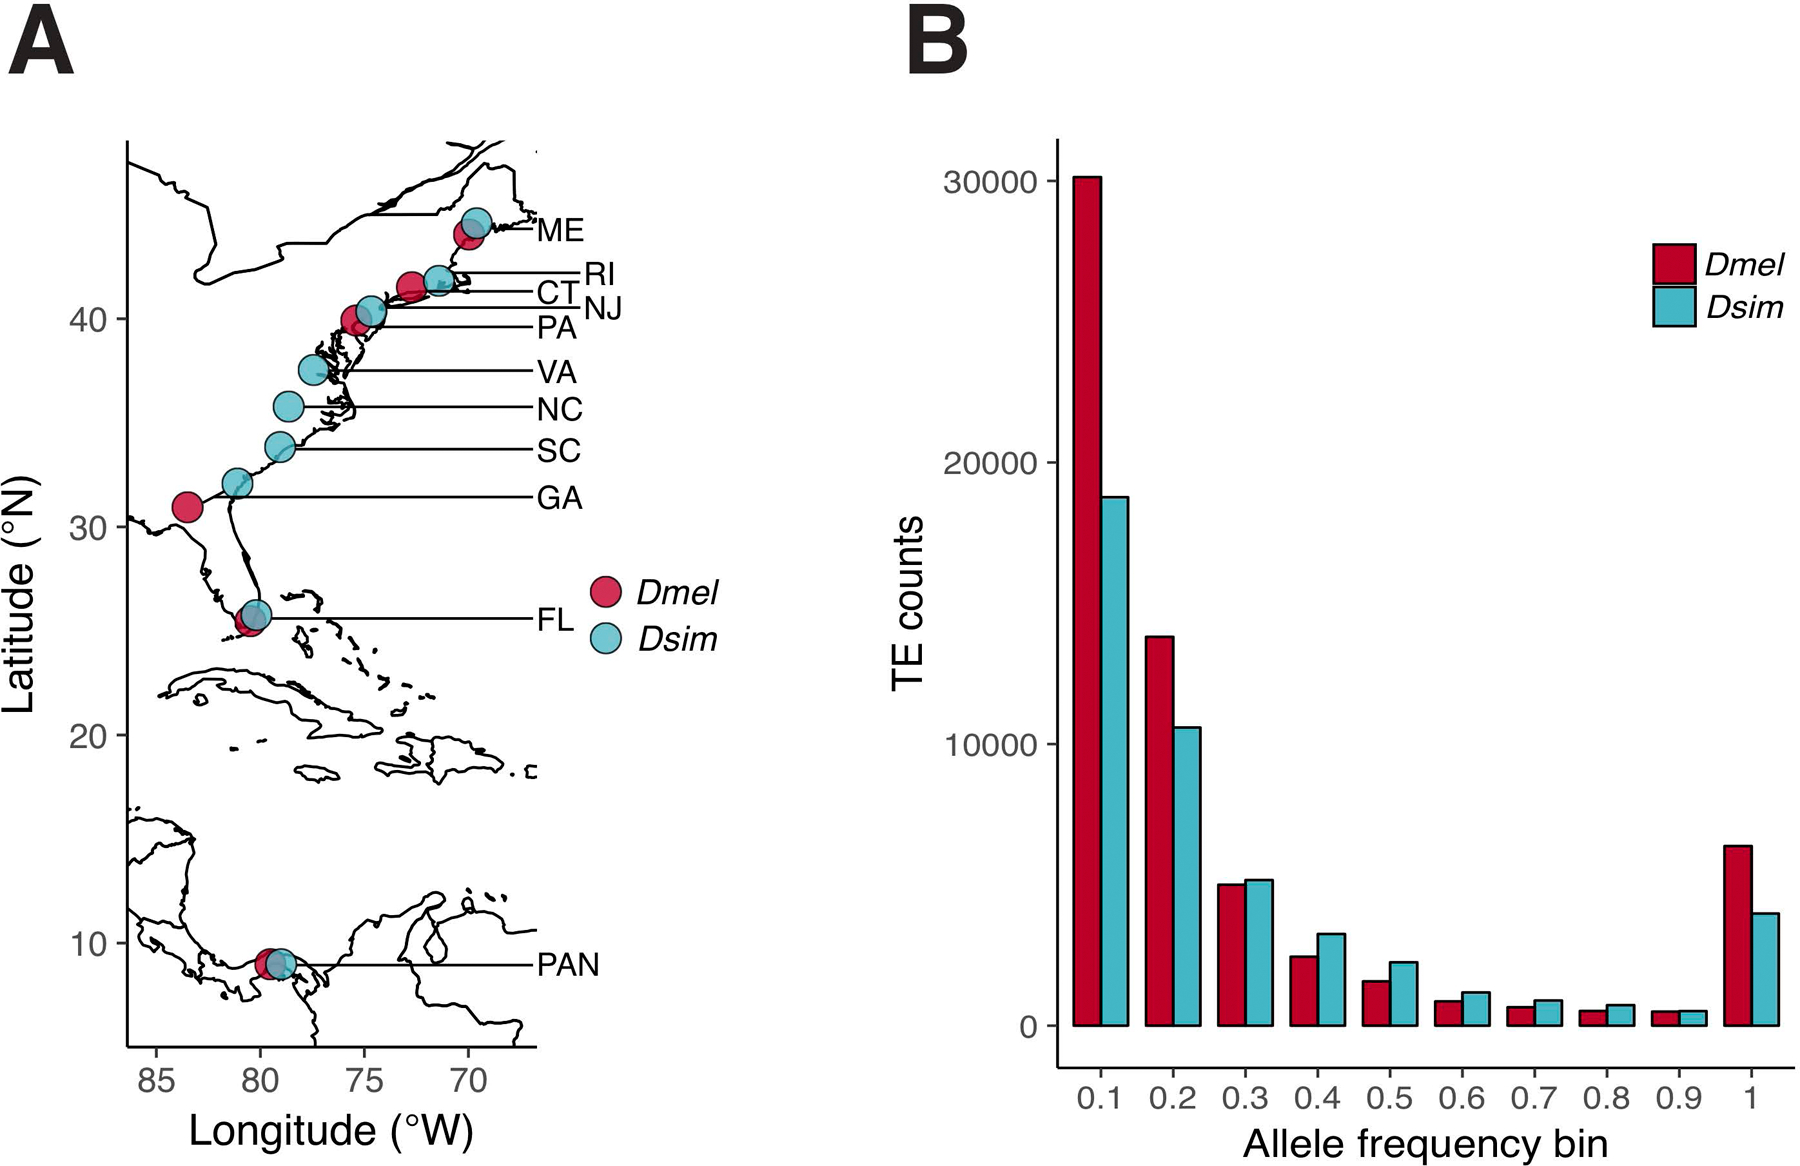
A) Geographic sampling locations for six populations of D. melanogaster (red) and nine populations of D. simulans (blue). B) Allele frequency spectrum for genome-wide TEs from all populations for D. melanogaster (red) and D. simulans (blue).
European D. melanogaster were collected from Vienna, Austria in October 2010 (Bastide et al., 2013). Samples of D. simulans were collected from eight sites along the East Coast of North America in September 2011 and from Panama City, Panama in January 2012 (Figure 1A, Table S1). D. simulans samples from Florida and Rhode Island are the same as those used in Sedghifar et al. (2016). Additional information about pooling, library preparation, and sequencing can be found in the Supplemental Materials and Methods.
Identifying TE positions and estimating allele frequencies
We used TEFLoN v0.4 (Adrion et al. 2017; https://github.com/jradrion/TEFLoN), to discover and estimate the allele frequencies for all TEs in each of our populations. Briefly, TEFLoN uses BWA-mem (Li & Durbin, 2009) to simultaneously map paired-end reads to a user-curated database of TE sequences (see Supplementary Materials and Methods) and a modified reference, using information from this mapping to associate TE sequences with a unique position in the reference genome (r6.13 for D. melanogaster, r2.02 for D. simulans; FlyBase (dos Santos et al., 2015)). TEFLoN leverages information about the presence of TEs from multiple pooled samples to build a union of all TEs present across all populations. In using this information, it is able to estimate the allele frequency for TEs in a focal pool, regardless of whether they were initially discovered in that pool. Prior to allele frequency estimation, we down-sampled the alignments from all pools to the lowest coverage present in a single pool. In doing so, TEFLoN is able to fully leverage the power of the entire dataset to discover the positions of rare TEs, but avoids biasing allele frequency estimates by favoring the calling of rare variants in pools with the highest coverage.
SNP analyses and ancestry cline tests
We used the software package PoPoolation2 (Kofler, Pandey, & Schlötterer, 2011) to call genome-wide SNPs in all eight of our D. melanogaster samples, excluding all SNPs within polymorphic inversions identified Corbett-Detig and Hartl (2012). We describe our pipeline in detail in the Supplemental Materials and Methods. Ancestry clines were tested by calculating pairwise FST between North American D. melanogaster populations and both Vienna and Rwanda for every TE in the genome, as well as for all SNPs located outside polymorphic inversions. We used Spearman’s rank-order correlation on the genome-wide means of FST to test for an association with geography. Additionally, we calculated the proportion of rare TEs—herein defined as all variants segregating at allele frequencies ≤ 0.1 in Vienna but not found in Rwanda or segregating at allele frequencies ≤ 0.1 in Rwanda but not found in Vienna—for each North American population relative to their total abundance in either Vienna or Africa. We again used Spearman’s rank-order correlation to test for an association between the proportion of rare TEs and geography.
Genome-wide patterns of TE variation in Drosophila
We tested the association between TE allele frequency and recombination rate in D. melanoaster using a general linear model (GLM) [glm(TE_allele_frequency ~ recombination_rate + chromatin_state )]. We obtained genome-wide recombination rate estimates for D. melanogaster from Comeron et al (2012). D. melanogaster chromatin state boundaries were obtained from several sources to explore the effects of using different techniques to define these boundaries. We acquired euchromatin/heterochromatin boundaries from Cridland et al (2013) and Lee & Karpen (Lee & Karpen, 2017), and multi-state chromatin boundaries from Filion et al. (2010) and Kharchenko et al. (2011; cell line BG3). We converted the coordinates for these datasets to correspond to assembly r6.13 using liftOver. We tested for an association between reference TE density—calculated as counts per 10 kb—and allele frequency the same way as above. Reference TE coordinates were obtained from FlyBase. Recombination windows and individual TEs were classified as heterochromatic if any portion overlapped or was nested within the heterochromatic boundary (Cridland et al., 2013; Lee & Karpen, 2017), overlapped the BLACK state (Riddle et al., 2011), or overlapped states 7–9 (Kharchenko et al., 2011).
Clinal variation and differentiation of TEs in Drosophila
Allele frequency, as it varies over latitude, can be informative if a large number of variants are all exhibiting similar patterns. We refer to the line graph of allele frequency on latitude for a single TE instance as an allele frequency profile (AFP), and we constructed an AFP for every TE in the genome. We took two distinct K-means clustering approaches—Euclidean distance and cosine similarity—to characterize the most common AFPs in both species, and the details for both of these methods can be found in the Supplemental Materials and Methods. For both clustering methods, we were only able to cluster TEs that had allele frequencies > 0.0 for every population, leading to proportionally fewer TEs available for clustering in D. simulans (9 populations) relative to D. melanogaster (6 populations).
We took an empirical rather than a model-based approach to finding candidate TEs responding to spatially varying selection. We identified clinal TE outliers for both species by regressing TE allele frequency on latitude [glm(allele_frequency ~ latitude, weights=presence_reads + absence_reads)], whereby the allele frequency for each population was weighted by our confidence in the frequency estimate (the sum of presence and absence reads at that site). We estimated this regression for all TEs where at least three populations had a TE segregating between 0.05 and 0.95. We then sorted these regressions by P-value and used the 2% most extreme values to define our outliers. A similar approach was used for calculating the proportion of TEs that fall in each P-value bin.
We calculated isolation-by-distance (IBD) by regressing pairwise FST for TEs from all populations on the Euclidean distance (in km) between the population pairs. Similar to clinal outliers, FST outliers were identified by sorting pairwise FST values for genome-wide TEs, with the 2% most extreme values defining the threshold for being classified as an outlier. We controlled for the unique sampling effect of pooling reads by using an approximation for FST derived in Kolaczkowski et al (2011).
TEs and their proximity to differentially expressed genes
To test whether there may be an effect of TE proximity on clinal patterns of gene expression, we obtained a set of genes that were highly differentially expressed (DE genes; top 50 genes at both 21° and 29° Celsius) between D. melanogaster collected from Panama and Maine from Zhao et al (2015). We calculated the distance along the chromosome from both the 5’ and 3’ breakpoints of coding sequences (CDSs; obtained from FlyBase) for all DE genes and all TEs identified on the same chromosome. To characterize differentiation at the nearest TE locus, pairwise FST between Panama and Maine was calculated for each of these TEs. We also calculated these metrics for all non-DE genes across the genome, and for all CDSs we calculated the distance along the chromosome to clinal and FST outliers.
Results
We used our TE discovery tool, TEFLoN (Adrion et al., 2017), to discover and to estimate allele frequencies for all TEs present in six populations of D. melanogaster and nine populations of D. simulans sampled from North America. Flies were collected along a transect spanning roughly 35° of latitude and 12° of longitude, with all population collected within 200 km of the coast (Figure 1A, Table S1). We discovered a total of 41,407 TEs (27,405 in D. melanogaster and 14,002 in D. simulans) present in at least one population across our samples. These results are based on paired-end sequence data from pooled populations, with genome-wide sequence coverage being standardized among populations to control for possible differences in the power to identify TEs. Further, we required that coverage (defined as the total of “presence” and “absence” reads) be between 10 and 100 for any putative TE at a particular location in a single population to be included in our analysis. In order to mitigate any bias due to differences in the completion of TE databases between the species (largely due to the fact that D. melanogaster has more complete annotations than D. simulans) we used identical techniques to construct the TE database for both species (see Supplemental Materials and Methods). However, if there are rare classes of TEs in natural populations of D. simulans that have yet to be identified, our method will fail to capture them or their effects.
To evaluate the accuracy of TEFLoN in estimating TE allele frequencies, we used our TE simulation software, simpoolTE (https://github.com/jradrion/simpoolTE), to simulate the random insertion and deletion of a total of 25,000 TEs across chromosome 2R from the D. melanogaster reference (see Supplemental Materials and Methods). At 26X sequence coverage (equivalent coverage to our standardized pools from natural populations), TEFLoN produces a mean allele frequency deviation (±standard error) of 0.028 ± 0.001, 0.053 ± 0.001, and −0.010 ± 0.0005 for reference, non-reference, and fixed TEs, respectively (Figure S1). We also compared the accuracy of TE allele frequency estimates generated by TEFLoN for all classes of insertions and deletions (reference, non-reference, and fixed) together with those generated by two other software packages that genotype TEs in pooled data, PoPoolationTE2 (Kofler, Gómez-Sánchez, & Schlötterer, 2016) and TEMP (Zhuang, Wang, Theurkauf, & Weng, 2014). TEFLoN compared favorably to existing software with a mean allele frequency deviation (±standard error) of 0.019 ± 0.001 compared to −0.061 ± 0.002 and −0.021 ± 0.001 for PoPoolationTE2 and TEMP, respectively (Figure S2).
Genome-wide patterns of TE variation in Drosophila
We discovered significantly more TEs in D. melanogaster populations (89.4 per Mb) compared with D. simulans populations (50.3 per Mb), and this pattern was significant even after controlling for the excess of assembled heterochromatin in the D. melanogaster reference (W = 54; P = 4.0 x 10⁻⁴; Mann-Whitney U test). Furthermore, the pattern of elevated TE abundance in D. melanogaster is found across all major chromosome arms (W ≥ 51; PMWU < 4.0 x 10⁻⁴ for all comparisons; Figure 2). These results are largely consistent with the findings of Kofler et al (2015). However, in contrast to their results, we find that the difference in TE abundance between the species is largely driven by TEs at the lowest (≤ 0.1) and highest (> 0.9) allele frequencies, rather than being driven by TEs segregating at intermediate frequencies (Figure 1B, Figure S4). This distinction is potentially the result of major differences in sampling between our studies—Kofler et al (2015) collected more flies, but only from a single population—but might also reflect differences inherent to our different TE genotyping methods. For example, we find that PoPoolationTE2 tends to underestimate the allele frequency for fixed TEs relative to TEFLoN—producing a mean allele frequency deviation for fixed TEs of −0.11, compared to −0.01 for TEFLoN (Figure S2). It should be noted that Kofler et al. (2015) used PoPoolationTE and not PoPoolationTE2, but if these software packages have similar biases, some of the intermediate-frequency variants identified in Kofler et al (2015) may actually represent fixed TEs.
Figure 2.
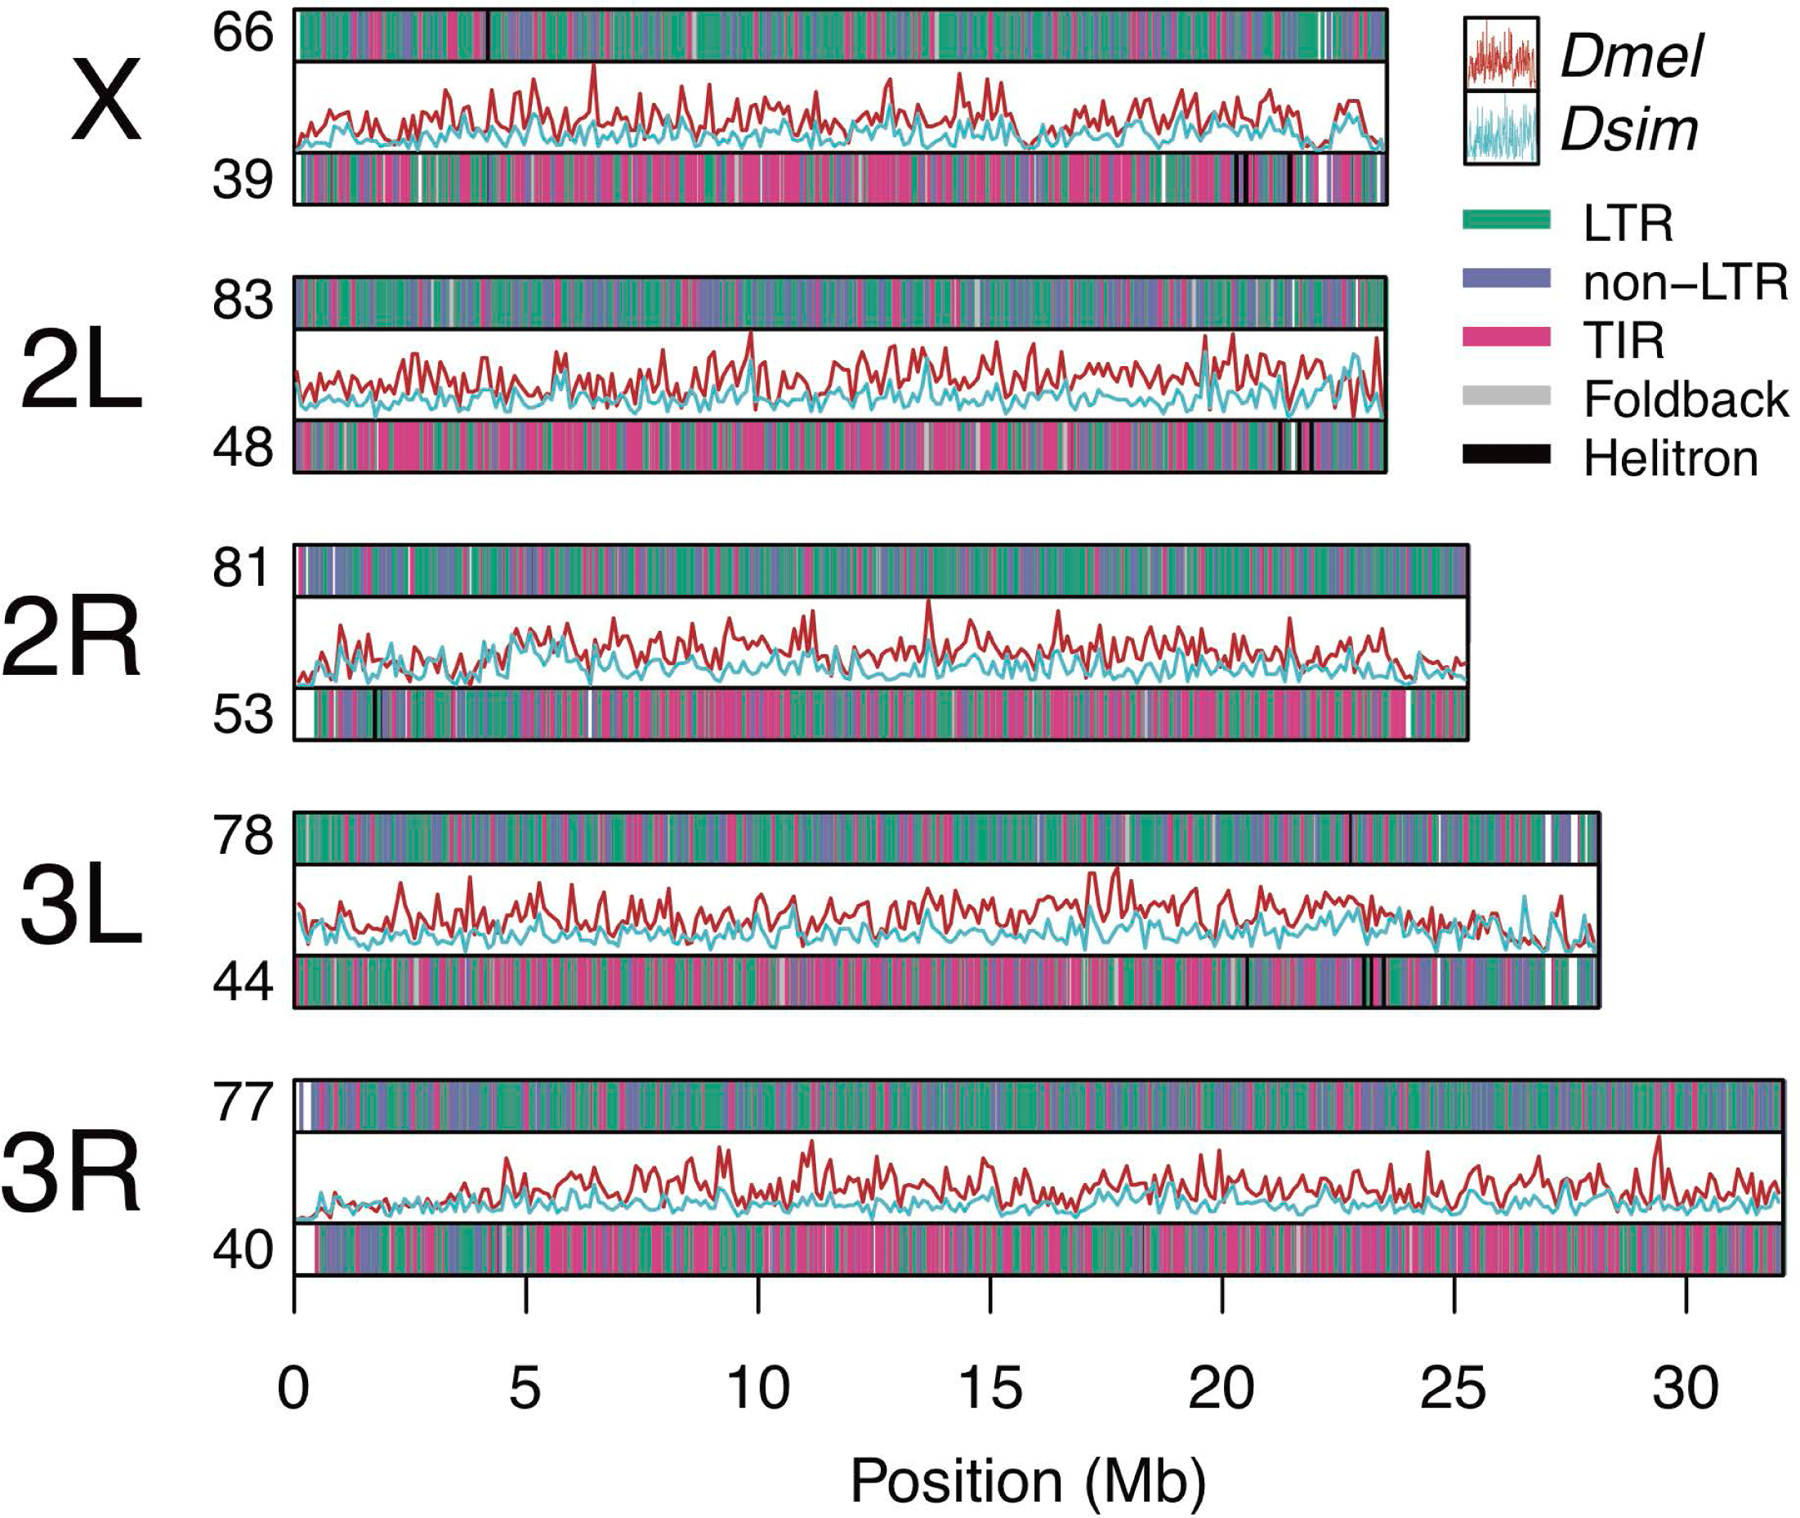
Distribution and density of TE orders in D. melanogaster (top bars, red lines) and D. simulans (bottom bars, blue lines) plotted along each of the five major chromosome arms in D. melanogaster. Counts of TEs on each chromosome arms are shown per megabase. TE densities (inner line graphs) are represented as counts per non-overlapping 100 kb windows. Only TEs present at alignable positions in both species are shown.
Similar to findings by Kofler et al. (2015), we find that insertion densities among TE orders [long terminal repeats (LTRs), non-LTRs, terminal inverted repeats (TIRs), helitron, and foldback] differ between species, with the overall abundance of both LTRs and non-LTRs being elevated (2.7- and 2.6-fold increase, respectively) in D. melanogaster relative to D. simulans (W = 54; PMWU = 0.002 for both comparisons; Figure 2). Allele frequencies are not significantly different among TE orders, with the exception of higher allele frequencies for helitrons (Figure S5), which is strongly driven by our decision to group INE-1 elements with this order. INE-1 represents a family of elements that has been thought to be inactive in D. melanogaster for millions of years (Kapitonov & Jurka, 2003), and they may only be distantly related to helitrons (Thomas & Pritham, 2015; Thomas, Vadnagara, & Pritham, 2014). We also tested for a correlation between TE abundance and library insert size, but found mixed results—library size is significantly correlated with TE abundance for D. simulans (R2 = 0.9, PLM < 2 x 10⁻¹⁶), but not in D. melanogaster (R2 = 0.005, PLM = 0.89; Figure S6).
As TE insertions are largely expected to be deleterious, we chose to explore the relationship between TEs and recombination rate in D. melanogaster (the species in which a high-quality recombination map is available). In doing so we found a significant effect of chromatin state on the relationship between TE allele frequency and recombination rate (PGLM < 2 x 10⁻¹⁶; Figure S7). When using euchromatin/heterochromatin boundaries from Cridland et al. (2013), the overall negative correlation with recombination rate disappears (PGLM = 0.998) when TEs in euchromatic and heterochromatic regions of the genome are considered separately (Figure S7). We also looked at the relationship between TE density (calculated as reference TEs annotated in FlyBase per 10 kb) and recombination rate. Similar to the patterns we observed in allele frequencies, the significant negative correlation between TE density and recombination rate is completely eliminated after controlling for TEs in heterochromatin (PGLM = 0.19; Figure S8). While heterochromatin is overrepresented among the lowest recombination regions, recombination in euchromatin spans the entire range of rates, including windows with effectively no crossing-over.
However, these patterns become increasingly complex depending on the exact boundaries used to define euchromatin and heterochromatin. For example, we do not observe the negative correlation with recombination rate disappearing when using chromatin boundaries reported in Lee and Karpen (2017)(Figure S9) or Filion et al. (2010)(Figure S10). Interestingly, the proportion of genome-wide TEs that are classified as heterochromatic differs dramatically among datasets, from < 5% using the boundaries from Lee and Kerpen (2017) to > 60% using the boundaries from Filion et al. (2010). Moreover, when we use multi-state chromatin maps based on empirically derived methylation profiles we observe wildly differing relationships depending on the particular methylation state (Figure S11). Together, these results suggest that chromatin state itself may be playing a role in the accumulation of TEs in these regions, a role often attributed to the reduced efficacy of selection in regions of lower recombination, or to a reduction in fitness costs for insertions in regions of lower gene density (Charlesworth & Charlesworth, 1983; Charlesworth & Langley, 1989; Fontanillas, Hartl, & Reuter, 2007; Rizzon, Marais, Gouy, & Biémont, 2002).
Ancestry clines in North American D. melanogaster
Genome-wide patterns of clinal variation may be caused by particular demographic histories, which could then be spuriously interpreted as selection (Bergland et al., 2016; Endler, 1977). It has recently been suggested that North America represents a zone of secondary contact for D. melanogaster, where high- and low-latitude populations are thought to have been independently founded by European- and African-derived populations, respectively (Bergland et al., 2016; Caracristi & Schlötterer, 2003; Kao, Zubair, Salomon, Nuzhdin, & Campo, 2015). Such a history could produce genome-wide patterns of clinality as the recent colonists started to mix at mid-latitudes. However, the selective sorting in the New World of alleles with histories of latitudinal variation in Old World populations could also generate clinal patterns in the New World: since African populations are low-latitude samples, the higher frequency of “African” alleles in low-latitude American population cannot by itself be used as evidence to distinguish between demographic and selective explanations for North American clines.
To assess the potential for recent secondary contact to affect our inferences, and to tease apart the ancestral sorting of alleles driven by selection from admixture, we compared the allele frequencies of TEs in North American D. melanogaster with flies from their reputed ancestral ranges. We used TEFLoN to discover and to estimate the allele frequency for TEs in European (Vienna) and African (Rwanda) populations of D. melanogaster, and compared this variation to populations in North America. Our results suggest that all North American populations are significantly more differentiated from African flies than they are from European flies (W = 36; PMWU = 0.002; Table S2), consistent with data on the differentiation of SNPs between these continents (Bergland et al., 2016; Kao et al., 2015; Pool, 2015).
We found evidence for a cline in FST for TEs between North American vs. Rwandan D. melanogaster (ρ = 0.83; P = 0.03; Figure 3A). This pattern is consistent regardless of whether we include TEs found in major cosmopolitan inversions in D. melanogaster (Figure S12A). However, the fraction of the variance in FST that is explained by latitude is extremely small (R2 = 0.0009). This cline in FST could be the result of admixture after secondary contact, but it could also be the result of a small number of locally adapted variants found in both the ancestral range and North America. To tease apart these scenarios, we tested another prediction from the admixture model: alleles that are rare in European samples and absent from African samples should be more common in high-latitude North American populations and should be absent in low-latitude populations. Similarly, rare alleles from Africa that are not found in Europe should be found at higher proportions in low-latitude North American populations and should be absent or in smaller numbers in high-latitude populations. This test should be especially useful when using TEs, as the vast majority of TEs are rare.
Figure 3.

A) Genetic differentiation (FST) between North American populations of D. melanogaster and populations sampled from Africa (Rwanda, green) and Europe (Vienna, white). B) Proportion of rare TEs [segregating at allele frequency ≤ 0.1 in Rwanda (green) or in Vienna (white)] that were discovered in each North American population of D. melanogaster. Error bars represent the standard errors of the means averaged among chromosomes X, 2L, 2R, 3L, and 3R.
Contrary to predictions from the admixture model, we found that the proportion of rare TEs (allele frequency ≤ 0.1) present in Vienna but absent in Rwanda is not significantly associated with latitude (ρ = 0.03; P = 0.5; Figure 3B). Likewise, the proportion of rare TEs present in Africa but absent in Europe does not significantly decrease with latitude (ρ = −0.6; P = 0.12; Figure 3B). This result, along with the extremely small degree to which variance in FST is explained by latitude, suggests that, at least for TEs, there is little evidence for a cline in ancestry due to admixture for North American populations of D. melanogaster. However, the patterns we observe could be the result of important differences between TEs and SNPs. For example, selection is expected to hold TEs at lower frequencies than SNPs (Barrón et al., 2014; Charlesworth & Langley, 1989), which could reduce our ability to capture within and among population variation.
We therefore set out to test for an ancestry cline using genome-wide SNPs in these same populations. We estimated the allele frequencies for all SNPs (excluding those in polymorphic inversions) and calculated FST using PoPoolation2 (Kofler et al., 2011). Similar to TEs, we found evidence for a weak cline in FST between SNPs from North American and Rwanda D. melanogaster (ρ = 0.83; P = 0.03; Figure S13A). However, yet again, the fraction of the variance in FST explained by latitude is exceedingly small for SNPs (R2 = 0.0037). It should also be noted that this correlation is strongly influenced by Panama, and no significant relationship exists when Panama is excluded (ρ = 0.7; P = 0.12). Moreover, we did not find evidence for a SNP cline in FST between North American vs. Viennese D. melanogaster (ρ = 0.14; P = 0.64; Figure S13A).
Once again, we tested a direct prediction from the ancestry model—that the proportion of rare SNPs found in Europe but not Africa (or vice versa) should correlate with latitude in North America. Consistent with our findings for TEs, we found that the proportion of rare SNPs (allele frequency ≤ 0.1) present in Vienna but absent in Rwanda is not significantly associated with latitude (ρ = −0.54; P = 0.88; Figure S13B). Finally, we found that the proportion of rare SNPs (allele frequency ≤ 0.1) present in Rwanda but absent in Vienna is also not significantly associated with latitude (ρ = −0.66; P = 0.09; Figure S13B). Taken together, these results cast doubt that there is an appreciable cline in ancestry in North American D. melanogaster, at least when using the Rwanda sample as representative of Africa.
Clinal variation of TEs in Drosophila
We looked for a correlation between latitude and TE abundance among our populations, as temperature has been shown to affect both transposition rates and TE copy-number (Paquin & Williamson, 1984; Vieira, Aubry, Lepetit, & Bie mont, 1998), and clines in TE abundance have been found to coincide with altitude in domesticated maize (Bilinski et al., 2018). However, we found no effect of latitude on TE abundance for either species (PGLM > 0.75, for both comparisons; Figure 4A). Additionally, we found no consistent differences in average TE allele frequencies from populations spanning the transect (Figure 4B). These results are consistent with similar rates of transposition activity along the transect, as well as similar modes of selection on TEs across latitudes. However, it should be mentioned that these particular tests would not capture TE-mediated selection that altered the abundances of TEs at both ends of the transect.
Figure 4.
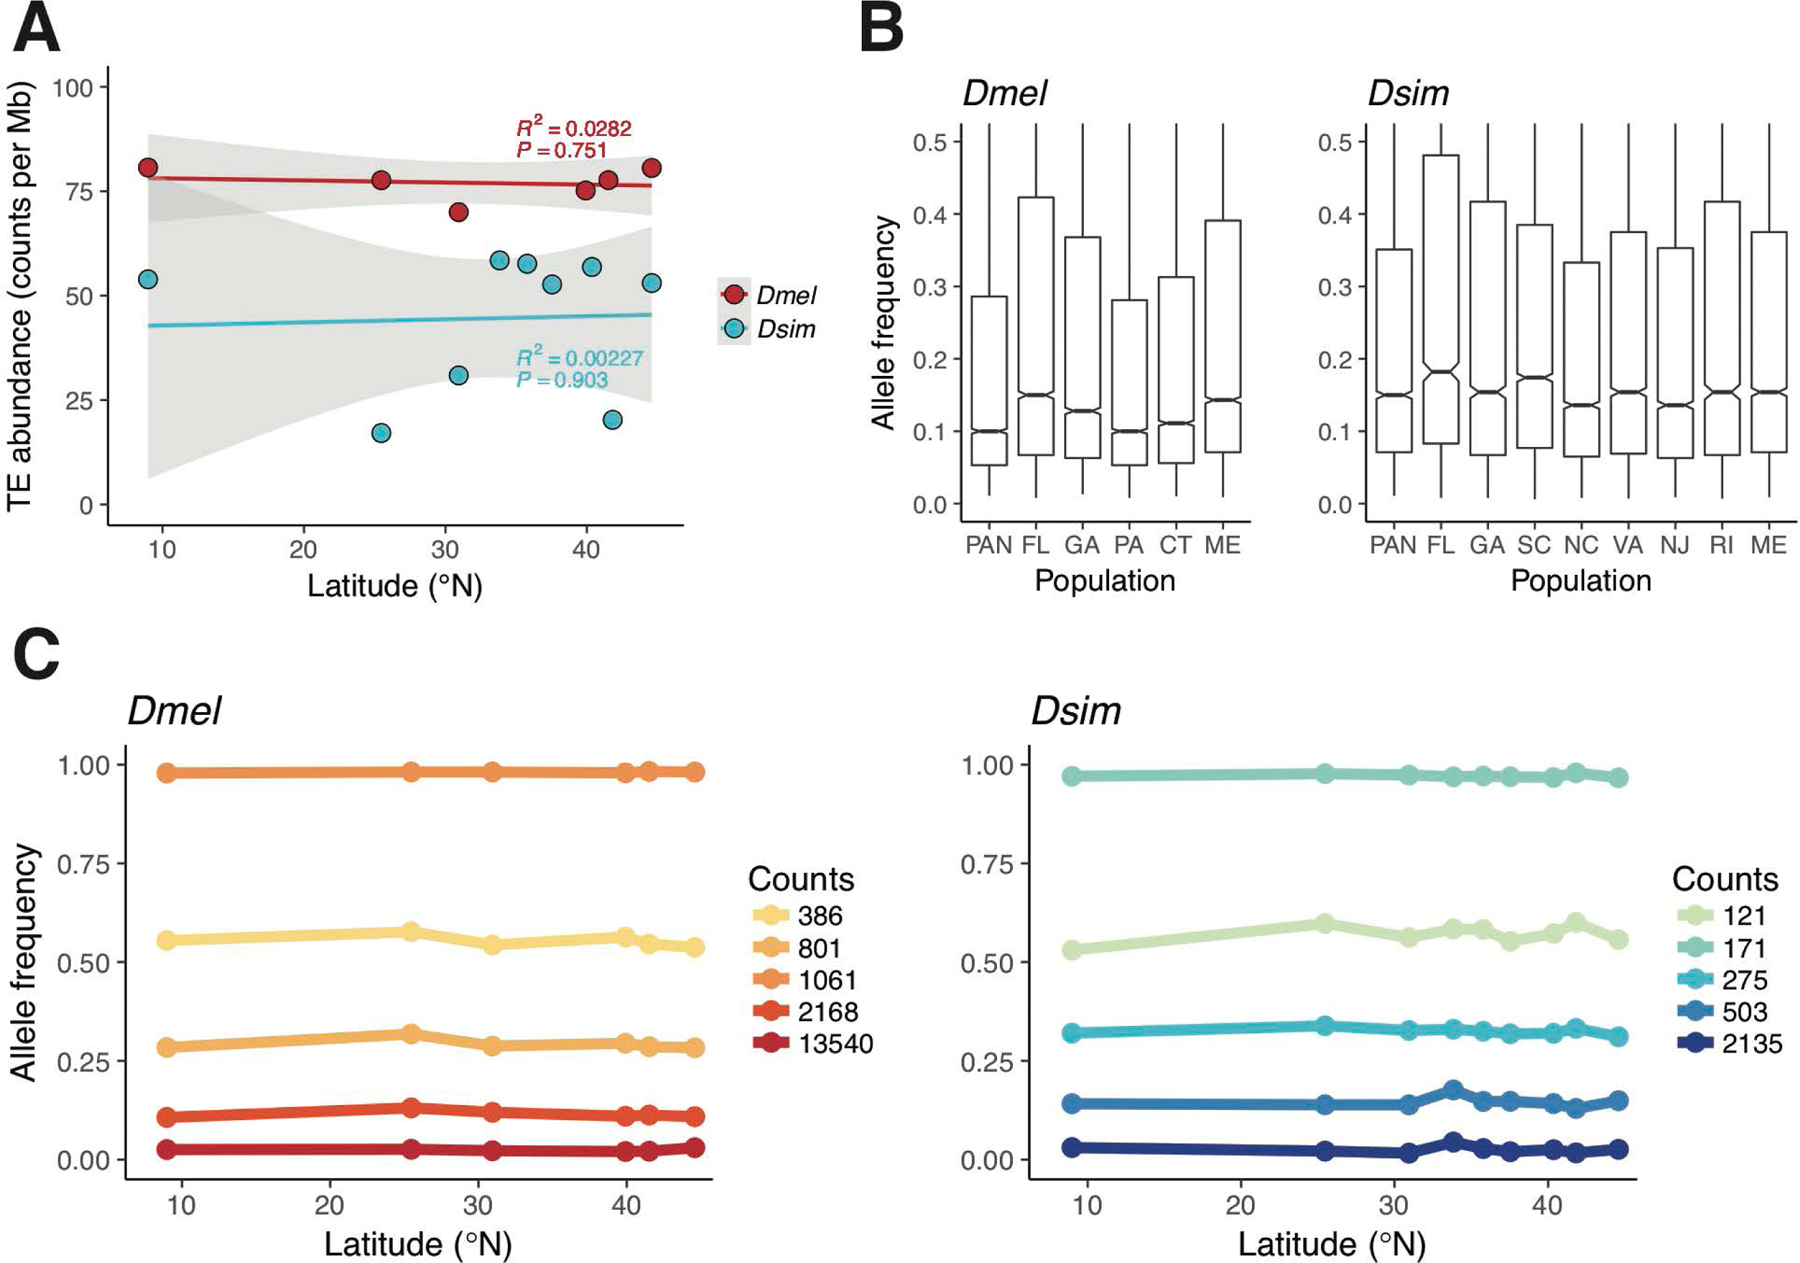
A) The relationship between TE abundance and latitude. R2 and P values are from the linear model of abundance on latitude for each species. Grey ribbons show 95% confidence intervals. B) Genome-wide TE allele frequencies for all populations. C) The five most common patterns of TE allele frequency variation in D. melanogaster (left) and D. simulans (right). Lines represent the clustered trajectory of TE allele frequency on latitude and points show the centroids for each cluster. Counts indicate the number of TEs that were clustered into each pattern.
Common patterns in allele frequency variation over geographic space can be informative about both the demographic processes or selective pressures influencing the genome (Endler, 1977, 1986). We refer to the line graph of allele frequency on latitude for a single TE as an allele frequency profile (AFP), and we constructed an AFP for every TE in the genome. To identify the most common patterns of allele frequency variation for TEs, we took a K-means clustering approach. Specifically, given AFPs for each TE at a specific genomic location in each population, we clustered these profiles into the most common patterns observed (see Supplemental Materials and Methods). We found that the five most common spatial patterns of TE allele frequency variation (in each species independently) are not clinal, but rather flat trajectories that do not steadily go up or down with latitude (Figure 4C). Because these flat trajectories may be disproportionately influenced by the mean allele frequencies of each cluster we also clustered TEs on cosine similarity, a measure of the similarity between the shape of these TE profiles, rather than the absolute allele frequencies at each latitude. We find that clustering on cosine similarity and increasing the number of clusters to K=8 produces a single cluster in D. melanogaster that exhibits slight clinality (Figure S14), which again suggests that only a small fraction of all TEs in the genome are clinal. Together these results suggest a relatively modest role for demography in shaping TE allele frequencies, and in conjunction with IBD results from SNPs in other studies (e.g. Machado et al., 2016), hint at a limited role for demography in shaping variation in Drosophila in North America.
Consistent with the largely deleterious effects of TEs on fitness, we find that the vast majority of TEs (> 75% in D. melanogaster and > 66% in D. simulans) are found in clusters representing low allele frequencies (< 0.1) and that the fraction of TEs segregating at intermediate frequencies (between 0.25 and 0.75) is quite small (6% in D. melanogaster and 12% in D. simulans; Figure 4C). This two-fold excess in the fraction of TEs segregating at intermediate frequencies in D. simulans is curious, as more efficacious selection against deleterious TEs is expected in D. simulans, given both its larger effective population size (Andolfatto, Wong, & Bachtrog, 2011; Aquadro, Jennings, Bland, Laurie, & Langley, 1992; Aquadro, Lado, & Noon, 1988) and higher recombination rate (Sturtevant, 1929; True, Mercer, & Laurie, 1996). Additionally, we did not find a deficit of TEs on the X chromosome relative to the autosomes in either species (P > 0.33 for both tests; Fisher’s exact test), which would be expected if there was an effect of recombination rate on the removal of TEs, as the X chromosome exhibits somewhat higher rates of recombination than the autosomes in D. melanogaster (Comeron et al., 2012). This result also suggests that TEs may not be recessive deleterious mutations on average.
To identify individual TEs that exhibit strong clinality, we regressed allele frequency in each population on latitude (See Supplemental Materials and Methods). Previous studies have shown stronger clinal patterns in D. melanogaster relative to D. simulans for both morphological traits and SNPs (reviewed in Gibert et al. 2004; Machado et al. 2016). To contrast the extent of clinal variation for TEs between these species, we compared the number of TEs that showed significant allele frequency associations with latitude across the genome. We found marginally more clinal TEs in D. melanogaster (6.6% at P ≤ 0.05) relative to D. simulans (5% at P ≤ 0.05; Figure S15A). This pattern is also consistent with marginally stronger IBD for TEs in D. melanogaster (r = 0.43; P = 0.04; Mantel test) relative to D. simulans (r = 0.29; P = 0.19; Mantel test; Figure S15B), as IBD will tend to generate clinal variation by its very nature (Vasemägi, 2006). Further, the pattern of stronger IBD in D. melanogaster remained after excluding all TEs found in cosmopolitan inversions (Figure S16), suggesting a limited role for inversions in shaping geographical patterns of TE variation. A similar pattern, showing both stronger clinality and stronger IBD in D. melanogaster relative to D. simulans, has previously been shown for genome-wide SNPs (Machado et al., 2016).
We defined clinal TE outliers as the top 2% of P-values (corresponding to an expected FDR of 80% for D. melanogaster and 91.8% for D. simulans) for the weighted linear regression of allele frequency on latitude. In total we identified 132 clinal TE outliers in D. melanogaster and 124 in D. simulans (Figure S17). We found that clinal TE outliers exhibit only modest differentiation between the endpoint populations in both species (Figure S18). Interestingly, we also found a strong asymmetry in the direction of clinality for these outliers from both D. melanogaster and D. simulans: the majority of outliers (67% and 77%, respectively) show a negative correlation between allele frequency and latitude (Figure S19). This asymmetry cannot be explained by inversions in D. melanogaster, as clinal TE outliers are not more likely to be found within cosmopolitan inversions than expected by chance (PFET = 0.67). Moreover, this asymmetry is not seen in FST outliers (top 2% of FST values) between Panama and Maine (Figure S20). Similar to the patterns we observed in TE abundance across the chromosomes, we did not find a difference between the number of clinal TE outliers on the X chromosome relative to the autosomes in either species (PFET > 0.28 for both tests).
Clinal outliers vs. FST outliers
Due to what was once the high cost of whole-genome sequencing, many previous studies interested in the targets of spatially varying selection in Drosophila relied on sampling only two distant points along an environmental gradient—for example, populations from Maine and Florida (e.g. Turner et al. 2008). To contrast inferences that might be drawn when sampling only two populations with those drawn when utilizing a denser sampling scheme along the entire environmental gradient, we compared the TEs identified as clinal outliers to those identified as FST outliers when examining only two populations. We found that the vast majority (> 91%) of FST outliers between Panama and Maine do not overlap with clinal outliers drawn from all populations spanning the same latitudinal gradient (Figure S21). However, given such a high expected FDR for clinal TEs, our expectation for the overlap between clinal outliers and FST outlier should be modest at best—e.g. if 100% of clinal outliers were false positives, we should expect no more concordance between clinal outliers and FST outliers than that produced by chance. Indeed, our results differ dramatically from studies looking at SNPs, where over 30% of FST outlier SNPs in D. melanogaster were shown to be clinal (Svetec, Cridland, Zhao, & Begun, 2016), potentially suggesting that TEs have a relatively smaller role in local adaptation when compared to SNPs. Interestingly, the distribution of FST values for outlier TEs does not differ dramatically from that of outlier SNPs—100% of our outlier TEs would have been classified as outliers using the FST thresholds from Svetec et al. (2016).
To further examine this pattern, we compared pairwise FST outlier TEs using different sets of endpoint populations spanning roughly similar latitudinal gradients—FL-PA versus GA-ME for D. melanogaster and FL-NJ versus GA-ME for D. simulans (see Figure 1). Here we found that the vast majority (> 94%) of pairwise FST outliers found using one set of endpoints does not overlap with FST outliers using a different set of endpoints (Figures 5 & S22). Moreover, we also found that a small fraction (1.2%) of the pairwise FST outliers that do overlap between sets of endpoints, do so with the signs of their allele frequency difference reversed. Together these results suggest that, while pairwise FST outlier TEs may be influenced by locally adapted variants, they do not necessarily relay information about adaptation to obvious underlying geographical or environmental gradients.
Figure 5.

Allele frequency profiles for all pairwise FST outliers (gray lines) between Florida and Pennsylvania (top left) and between Georgia and Maine (bottom left) for D. melanogaster, and between Florida and New Jersey (top right) and Georgia and Maine (bottom right) for D. simulans. Red lines highlight the overlap with clinal TE outliers, as calculated by their association with latitude. Only negative allele frequency differences are shown.
TEs and their proximity to functional regions of the genome
One important mechanism by which TEs can impact phenotypic variation is through the modulation of gene expression, possibly via their propensity to promote the spread of heterochromatin (Lee, 2015; Lee & Karpen, 2017). To test the hypothesis that TEs might be contributing to the differential expression of protein-coding genes in D. melanogaster, we compared the proximity of TEs in D. melanogaster to the top differentially expressed (DE) protein-coding genes sampled from whole male transcriptomes using the same samples from Panama and Maine (measured in Zhao et al. 2015). We find that the distance between DE genes and their nearest TE is significantly less than the distance between non-DE genes and their nearest TE (t=−3.31; P = 6.72 x 10⁻⁴; Welch’s t-test; Figure S23). However, pairwise FST is not different between TEs near DE genes relative to those neighboring non-DE genes (PWTT = 0.99), suggesting that while TEs may be influencing differential expression of some genes, it is unlikely that these differences are driven by local adaptation.
If clinal TE outliers represent true targets of selection via their influence on neighboring genes, we might also predict that clinal TE outliers would be closer in proximity to functional regions of the genome than non-clinal genes. However, we find that clinal TE outliers were no closer to protein-coding genes than non-clinal TEs (PWTT = 0.50; Figure S24). We did, however, identify a small number of clinal TE outliers that overlapped functionally important regions of the genome. One particular outlier of interest is an insertion of a LTR from the family 297 (te23639) into an intron in the gene nAchRα1 in D. melanogaster—a gene that has recently been implicated in insecticide resistance in this species (Somers, Luong, Mitchell, Batterham, & Perry, 2017). Further, nAchRα1 was among the genes exhibiting the greatest differential expression between D. melanogaster males from Panama and Maine (Zhao et al. 2015), and strongly clinal SNPs flank this particular TE [Bergland et al. (2014) data as reanalyzed in Svetec et al. (2016)], suggesting this TE might be a good candidate for additional functional annalyses.
Shared TEs between D. melanogaster and D. simulans
Comparing variation between closely related species living in similar environments can help to identify the effects of natural selection, as homologous traits may display parallel responses to similar underlying selection pressures (Endler, 1986). We used two confidence thresholds for detecting TEs shared between D. melanogaster and D. simulans (see Supplemental Materials and Methods; Figure S3), as limitations in discriminating precise TE breakpoints make it difficult to define true orthology. In general, we find very few orthologous TEs between D. melanogaster and D. simulans: 1.7% and 0.04% for low- and high-confidence shared TEs, respectively. Among our admittedly small set of 12 high-confidence shared TEs, we did not find a single clinal outlier or FST outlier. Among our set of 453 low-confidence shared TEs, we found 6 TEs (1.3%) that are both clinal TE outliers and FST outliers, which is not significantly more than expected given our outlier thresholds.
Discussion
Describing clinal variation, especially within the context of isolating the targets of spatially varying selection, has a rich history in Drosophila. Collecting flies from transects spanning North America, South America, and Australia has aided in the discovery of phenotypic clines for many traits (e.g. Azevedo, French, & Partridge, 1996; Cohan & Graf, 1985; James, Azevedo, & Partridge, 1995; P. S. Schmidt & Paaby, 2008; Svetec, Zhao, Saelao, Chiu, & Begun, 2015), while the advent of next-generation sequencing technology has led to the identification of genome-wide SNPs and CNVs differentiated between many of these same populations (Fabian et al., 2012; Kolaczkowski et al., 2011; Machado et al., 2016; Reinhardt et al., 2014; Schrider et al., 2013). In this report, we describe genome-wide patterns of TE variation in Drosophila sampled along a transect spanning much of North America—from Panama City, Panama to Maine, USA. We find little evidence for widespread clinality among TEs in Drosophila, though as we discuss below, this does not necessarily imply a limited role for TEs in clinally varying traits.
One potentially important cause of some of the clinal genetic variation found in natural populations is demography. Specifically, patterns of isolation-by-distance (IBD), driven by a balance between migration and drift, can generate clinal patterns. Simulation results suggest that there is a strong positive correlation between the strength of IBD and the proportion of loci displaying significant patterns of clinality (Vasemägi, 2006). Consistent with this prediction, we identified slightly more IBD for TEs in D. melanogaster relative to D. simulans accompanied by a slightly higher proportion of significantly clinal TEs in D. melanogaster relative to D. simulans (Figure S15–S16). This prediction is also consistent with results from genome-wide SNP variation in these same species, which show both stronger IBD and proportionally more clinal variation in D. melanogaster relative to D. simulans (Machado et al., 2016). It should be noted that the overall degree of IBD for both TEs and SNPs in these species is rather weak, suggesting a relatively minor role for IBD in producing clinal outliers.
A second driver of clinal variation may be admixture: this has the potential to generate clines after an influx of genetic variation from two differentiated source populations into opposite ends of a geographic transect. The admixture model additionally requires gene flow from the ends of the transect into the middle, so that a gradient of ancestry is formed (Caracristi & Schlötterer, 2003; Endler, 1977). Admixture has been hypothesized to be important for D. melanogaster from the East Coast of North America, as it has been suggested that these populations represent a zone of secondary contact—where an influx of alleles from Africa into the Caribbean occurred separately from the colonization of upper latitudes by European flies (Bergland et al., 2016; Kao et al., 2015). Importantly, we find little evidence for an ancestry cline driven by admixture among North American populations of D. melanogaster (Figure 3, Figures S12–S13). Our results may reflect differences between the types of statistics used for assessing ancestry—here we used FST and the proportion of shared low-frequency variants, rather than a model-based ancestry tool like ADMIXTURE (Alexander, Novembre, & Lange, 2009)—but our analysis using low-frequency TEs and SNPs is a direct test of a key prediction from the admixture model. Regardless, our results suggest that there should be little to no effect of ancestry on clinal patterns of TE variation in our study irrespective of the measure used to assess ancestry.
Overall, we find little evidence for widespread clinal variation of TEs in both D. melanogaster and D. simulans. One obvious reason for this result might simply be that TEs are not common targets of spatially varying selection in these species. While TEs have been found to underlie the genetic basis for environmental adaptation in a number of instances, many of these cases involve a TE disrupting the function of a gene that impacts insecticide resistance (Darboux et al., 2007; Magwire et al., 2011; J. M. Schmidt et al., 2010). This type of gene disruption may be expected to cause a sweep in the presence of insecticide, but it is unclear how such a mechanism could drive adaptation along a continuous fitness landscape, where intermediate populations could be locally adapted to some intermediate environmental condition. It is worth noting, however, that we did identify a clinal TE outlier that inserted into an intron of a gene recently been implicated in insecticide resistance (Somers et al., 2017).
A more plausible mechanism for an effect of TEs on clinal adaptation stems from their ability to module gene expression via the expansion of heterochromatin (Lee, 2015; Lee & Karpen, 2017). We tested whether TEs were in closer proximity to functional regions of the genome, but found that, while TEs were significantly closer to genes known to be highly differentially expressed, these TEs were not more differentiated than those neighboring non-DE genes (Figure S23). We also did not find evidence that clinal TEs were any closer to coding regions than non-clinal TEs (Figure S24). These results suggest that TEs may be affecting expression via a proximity effect, but that these differences are not likely to be driven by local adaptation for differential expression. It is also entirely possible, that we may have missed some significant patterns of clinal variation by generally treating TEs together, as a class of mutation. There are, of course, important biological and evolutionary differences between TE classes, and this is also true for different TE orders, TE superfamilies, and individual TE families. A more exhaustive search, one that specifically focuses on these differences, might come to highlight yet unseen ways that TEs are responding to spatially varying selection in these species.
The effect of TEs on the spread of heterochromatin and likewise, the effect of heterochromatin on TE population dynamics, prompted us to test another longstanding hypothesis about the association between TEs and recombination rate. Both TE density and TE allele frequency are predicted to show a negative relationship with recombination rate because regions of low recombination typically have lower gene densities and stronger Hill-Robertson effects, which reduce the efficacy of natural selection, relative to regions of high recombination (Barrón et al., 2014; Charlesworth & Langley, 1989). TE insertions in low-recombination regions are therefore expected to be less deleterious, but also, selection is expected to be less efficacious in removing them. However, recombination rate is often roughly correlated with chromatin state (see Kharchenko et al. 2011), and this relationship may obscure the true causes of TE dynamics. As expected, we found a significant negative correlation both between TE allele frequency and recombination rate and between TE density and recombination rate in D. melanogaster. However, both of these relationships completely disappeared after controlling for chromatin state using the boundaries from Cridland et al. (2013) (Figure S7; Figure S8), and displayed a range of patterns when different chromatin boundaries were used (Figures S9–S11). Together, these results suggest that the relationship between TEs, recombination, and chromatin state requires further investigation.
Recent evidence for the suppression of transposition, especially through piRNA-mediated epigenetic silencing (Lee, 2015), suggests the potential for biased TE recruitment into piRNA clusters—discrete genomic loci comprised of nested TE fragments that generate piRNA primary transcripts (Brennecke et al., 2007). The recruitment of TEs into piRNA clusters (many of which lie in heterochromatic regions) could be facilitated through heterochromatin binding proteins, such as Drosophila HP1 (reviewed in Vermaak & Malik, 2009) or its homolog, Rhino, that specifically binds piRNA clusters in D. melanogaster (Zhang et al., 2014). A similar integration preference has been observed in S. cerevisiae, where nearly all new Ty5 insertions occur in heterochromatin at the telomeres (Bushman, 2003), and this integration preference is driven by an interaction between the Ty5 integrase and a yeast heterochromatin binding protein (Xie et al., 2001; Zhu et al., 2003). Our results suggest that researchers may want to reevaluate other patterns previously ascribed to differences in recombination, as such differences may be confounded with structural elements like heterochromatin.
Lastly, we show that, at least for TEs in these populations, the vast majority of pairwise FST outliers are not significantly clinal (Figure S21). Likewise, the vast majority of FST outliers from one set of endpoints does not overlap with those outliers drawn from a different set of endpoints that span the same latitudinal distance (Figures 5 & S22). Importantly, our results do not invalidate candidate highly differentiated variants discovered in past studies. Previous studies using SNPs have shown over 30% of FST outliers are truly clinal (Svetec et al., 2016), suggesting that the role of SNPs in local adaptation may be more important than that of TEs. Moreover, previous studies also identified significant parallel differentiation between outliers from North America and outliers from Australia (Fabian et al., 2012; Kolaczkowski et al., 2011; Reinhardt et al., 2014; Schrider, Hahn, & Begun, 2016), and between gene expression outliers in D. melanogaster and D. simulans (Zhao et al., 2015), further strengthening the evidence that these outliers are targets of selection.
Our results potentially bring in to question the expectations for patterns of variation generated when loci respond to spatially varying selection across hundreds of kilometers. The commonly used expectation of a strict one-to-one correlation between geographic or environmental variables and allele frequency (i.e. a monotonic increase in allele frequency along a gradient) might not be reflective of the reality of clinal adaptation in many or most cases. For example, theoretical work from Barton (1999) hints at the importance of the local fixation of adaptive variants in contributing to genetic patterns of clinal selection in polygenic traits. In this model, adaptation along a continuously varying selection gradient—as opposed to the two-optimum model normally considered—results in the repeated fixation of alleles as one moves along the gradient, rather than a large number of alleles all increasing slowly in frequency together. If these theoretical predictions are generalizable to TEs, future attempts to identify TEs responding to spatially varying selection may want to focus on characterizing patterns of population-specific sweeps rather than clinal allele frequencies.
Our study is among the first to evaluate genome-wide patterns of TE variation along a continuous latitudinally varying transect in Drosophila. While we do not find strong evidence that TEs, taken together as a class of mutations, are crucial to responding to spatially varying selection in these species, we do highlight patterns of variation that contribute to our understanding of both differential TE dynamics between species and the unique demographic history of North American D. melanogaster. Understanding how spatially varying selection shapes genetic variation, and importantly TE variation, across the genome requires future research focused on analyzing genomic data in a spatial context. Going forward, it is imperative that we have clear expectations for the genomic patterns of targets of spatially varying selection, as only with reliable expectations can we be confident in our ability to elucidate the genetic basis for adaptation.
Supplementary Material
Acknowledgements
The authors would like to gratefully acknowledge Perot Saelao for the collection of D. simulans populations, and Paul Schmidt for sharing isofemale lines of D. melanogaster samples from Connecticut, Georgia, and Pennsylvania. We would also like to thank Marc Crepeau for generating the D. melanogaster libraries, Chuck Langley for sequencing them, and Alisa Sedghifar providing insight into patterns of D. simulans sequence variation. Claire Merot and four anonymous reviewers provided helpful feedback, as did Grace Lee. This work was supported by a National Science Foundation graduate research fellowship to J.R.A. and a National Institutes of Health R01 grant (GM110258) to D.J.B.
Footnotes
Supplemental Materials and Data Access
Supplemental Materials and Methods along with supplemental figures and tables will be deposited online at Molecular Ecology. All genomic data is deposited online at the SRA (accessions found in Supplemental Table S1) and the TE calls, along with code for running TEFLoN and PoPoolation2, are deposited in Dryad (https://doi.org/10.5061/dryad.h1542kr).
Disclosure Declaration
The authors declare no conflicts of interest.
Literature Cited
- Adrion JR, Hahn MW, & Cooper BS (2015). Revisiting classic clines in Drosophila melanogaster in the age of genomics. Trends in Genetics, 31(8), 434–444. doi: 10.1016/j.tig.2015.05.006 [DOI] [PMC free article] [PubMed] [Google Scholar]
- Adrion JR, Song MJ, Schrider DR, Hahn MW, & Schaack S (2017). Genome-wide estimates of transposable element insertion and deletion rates in Drosophila melanogaster. Genome Biology and Evolution, 9(5), 1329–1340. doi: 10.1093/gbe/evx050 [DOI] [PMC free article] [PubMed] [Google Scholar]
- Alexander DH, Novembre J, & Lange K (2009). Fast model-based estimation of ancestry in unrelated individuals. Genome Research, 19(9), 1655–1664. doi: 10.1101/gr.094052.109 [DOI] [PMC free article] [PubMed] [Google Scholar]
- Andolfatto P, Wong KM, & Bachtrog D (2011). Effective population size and the efficacy of selection on the X chromosomes of two closely related Drosophila species. Genome Biology and Evolution, 3(1), 114–128. doi: 10.1093/gbe/evq086 [DOI] [PMC free article] [PubMed] [Google Scholar]
- Aquadro CF, Jennings RM, Bland MM, Laurie CC, & Langley CH (1992). Patterns of naturally occurring restriction map variation, dopa decarboxylase activity variation and linkage disequilibrium in the DdC gene region of Drosophila melanogaster. Genetics, 132(2), 443–452. [DOI] [PMC free article] [PubMed] [Google Scholar]
- Aquadro CF, Lado KM, & Noon WA (1988). The rosy region of Drosophila melanogaster and Drosophila simulans. I. Contrasting levels of naturally occurring DNA restriction map variation and divergence. Genetics, 119(4), 875–888. [DOI] [PMC free article] [PubMed] [Google Scholar]
- Azevedo RBR, French V, & Partridge L (1996). Thermal evolution of egg size in Drosophila melanogaster. Evolution, 50(6), 2338–2345. [DOI] [PubMed] [Google Scholar]
- Barrón MG, Fiston-Lavier A-S, Petrov DA, & González J (2014). Population genomics of transposable elements in Drosophila. Annual Review of Genetics, 48(1), 561–81. doi: 10.1146/annurev-genet-120213-092359 [DOI] [PubMed] [Google Scholar]
- Barton NH (1999). Clines in polygenic traits. Genetical Research, 74(3), 223–236. doi: 10.1017/S001667239900422X [DOI] [PubMed] [Google Scholar]
- Bastide H, Betancourt A, Nolte V, Tobler R, Stöbe P, Futschik A, & Schlötterer C (2013). A genome-wide, fine-scale map of natural pigmentation variation in Drosophila melanogaster. PLoS Genetics, 9(6). doi: 10.1371/journal.pgen.1003534 [DOI] [PMC free article] [PubMed] [Google Scholar]
- Bergland AO, Behrman EL, O’Brien KR, Schmidt PS, & Petrov DA (2014). Genomic evidence of rapid and stable adaptive oscillations over seasonal time scales in Drosophila. PLoS Genetics, 10(11), e1004775. doi: 10.1371/journal.pgen.1004775 [DOI] [PMC free article] [PubMed] [Google Scholar]
- Bergland AO, Tobler R, González J, Schmidt P, & Petrov D (2016). Secondary contact and local adaptation contribute to genome-wide patterns of clinal variation in Drosophila melanogaster. Molecular Ecology, 25(5), 1157–1174. doi: 10.1111/mec.13455 [DOI] [PMC free article] [PubMed] [Google Scholar]
- Berry A, & Kreitman M (1993). Molecular analysis of an allozyme cline: Alcohol dehydrogenase in Drosophila melanogaster on the east coast of North America. Genetics, 134(3), 869–893. [DOI] [PMC free article] [PubMed] [Google Scholar]
- Bilinski P, Albert PS, Berg JJ, Birchler JA, Grote MN, Lorant A, … Ross-Ibarra J (2018). Parallel altitudinal clines reveal trends in adaptive evolution of genome size in Zea mays. PLOS Genetics, 14(5), e1007162. doi: 10.1371/journal.pgen.1007162 [DOI] [PMC free article] [PubMed] [Google Scholar]
- Brennecke J, Aravin AA, Stark A, Dus M, Kellis M, Sachidanandam R, & Hannon GJ (2007). Discrete small RNA-generating loci as master regulators of transposon activity in Drosophila. Cell, 128(6), 1089–103. doi: 10.1016/j.cell.2007.01.043 [DOI] [PubMed] [Google Scholar]
- Bushman FD (2003). Targeting survival: Integration site selection by retroviruses and LTR-retrotransposons. Cell, 115(2), 135–138. doi: 10.1016/S0092-8674(03)00760-8 [DOI] [PubMed] [Google Scholar]
- Caracristi G, & Schlötterer C (2003). Genetic differentiation between American and European Drosophila melanogaster populations could be attributed to admixture of African alleles. Molecular Biology and Evolution, 20(5), 792–799. doi: 10.1093/molbev/msg091 [DOI] [PubMed] [Google Scholar]
- Casacuberta E, & González J (2013). The impact of transposable elements in environmental adaptation. Molecular Ecology, 22(6), 1503–17. doi: 10.1111/mec.12170 [DOI] [PubMed] [Google Scholar]
- Charlesworth B, & Charlesworth D (1983). The population dynamics of transposable elements. Genetical Research, 42, 1–27. doi: 10.1017/S0016672300021455 [DOI] [Google Scholar]
- Charlesworth B, & Langley CH (1989). The population genetics of Drosophila transposable elements. Annual Review of Genetics, 23, 251–287. doi: 10.1146/annurev.genet.23.1.251 [DOI] [PubMed] [Google Scholar]
- Cohan FM, & Graf J-D (1985). Latitudinal cline in Drosophila melanogaster for knockdown resistance to ethanol fumes and for rates of response to selection for further resistance. Evolution, 39(2), 278–293. [DOI] [PubMed] [Google Scholar]
- Comeron JM, Ratnappan R, & Bailin S (2012). The many landscapes of recombination in Drosophila melanogaster. PLoS Genetics, 8(10), e1002905. doi: 10.1371/journal.pgen.1002905 [DOI] [PMC free article] [PubMed] [Google Scholar]
- Corbett-Detig RB, & Hartl DL (2012). Population genomics of inversion polymorphisms in Drosophila melanogaster. PLoS Genetics, 8(12), e1003056. doi: 10.1371/journal.pgen.1003056 [DOI] [PMC free article] [PubMed] [Google Scholar]
- Cridland JM, Macdonald SJ, Long AD, & Thornton KR (2013). Abundance and distribution of transposable elements in two Drosophila QTL mapping resources. Molecular Biology and Evolution, 30(10), 2311–27. doi: 10.1093/molbev/mst129 [DOI] [PMC free article] [PubMed] [Google Scholar]
- Cridland JM, Thornton KR, & Long AD (2014). Gene expression variation in Drosophila melanogaster due to rare transposable element insertion alleles of large effect. Genetics, 1–20. [DOI] [PMC free article] [PubMed] [Google Scholar]
- Daborn PJ (2002). A Single P450 Allele Associated with Insecticide Resistance in Drosophila. Science, 297(5590), 2253–2256. doi: 10.1126/science.1074170 [DOI] [PubMed] [Google Scholar]
- Darboux I, Charles JF, Pauchet Y, Warot S, & Pauron D (2007). Transposon-mediated resistance to Bacillus sphaericus in a field-evolved population of Culex pipiens (Diptera: Culicidae). Cellular Microbiology, 9(8), 2022–2029. doi: 10.1111/j.1462-5822.2007.00934.x [DOI] [PubMed] [Google Scholar]
- David JR, & Capy P (1988). Genetic variation of Drosophila melanogaster natural populations. Trends in Genetics, 4(4), 106–111. doi: 10.1016/0168-9525(88)90098-4 [DOI] [PubMed] [Google Scholar]
- dos Santos G, Schroeder AJ, Goodman JL, Strelets VB, Crosby MA, Thurmond J, … Gelbart WM (2015). FlyBase: introduction of the Drosophila melanogaster Release 6 reference genome assembly and large-scale migration of genome annotations. Nucleic Acids Research, 43(D1), D690–D697. doi: 10.1093/nar/gku1099 [DOI] [PMC free article] [PubMed] [Google Scholar]
- Endler JA (1977). Geographic variation, speciation, and clines. Princeton, New Jersey: Princeton University Press. [PubMed] [Google Scholar]
- Endler JA (1986). Natural selection in the wild. Princeton, New Jersey: Princeton University Press. [Google Scholar]
- Fabian DK, Kapun M, Nolte V, Kofler R, Schmidt PS, Schlötterer C, & Flatt T (2012). Genome-wide patterns of latitudinal differentiation among populations of Drosophila melanogaster from North America. Molecular Ecology, 21(19), 4748–69. doi: 10.1111/j.1365-294X.2012.05731.x [DOI] [PMC free article] [PubMed] [Google Scholar]
- Filion GJ, van Bemmel JG, Braunschweig U, Talhout W, Kind J, Ward LD, … van Steensel B (2010). Systematic Protein Location Mapping Reveals Five Principal Chromatin Types in Drosophila Cells. Cell, 143(2), 212–224. doi: 10.1016/j.cell.2010.09.009 [DOI] [PMC free article] [PubMed] [Google Scholar]
- Fontanillas P, Hartl DL, & Reuter M (2007). Genome organization and gene expression shape the transposable element distribution in the Drosophila melanogaster euchromatin. PLoS Genetics, 3(11), 2256–2267. doi: 10.1371/journal.pgen.0030210 [DOI] [PMC free article] [PubMed] [Google Scholar]
- Gibert P, Capy P, Imasheva A, Moreteau B, Morin JP, Petavy G, & David JR (2004). Comparative analysis of morphological traits among Drosophila melanogaster and D. simulans: genetic variability, clines and phenotypic plasticity. Genetica, 120(1–3), 165–179. doi: 10.1023/B:GENE.0000017639.62427.8b [DOI] [PubMed] [Google Scholar]
- González J, Karasov TL, Messer PW, & Petrov DA (2010). Genome-wide patterns of adaptation to temperate environments associated with transposable elements in Drosophila. PLoS Genetics, 6(4), e1000905. doi: 10.1371/journal.pgen.1000905 [DOI] [PMC free article] [PubMed] [Google Scholar]
- Hof A. E. V. t., Campagne P, Rigden DJ, Yung CJ, Lingley J, Quail MA, … Saccheri IJ (2016). The industrial melanism mutation in British peppered moths is a transposable element. Nature, 534(7605), 102–105. doi: 10.1038/nature17951 [DOI] [PubMed] [Google Scholar]
- Hoffmann AA, & Weeks AR (2007). Climatic selection on genes and traits after a 100 year-old invasion: a critical look at the temperate-tropical clines in Drosophila melanogaster from eastern Australia. Genetica, 129(2), 133–47. doi: 10.1007/s10709-006-9010-z [DOI] [PubMed] [Google Scholar]
- James AC, Azevedo RBR, & Partridge L (1995). Cellular basis and developmental timing in a size cline of Drosophila melanogaster. Genetics, 140, 659–666. doi: 10.1016/j.virol.2010.06.023 [DOI] [PMC free article] [PubMed] [Google Scholar]
- Kao JY, Zubair A, Salomon MP, Nuzhdin SV, & Campo D (2015). Population genomic analysis uncovers African and European admixture in Drosophila melanogaster populations from the south-eastern United States and Caribbean Islands. Molecular Ecology, 24(7), 1499–1509. doi: 10.1111/mec.13137 [DOI] [PubMed] [Google Scholar]
- Kapitonov VV, & Jurka J (2003). Molecular paleontology of transposable elements in the Drosophila melanogaster genome. Proceedings of the National Academy of Sciences, 100(11), 6569–74. doi: 10.1073/pnas.0732024100 [DOI] [PMC free article] [PubMed] [Google Scholar]
- Kharchenko PV, Alekseyenko AA, Schwartz YB, Minoda A, Riddle NC, Ernst J, … Park PJ (2011). Comprehensive analysis of the chromatin landscape in Drosophila melanogaster. Nature, 471(7339), 480–485. doi: 10.1038/nature09725 [DOI] [PMC free article] [PubMed] [Google Scholar]
- Kofler R, Gómez-Sánchez D, & Schlötterer C (2016). PoPoolationTE2: Comparative Population Genomics of Transposable Elements Using Pool-Seq. Molecular Biology and Evolution, 33(10), 2759–2764. doi: 10.1093/molbev/msw137 [DOI] [PMC free article] [PubMed] [Google Scholar]
- Kofler R, Nolte V, & Schlötterer C (2015). Tempo and mode of transposable element activity in Drosophila. PLOS Genetics, 11(7), e1005406. doi: 10.1371/journal.pgen.1005406 [DOI] [PMC free article] [PubMed] [Google Scholar]
- Kofler R, Pandey RV, & Schlötterer C (2011). PoPoolation2: Identifying differentiation between populations using sequencing of pooled DNA samples (Pool-Seq). Bioinformatics, 27(24), 3435–3436. doi: 10.1093/bioinformatics/btr589 [DOI] [PMC free article] [PubMed] [Google Scholar]
- Kolaczkowski B, Kern AD, Holloway AK, & Begun DJ (2011). Genomic differentiation between temperate and tropical Australian populations of Drosophila melanogaster. Genetics, 187(1), 245–60. doi: 10.1534/genetics.110.123059 [DOI] [PMC free article] [PubMed] [Google Scholar]
- Lachaise D, Cariou M-L, David JR, Lemeunier F, Tsacas L, & Ashburner M (1988). Historical biogeography of the Drosophila melanogaster species subgroup. In Evolutionary Biology (22nd ed., pp. 159–225). [Google Scholar]
- Lee YCG (2015). The role of piRNA-mediated epigenetic silencing in the population dynamics of transposable elements in Drosophila melanogaster. PLOS Genetics, 11(6), e1005269. doi: 10.1371/journal.pgen.1005269 [DOI] [PMC free article] [PubMed] [Google Scholar]
- Lee YCG, & Karpen GH (2017). Pervasive epigenetic effects of Drosophila euchromatic transposable elements impact their evolution. ELife, 6, 1–31. doi: 10.7554/eLife.25762 [DOI] [PMC free article] [PubMed] [Google Scholar]
- Li H, & Durbin R (2009). Fast and accurate short read alignment with Burrows-Wheeler transform. Bioinformatics, 25(14), 1754–60. doi: 10.1093/bioinformatics/btp324 [DOI] [PMC free article] [PubMed] [Google Scholar]
- Machado HE, Bergland AO, O’Brien KR, Behrman EL, Schmidt PS, & Petrov DA (2016). Comparative population genomics of latitudinal variation in Drosophila simulans and Drosophila melanogaster. Molecular Ecology, 25(3), 723–740. doi: 10.1111/mec.13446 [DOI] [PMC free article] [PubMed] [Google Scholar]
- Magwire MM, Bayer F, Webster CL, Cao C, & Jiggins FM (2011). Successive increases in the resistance of Drosophila to viral infection through a transposon insertion followed by a duplication. PLoS Genetics, 7(10), e1002337. doi: 10.1371/journal.pgen.1002337 [DOI] [PMC free article] [PubMed] [Google Scholar]
- Paquin CE, & Williamson VM (1984). Temperature effects on the rate of Ty transposition. Science, 226(4670), 53–55. doi: 10.1126/science.226.4670.53 [DOI] [PubMed] [Google Scholar]
- Pool JE (2015). The mosaic ancestry of the Drosophila genetic reference panel and the D. melanogaster reference genome reveals a network of epistatic fitness interactions. Molecular Biology and Evolution, 32(12), 3236–3251. doi: 10.1093/molbev/msv194 [DOI] [PMC free article] [PubMed] [Google Scholar]
- Reinhardt JA, Kolaczkowski B, Jones CD, Begun DJ, & Kern AD (2014). Parallel geographic variation in Drosophila melanogaster. Genetics, 197(1), 361–73. doi: 10.1534/genetics.114.161463 [DOI] [PMC free article] [PubMed] [Google Scholar]
- Riddle NC, Minoda a., Kharchenko PV, Alekseyenko a. a., Schwartz YB, Tolstorukov MY, … Karpen GH (2011). Plasticity in patterns of histone modifications and chromosomal proteins in Drosophila heterochromatin. Genome Research, 21(2), 147–163. doi: 10.1101/gr.110098.110 [DOI] [PMC free article] [PubMed] [Google Scholar]
- Rizzon C, Marais G, Gouy M, & Biémont C (2002). Recombination rate and the distribution of transposable elements in the Drosophila melanogaster genome. Genome Research, 12, 400–407. doi: 10.1101/gr.210802. [DOI] [PMC free article] [PubMed] [Google Scholar]
- Schlenke TA, & Begun DJ (2004). Strong selective sweep associated with a transposon insertion in Drosophila simulans. Proceedings of the National Academy of Sciences, 101(6), 1626–1631. doi: 10.1073/pnas.0303793101 [DOI] [PMC free article] [PubMed] [Google Scholar]
- Schmidt JM, Good RT, Appleton B, Sherrard J, Raymant GC, Bogwitz MR, … Robin C (2010). Copy number variation and transposable elements feature in recent, ongoing adaptation at the Cyp6g1 locus. PLoS Genetics, 6(6), e1000998. doi: 10.1371/journal.pgen.1000998 [DOI] [PMC free article] [PubMed] [Google Scholar]
- Schmidt PS, & Paaby AB (2008). Reproductive diapause and life-history clines in North American populations of Drosophila melanogaster. Evolution, 62(5), 1204–1215. doi: 10.1111/j.1558-5646.2008.00351.x [DOI] [PubMed] [Google Scholar]
- Schrader L, Kim JW, Ence D, Zimin A, Klein A, Wyschetzki K, … Oettler J (2014). Transposable element islands facilitate adaptation to novel environments in an invasive species. Nature Communications, 5, 1–10. doi: 10.1038/ncomms6495 [DOI] [PMC free article] [PubMed] [Google Scholar]
- Schrider DR, Begun DJ, & Hahn MW (2013). Detecting highly differentiated copy-number variants from pooled population sequencing. Pacific Symposium on Biocomputing, 18, 334–355. [PMC free article] [PubMed] [Google Scholar]
- Schrider DR, Hahn MW, & Begun DJ (2016). Parallel evolution of copy-number variation across continents in Drosophila melanogaster. Molecular Biology and Evolution, msw014. doi: 10.1093/molbev/msw014 [DOI] [PMC free article] [PubMed] [Google Scholar]
- Sedghifar A, Saelao P, & Begun D (2016). Genomic patterns of geographic differentiation in Drosophila simulans. Genetics, 202(3), 1229–1240. doi: 10.1534/genetics.115.185496 [DOI] [PMC free article] [PubMed] [Google Scholar]
- Somers J, Luong HNB, Mitchell J, Batterham P, & Perry T (2017). Pleiotropic effects of loss of the Dα1 subunit in Drosophila melanogaster: Implications for insecticide resistance. Genetics, 205(1), 263–271. doi: 10.1534/genetics.116.195750 [DOI] [PMC free article] [PubMed] [Google Scholar]
- Sturtevant AH (1929). The genetics of Drosophila simulans. Carnegie Institute Washington Publishing. [Google Scholar]
- Svetec N, Cridland JM, Zhao L, & Begun DJ (2016). The adaptive significance of natural genetic variation in the DNA damage response of Drosophila melanogaster. PLOS Genetics, 12(3), e1005869. doi: 10.1371/journal.pgen.1005869 [DOI] [PMC free article] [PubMed] [Google Scholar]
- Svetec N, Zhao L, Saelao P, Chiu JC, & Begun DJ (2015). Evidence that natural selection maintains genetic variation for sleep in Drosophila melanogaster. BMC Evolutionary Biology, 15(41), doi: 10.1186/s12862-015-0316-2. doi: 10.1186/s12862-015-0316-2 [DOI] [PMC free article] [PubMed] [Google Scholar]
- Thomas J, & Pritham EJ (2015). Helitrons, the eukaryotic rolling-circle transposable elements. Microbiology Spectrum, 3(4), 1–32. doi: 10.1128/microbiolspec.MDNA3-0049-2014 [DOI] [PubMed] [Google Scholar]
- Thomas J, Vadnagara K, & Pritham EJ (2014). DINE-1, the highest copy number repeats in Drosophila melanogaster are non-autonomous endonuclease-encoding rolling-circle transposable elements (Helentrons). Mobile DNA, 5(1), 18. doi: 10.1186/1759-8753-5-18 [DOI] [PMC free article] [PubMed] [Google Scholar]
- True JR, Mercer JM, & Laurie CC (1996). Differences in crossover frequency and distribution among three sibling species of Drosophila. Genetics, 142(2), 507–523. [DOI] [PMC free article] [PubMed] [Google Scholar]
- Turner TL, Levine MT, Eckert ML, & Begun DJ (2008). Genomic analysis of adaptive differentiation in Drosophila melanogaster. Genetics, 179(1), 455–73. doi: 10.1534/genetics.107.083659 [DOI] [PMC free article] [PubMed] [Google Scholar]
- Ullastres A, Petit N, & González J (2015). Exploring the phenotypic space and the evolutionary history of a natural mutation in Drosophila melanogaster. Molecular Biology and Evolution, 32(7), 1800–1814. doi: 10.1093/molbev/msv061 [DOI] [PMC free article] [PubMed] [Google Scholar]
- Vasemägi A (2006). The adaptive hypothesis of clinal variation revisited: single-locus clines as a result of spatially restricted gene flow. Genetics, 173(4), 2411–4. doi: 10.1534/genetics.106.059881 [DOI] [PMC free article] [PubMed] [Google Scholar]
- Vermaak D, & Malik HS (2009). Multiple roles for heterochromatin protein 1 genes in Drosophila. Annual Review of Genetics, 43(1), 467–492. doi: 10.1146/annurev-genet-102108-134802 [DOI] [PubMed] [Google Scholar]
- Verrelli BC, & Eanes WF (2001). Clinal variation for amino acid polymorphisms at the Pgm locus in Drosophila melanogaster. Genetics, 157(4), 1649–1663. [DOI] [PMC free article] [PubMed] [Google Scholar]
- Vieira C, Aubry P, Lepetit D, & Bie mont C (1998). A temperature cline in copy number for 412 but not roo/B104 retrotransposons in populations of Drosophila simulans. Proceedings of the Royal Society B, 265(1402), 1161–1165. doi: 10.1098/rspb.1998.0413 [DOI] [PMC free article] [PubMed] [Google Scholar]
- Xie W, Gai X, Zhu Y, Zappulla DC, Sternglanz R, & Voytas DF (2001). Targeting of the yeast Ty5 retrotransposon to silent chromatin is mediated by interactions between integrase and Sir4p. Molecular and Cellular Biology, 21(19), 6606–6614. doi: 10.1128/MCB.21.19.6606-6614.2001 [DOI] [PMC free article] [PubMed] [Google Scholar]
- Zhang Z, Wang J, Schultz N, Zhang F, Parhad SS, Tu S, … Theurkauf WE (2014). The HP1 homolog Rhino anchors a nuclear complex that suppresses piRNA precursor splicing. Cell, 157(6), 1353–1363. doi: 10.1016/j.cell.2014.04.030 [DOI] [PMC free article] [PubMed] [Google Scholar]
- Zhao L, Wit J, Svetec N, & Begun D (2015). Parallel gene expression differences between low and high latitude populations of Drosophila melanogaster and D. simulans. PLoS Genetics, 11(5), e1005184. doi: 10.1371/journal.pgen.1005184 [DOI] [PMC free article] [PubMed] [Google Scholar]
- Zhu Y, Dai J, Fuerst PG, & Voytas DF (2003). Controlling integration specificity of a yeast retrotransposon. Proceedings of the National Academy of Sciences, 100(10), 5891–5895. doi: 10.1073/pnas.1036705100 [DOI] [PMC free article] [PubMed] [Google Scholar]
- Zhuang J, Wang J, Theurkauf W, & Weng Z (2014). TEMP: a computational method for analyzing transposable element polymorphism in populations. Nucleic Acids Research, 42(11), 6826–38. doi: 10.1093/nar/gku323 [DOI] [PMC free article] [PubMed] [Google Scholar]
Associated Data
This section collects any data citations, data availability statements, or supplementary materials included in this article.