

Abstract
Background.
The distribution of Clostridioides difficile strains and transmission dynamics in the United States are not well defined. Whole-genome sequencing across 2 Centers for Disease Control and Prevention Emerging Infections Program C. difficile infection (CDI) surveillance regions (Minnesota and New York) was performed to identify predominant multilocus sequence types (MLSTs) in community-associated (CA) and healthcare-associated (HCA) disease and assess transmission.
Methods.
Whole-genome sequencing was performed on C. difficile isolates from patients with CDI over 3 months between 2016 and 2017. Patients were residents of the catchment area without a positive C. difficile test in the preceding 8 weeks. CDI cases were epidemiologically classified as HCA or CA.
Results.
Of 422 isolates, 212 (50.2%) were HCA and 203 (48.1%) were CA. Predominant MLSTs were sequence type (ST) 42 (9.3%), ST8 (7.8%), and ST2 (8.1%). MLSTs associated with HCA-CDI included ST1 (76%), ST53 (83.3%), and ST43 (80.0%), while those associated with CA-CDI included ST3 (76.9%) and ST41 (77.8%). ST1 was more frequent in New York than in Minnesota (10.8% vs 3.1%). Thirty-three pairs were closely related genomically, 14 of which had potential patient-to-patient transmission supported by record review.
Conclusions.
The genomic epidemiology of C. difficile across 2 regions of the United States indicates the presence of a diverse strain profile and limited direct transmission.
Keywords: Clostridioides difficile, whole-genome sequencing, MLST, transmission, NAP1
Clostridioides difficile infection (CDI) is a major cause of disease and death [1]. The most recent national data indicate that there were nearly half million cases of CDI annually in the United States [2], with an estimated 223 900 cases occurring in hospitalized patients, leading to 12 800 deaths and $1 billion in directly attributable healthcare costs [3].
CDI first rose to prominence as a leading cause of hospital-associated infections in the mid-2000s in association with the emergence of an epidemic strain known as NAP1/RT027, or as multilocus sequence type (MLST) or sequence type (ST) 1 [4]. After peaking around 2010–2013, at which time it accounted for >40% of CDI in some regions [5, 6], the incidence of ST1 began to decrease [7–9]. Subsequently, the overall incidence of CDI has also declined, mainly driven by a reduction in healthcare-associated (HCA) disease [2, 10–12], although the proportion of community-associated (CA) CDI has increased.
The most recent (2017) national surveillance data from the Centers for Disease Control and Prevention Emerging Infections Program shows that ST1/NAP1/RT027 accounts for 15% of HCA and 6% of CA C. difficile isolates in the United States [13]. Data from the peak of ST1/NAP1/RT027 prevalence demonstrate that approximately 40% of HCA-CDI could be the result of direct transmission from another individual [14]. Similarly, in a large study of >1000 isolates from both community and hospital cases, 35% of cases were highly genetically related to other cases, although only 38% had obvious hospital contact [15].
Other increasingly prominent ribotypes implicated in HCA-CDI and CA-CDI include RT106, RT002, and RT014/076/020 [13], generally corresponding to ST42, ST8, and ST2/ST14 [16]. Much less is known about the transmission potential and reservoirs of other ribotypes/STs. Furthermore, the degree and nature of transmission among CA cases, as well as their interplay with institutional transmission chains, is poorly understood. In the current study, we performed whole-genome sequencing (WGS) of C. difficile isolates collected across 2 Emerging Infections Program surveillance regions (New York and Minnesota) to identify the predominant MLSTs and potential transmission among both CA-CDI and HCA-CDI cases.
METHODS
Case Selection and Definition
Population-based CDI surveillance was conducted in Monroe County, New York (population 747 727), and in Benton, Morrison, Olmsted, Stearns, and Todd Counties in Minnesota (population 400 397) (Table 1). An incident CDI case was defined as a positive C. difficile test on a specimen from a catchment-area resident ≥1 year of age with no positive test result in the previous 8 weeks [16]. Medical records were reviewed, and the information collected was used to classify cases into 4 epidemiological classifications: (1) hospital-onset (HO) (positive specimen collected ≥4 days after hospital admission); (2) long-term care facility onset (LTCO) (positive specimen collected in a LTCF or ≤3 days after a LTCF resident was transferred to a hospital); (3) community-onset–healthcare facility–associated (CO-HCFA) (positive specimen collected in the community or ≤3 days after hospital admission in a person with an overnight stay in a healthcare facility in the prior 12 weeks); and (4) CA (positive specimen collected in the community or ≤3 days after hospital admission in a person with no overnight stay in a healthcare facility in the prior 12 weeks). The HCA category includes HO, LTCO, and CO-HCFA. The project underwent ethical review and approval by the University of Rochester and Rochester Regional Health System and was exempted by the Minnesota Department of Health Intuitional Review Board.
Table 1.
Characteristics of Clostridioides difficile Infection Surveillance Sites
| Characteristic | New York | Minnesota |
|---|---|---|
| Population under surveillance | 747 727 | 400 397 |
| CDI rate during 3-mo surveillance per 100 000 population | 44.13 | 52.70 |
| Healthcare facilities, no. | ||
| Hospitals | 4 | 6 |
| LTCFs | 33 | 14 |
| Critical access hospitals | 0 | 8 |
Abbreviations: CDI, Clostridioides difficile infection; LTCFs, long-term care facilities.
Culture and Sequencing
Of 542 incident CDI cases that occurred during the 3-month study period in New York (September–November 2016) and Minnesota (June–August 2017), C. difficile was isolated and sequenced from cultures of 422 stool specimens (Table 2). Isolates were cultured anaerobically on a prereduced taurocholate-cefoxitin-cycloserine-fructose agar plate for 48–72 hours before subculture and identification, using a Bruker matrix-assisted laser desorption ionization–time-of-flight (MALDI-TOF) mass spectrometer. DNA was extracted with the QIAamp BiOstic Bacteremia DNA Kit (Qiagen catalog no. 12240–50) and quantified with a Qubit Fluorometer or SpectraMax plate reader. Libraries were prepared using the Illumina Nextera XT kit before sequencing on an Illumina Miseq platform (250–base pair paired-end reads). Data was deposited under BioProject PRJNA659471.
Table 2.
Incidence of Clostridioides difficile Infection and Characteristics of Patients With Sequenced C. difficile Isolates, by Site
| Characteristic | New York | Minnesota |
|---|---|---|
| CDI incident cases, no. | 330 | 212 |
| Total isolates sequenced, no. (%) | 260 (70) | 162 (76) |
| Patient demographics | n = 260 | n = 162 |
| Age, median (IQR), y | 65 (51–75) | 58 (40–71) |
| Female sex, no. (%) | 161 (62) | 104 (64) |
| Epidemiological classification, no. (%) | n = 260 | n = 162 |
| CA | 103 (40) | 100 (62) |
| HO | 68 (26) | 16 (10) |
| CO-HCFA | 58 (22) | 31 (19) |
| LTCO | 30 (11) | 9 (5) |
| Unknown | 1 (0.3) | 6 (4) |
| Total HCAb | 156 (60) | 56 (34) |
Abbreviations: CA, community associated; CO-HCFA, community onset–healthcare facility associated; HCA, healthcare associated; HO, hospital onset; IQR, interquartile range; LTCO, long-term care facility onset.
Isolates with some sequence data.
Sum of HO, CO-HCFA, and LTCF.
Sequence Analysis
Raw reads were trimmed (Trimmomatic software; version 0.36 [17]) to remove bases with a Phred score <20. Raw reads were assembled with SPAdes software (version 3.11.1) [18]. MLSTs were determined as described elsewhere (pubmlst. org). Whole-genome single-nucleotide polymorphism (SNP) calling was done using the Center for Food Safety and Applied Nutrition version 1.0.0 pipeline (default settings) [19]. The maximum number of core SNPs between 2 strains was 21 228. Phylogenetic trees were generated using FastTree software (version 2.1.10) [20] and visualized using FigTree V.1.4.3 (http://tree.bio.ed.ac.uk/s(oftware/figtree/) or Interactive Tree Of Life (iTOL) version 5 [21] software. Core genome assessment and minimum spanning trees were calculated using SeqSphere https://www.ridom.de/seqsphere/ (version6.0). Pairs of isolates were considered as potentially the result of direct transmission (high-risk pairs) if they were within 0–1 core-genome SNPs and 0–10 whole-genome SNPs of each other. These criteria were based on previous literature [22], along with an analysis of the probability of a common location between pairs as a function of SNP distance. The latter suggested that potentially transmitted strains assessed with the modified CFSAN pipeline used in this study were unlikely to be separated by >1 core SNP (Supplementary methods). In-depth medical record review was performed on all closely related pairs to assess for any healthcare facility overlap of 2 patients simultaneously or within 30 days of each other.
Statistical Analysis
Pearson χ2 test with Yate’s continuity correction was used to determine significant associations between 2 categorical variables. Principal coordinates analysis [23] was used to explore and visualize isolates based on the SNPs (Hamming distance) between all isolates (Supplementary Methods). Owing to the unique structure of the pairwise distance matrix and the non-normality nature of the Hamming distance, we designed 2 permutation tests (t1 and t2) to determine whether the mean and variance of the Hamming distance between 2 isolates differed significantly between groups (Supplementary Methods).
RESULTS
Epidemiological Profiles of New York and Minnesota CDI Cases
Over the 3-month collection period, 260 and 162 isolates of C. difficile were sequenced from incident cases in New York and Minnesota, respectively (Table 2). Overall, 203 (48.1%) samples were from CA-CDI cases and 212 (50.2%) from HCA-CDI cases; 7 cases had unknown epidemiological classification. HCA-CDI cases comprised 89 (21.1%) CO-HCFA, 84 (19.9%) HO, and 39 (9.24%) LTCO cases. Samples from New York had a higher proportion of HCA-CDI cases than samples from Minnesota (60.0% vs 34.6%, respectively; P < .001) (Table 2; data set 1).
MLSTs of New York and Minnesota Isolate Groups
An overall MLST assessment revealed a diverse group, with no single ST representing more than 9.2% (ST42) of the total (Figure 1A and Supplementary Table 4). A minimum spanning tree based on core genome MLST of the entire collection (SeqSphere; 1304 alleles) demonstrated the distribution of MLSTs and their correlation with the core genome (Figure 1D). Relationships based on whole-genome sequence comparison are demonstrated in Supplementary Figure 1.
Figure 1.

Multilocus sequence types (MLSTs) and core genome assessment. A–C, MLST composition of New York (NY) and Minnesota (MN) isolates combined (A), New York isolates only (B), and Minnesota isolates only (C). Pie charts show MLSTs that accounted for >2.0% of each group. D, E, Minimum spanning trees based on core genomes of 413 strains meeting quality control criteria colored by MLST (D) and state of origin (E). Abbreviation: ST, sequence type.
In subsequent analyses, we focused on those STs that were represented by ≥10 isolates in both sites (ST1, ST2, ST3, ST6, ST8, ST11, ST14, ST41, ST42, ST43, ST46, ST53, ST54, ST58, and ST110). Types that accounted for >4% of samples, such as ST42 (n = 39 [9.2%]), ST2 (n = 34 [8.1%]), ST1 (n = 33 [7.8%]), ST8 (n = 33 [7.8%]), ST53 (n = 18 [4.3%]), and ST110 (n = 17 [4.0%]), are illustrated in Figure 1A. Most of these STs were represented equivalently in both sites, which was confirmed by a χ2 test of the overall association between site and ST types (P = .13). Two notable exceptions in this analysis were ST1 (New York vs Minnesota, 28 [10.8%] vs 5 [3.1%] samples; P = .008) and ST41 (1 [0.4%] vs 9 [5.6%] samples; P = .002). Minimum spanning trees comprising the most frequently observed STs (ST2, ST8, and ST42) did not reveal any obvious clustering by state with the exception of a small group of 5 Minnesota ST42 isolates (Figures 1E and 2A–2C). Using permutation-based tests and principal coordinates analysis–based cluster analyses, we found that the distribution of pairs of samples collected from the same state versus disparate states did not differ significantly.
Figure 2.

Core genome minimum spanning trees for sequence type (ST) 2 (A), ST8 (B), and ST42 (C). Trees in the left column are colored by state of origin (Minnesota [MN] or New York [NY]); trees in the right column, by epidemiological classification. Abbreviations: CA, community associated; CO-HCFA, community onset–healthcare facility associated; HO, hospital onset; LTCO, long-term care facility onset.
MLST Association With Epidemiological Classification
A significant overall association between MLSTs and epidemiological classification was found (P = .008). When data were stratified by site, we found that this association was driven primarily by samples collected from New York (P = .08), as opposed to Minnesota (P = .4). A χ2 test applied to each MLST indicated an overall significant association between MLSTs and epidemiological classifications that was driven by ST1 (CA vs HCA, 8 [3.9%] vs 25 [11.8%] samples; P = .006), ST53 (3 [1.5%] vs 15 [7.1%]; P = .01), ST3 (10 [4.9%] vs 3 [1.4%]; P = .08), ST41 (7 [3.5%] vs 2 [0.9%]; P = .2), and ST43 (2 [1%] vs 8 [3.8%]; P = .1) (Figure 3). Minimum spanning trees of the 3 most common STs (ST2, ST8, and ST42) did not reveal clustering by epidemiological classification (Figure 2A–2C). Among individual hospitals and LTCFs in both New York and Minnesota, low numbers of isolates (n = 1–3) from a diverse assortment of STs were found (Supplementary Tables 1–3).
Figure 3.
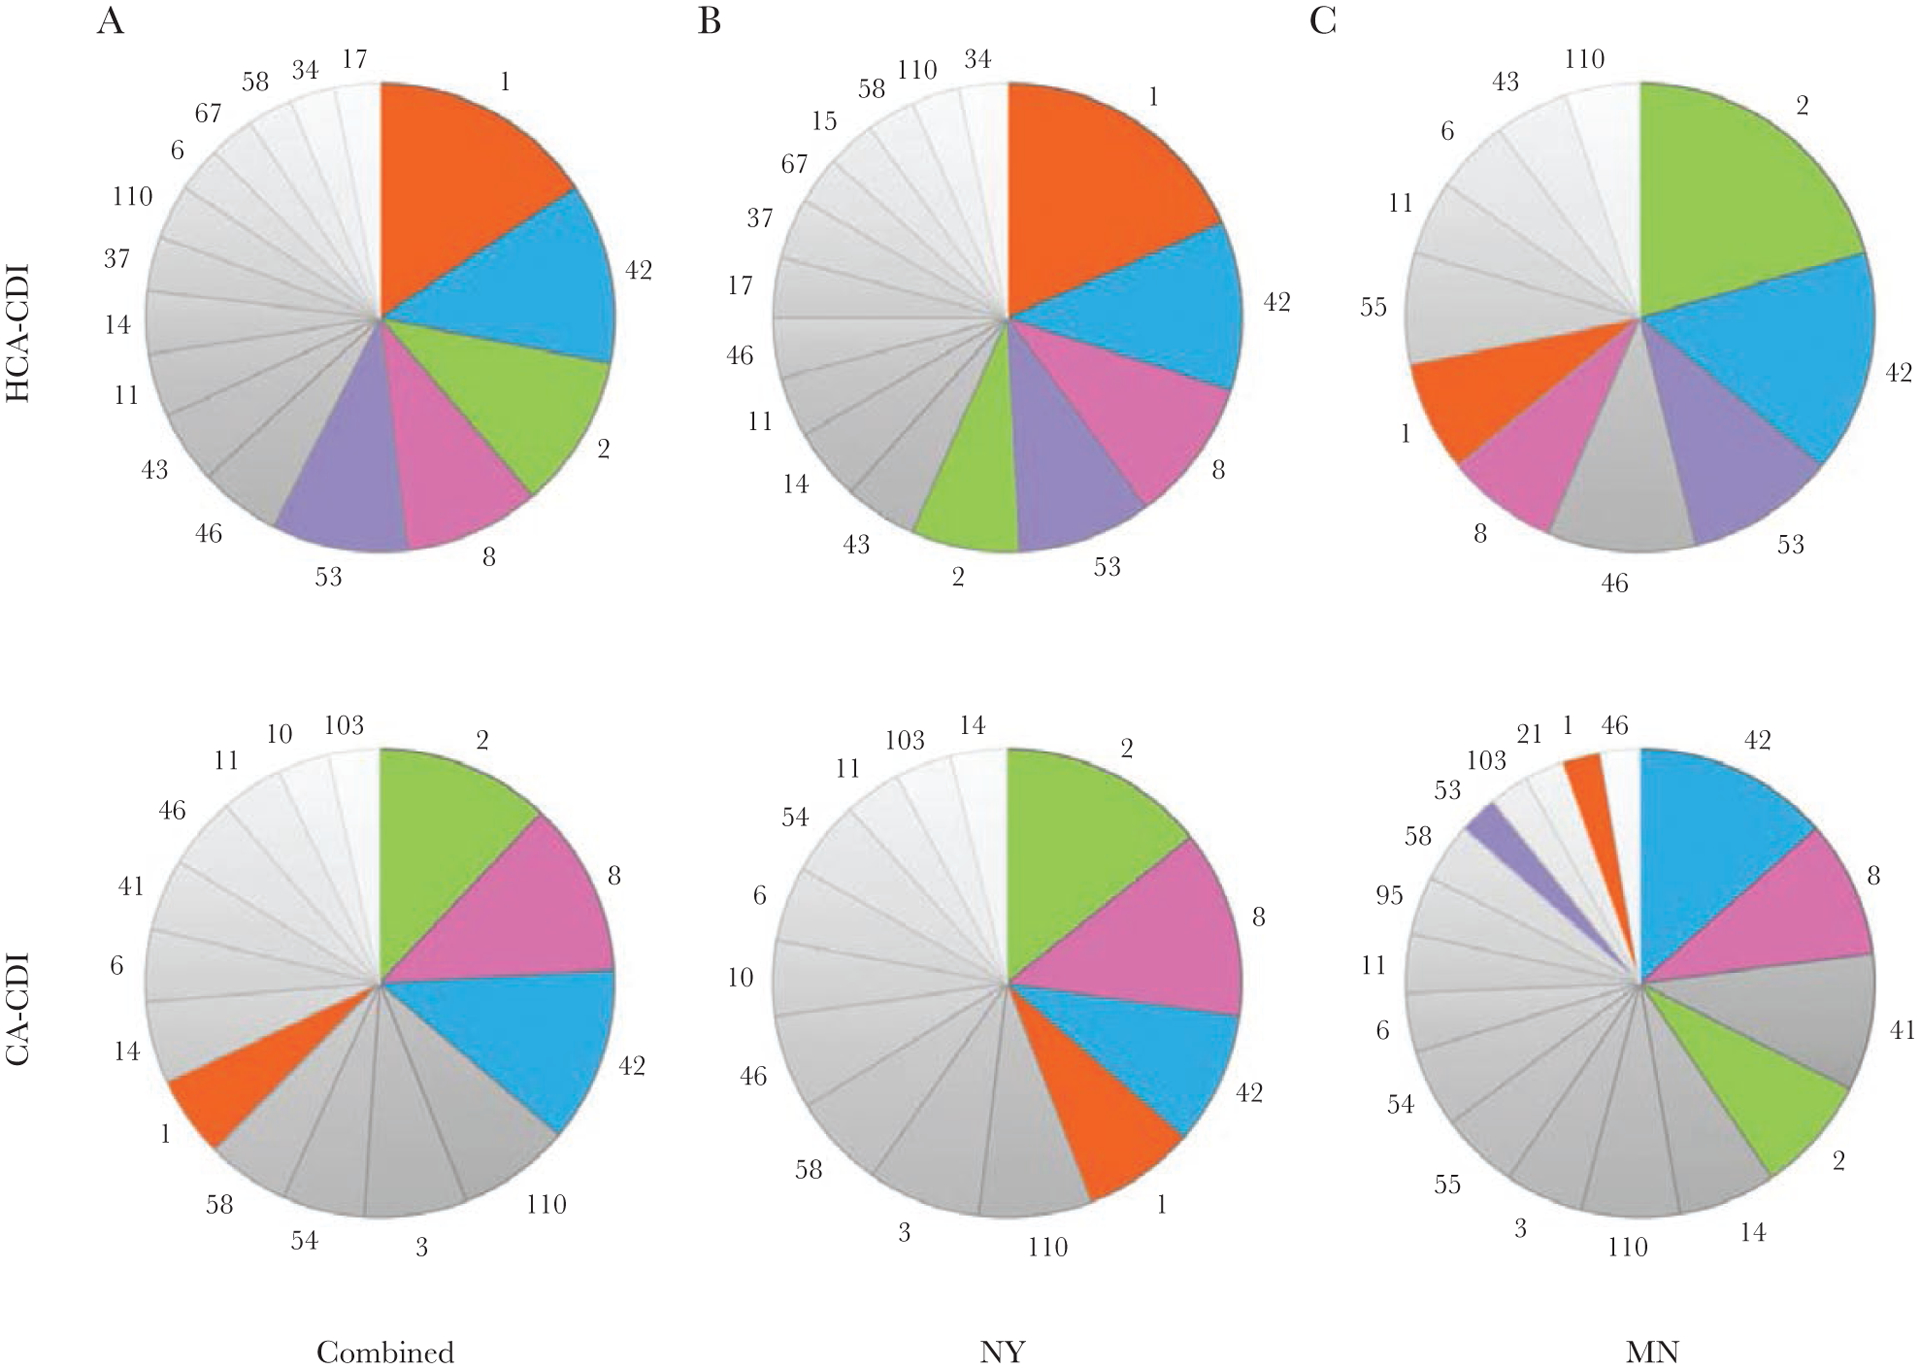
Multilocus sequence types (MLST) distribution among healthcare-associated (HCA) Clostridioides difficile infection (CDI) cases versus community-associated (CA) CDI cases in combined set (A), New York (NY) (B), and Minnesota (MN) (C) isolates. Pie charts show MLSTs that accounted for >2.0% of each group.
Assessment of Transmission
For the combined (New York and Minnesota) set that passed quality control for SNP calling, we identified 33 pairs of isolates that met genomic criteria to indicate potential direct transmission (Table 3). The majority of these pairs were within the New York group, and only 5 of the pairs involved 2 CA-CDI cases; the remainder had ≥1 member with HCA-CDI.
Table 3.
Characteristics of Closely Related Isolate Pairs
| SNPs, No. | Epidemiological Classification | ||||||
|---|---|---|---|---|---|---|---|
| Isolate 1 | Isolate 2 | WG | CG | State (Isolate 1:Isolate 2) | Isolate 1 | Isolate 2 | MLST |
| M2016019781 | M2016019870 | 0 | 0 | NY: NY | HO | LTCO | 1a |
| M2016019706 | M2016019715 | 1 | 0 | NY: NY | HO | HO | 17a |
| M2016019446 | M2016019861 | 2 | 0 | NY: NY | CA | CO-HCFA | 1 |
| M2016019464 | M2016019736 | 3 | 0 | NY: NY | HO | LTCO | 1a |
| M2016019615 | M2016019709 | 3 | 0 | NY: NY | CO-HCFA | CA | 46 |
| M2016019615 | M2016019822 | 3 | 0 | NY: NY | CO-HCFA | CO-HCFA | 46a |
| M2016019453 | M2016019779 | 4 | 0 | NY: NY | HO | LTCO | 37 |
| M2016019458 | M2016019615 | 4 | 0 | NY: NY | CA | CO-HCFA | 46 |
| M2016019706 | M2016019902 | 4 | 0 | NY: NY | HO | HO | 17a |
| M2016019762 | M2016019849 | 4 | 0 | NY: NY | CA | CA | 1 |
| M2016019764 | M2016019773 | 4 | 0 | NY: NY | CO-HCFA | CA | 58 |
| M2016019458 | M2016019709 | 5 | 0 | NY: NY | CA | CA | 46 |
| M2016019458 | M2016019822 | 5 | 0 | NY: NY | CA | CO-HCFA | 46a |
| M2016019708 | M2017012316 | 5 | 0 | NY:MNb | HO | CO-HCFA | 53 |
| M2016019709 | M2016019822 | 5 | 0 | NY: NY | CA | CO-HCFA | 46 |
| M2016019715 | M2016019902 | 5 | 0 | NY: NY | HO | HO | 17a |
| M2017011680 | M2016019428 | 5 | 0 | MN:NYb | CA | CO-HCFA | 6 |
| M2016019477 | M2016019708 | 7 | 0 | NY: NY | HO | HO | 53 |
| M2017012311 | M2017014925 | 2 | 1 | MN:MN | CA | CA | 21 |
| M2016019458 | M2016019785 | 4 | 1 | NY: NY | CA | CA | 46a |
| M2016019468 | M2016019815 | 4 | 1 | NY: NY | LTCO | CO-HCFA | 1a |
| M2016019618 | M2016019780 | 4 | 1 | NY: NY | LTCO | CA | 1 |
| M2016019762 | M2016019818 | 4 | 1 | NY: NY | CA | HO | 1 |
| M2016019818 | M2016019849 | 4 | 1 | NY: NY | HO | CA | 1 |
| M2016019441 | M2016019468 | 5 | 1 | NY: NY | LTCO | LTCO | 1a |
| M2016019476 | M2016019809 | 5 | 1 | NY: NY | HO | HO | 53 |
| M2016019615 | M2016019785 | 5 | 1 | NY: NY | CO-HCFA | CA | 46a |
| M2016019785 | M2016019822 | 5 | 1 | NY: NY | CA | CO-HCFA | 46a |
| M2016019709 | M2016019785 | 6 | 1 | NY: NY | CA | CA | 46a |
| M2016019704 | M2016019714 | 7 | 1 | NY: NY | HO | HO | 8 |
| M2016019704 | M2016019743 | 7 | 1 | NY: NY | HO | CA | 8 |
| M2016019771 | M2017014466 | 7 | 1 | NY:MNb | LTCO | CO-HCFA | 41 |
| M2016019760 | M2016019867 | 8 | 1 | NY: NY | LTCO | LTCO | 11a |
Abbreviation: CA, community associated. CG, core genome; CO-HCFA, community onset–healthcare facility associated; HO, hospital onset; LTCO, long-term care facility onset; MLST, multilocus sequence type; MN, Minnesota; NY, New York; SNP, single-nucleotide polymorphism; WG, whole-genome.
Record review revealed that patients had contact with a common institution.
Interstate pairs.
The 33 pairs included ST46 (10 pairs), ST1 (9 pairs), ST17 (3 pairs), ST53 (3 pairs), ST8 (2 pairs), and single pairs of ST6, ST21, ST37, and ST58 (Table 3). The single pair from Minnesota was ST21. MLSTs with >1 pair meeting both potential genomic transmission criteria and having evidence of contact with a common facility (ST46, ST1, and ST17) were assessed as a group for clustering by state, epidemiological class, and residence in a hospital or LTCF in the 12 weeks before admission (Figure 4A–4D). ST1 isolates were almost exclusively from New York and did not cluster by epidemiological class or hospital. ST46 isolates were frequently (50%) from CA-CDI cases and did not display any clear association with stay in a particular hospital or LTCF during the 12 weeks before diagnosis. ST17 isolates made up a small percentage of the sample set (7 of 422 [1.7%]) but accounted for 3 of the 8 that met criteria for potential transmission. Cases involving ST17 were often HCA-CDI (71.4%).
Figure 4.
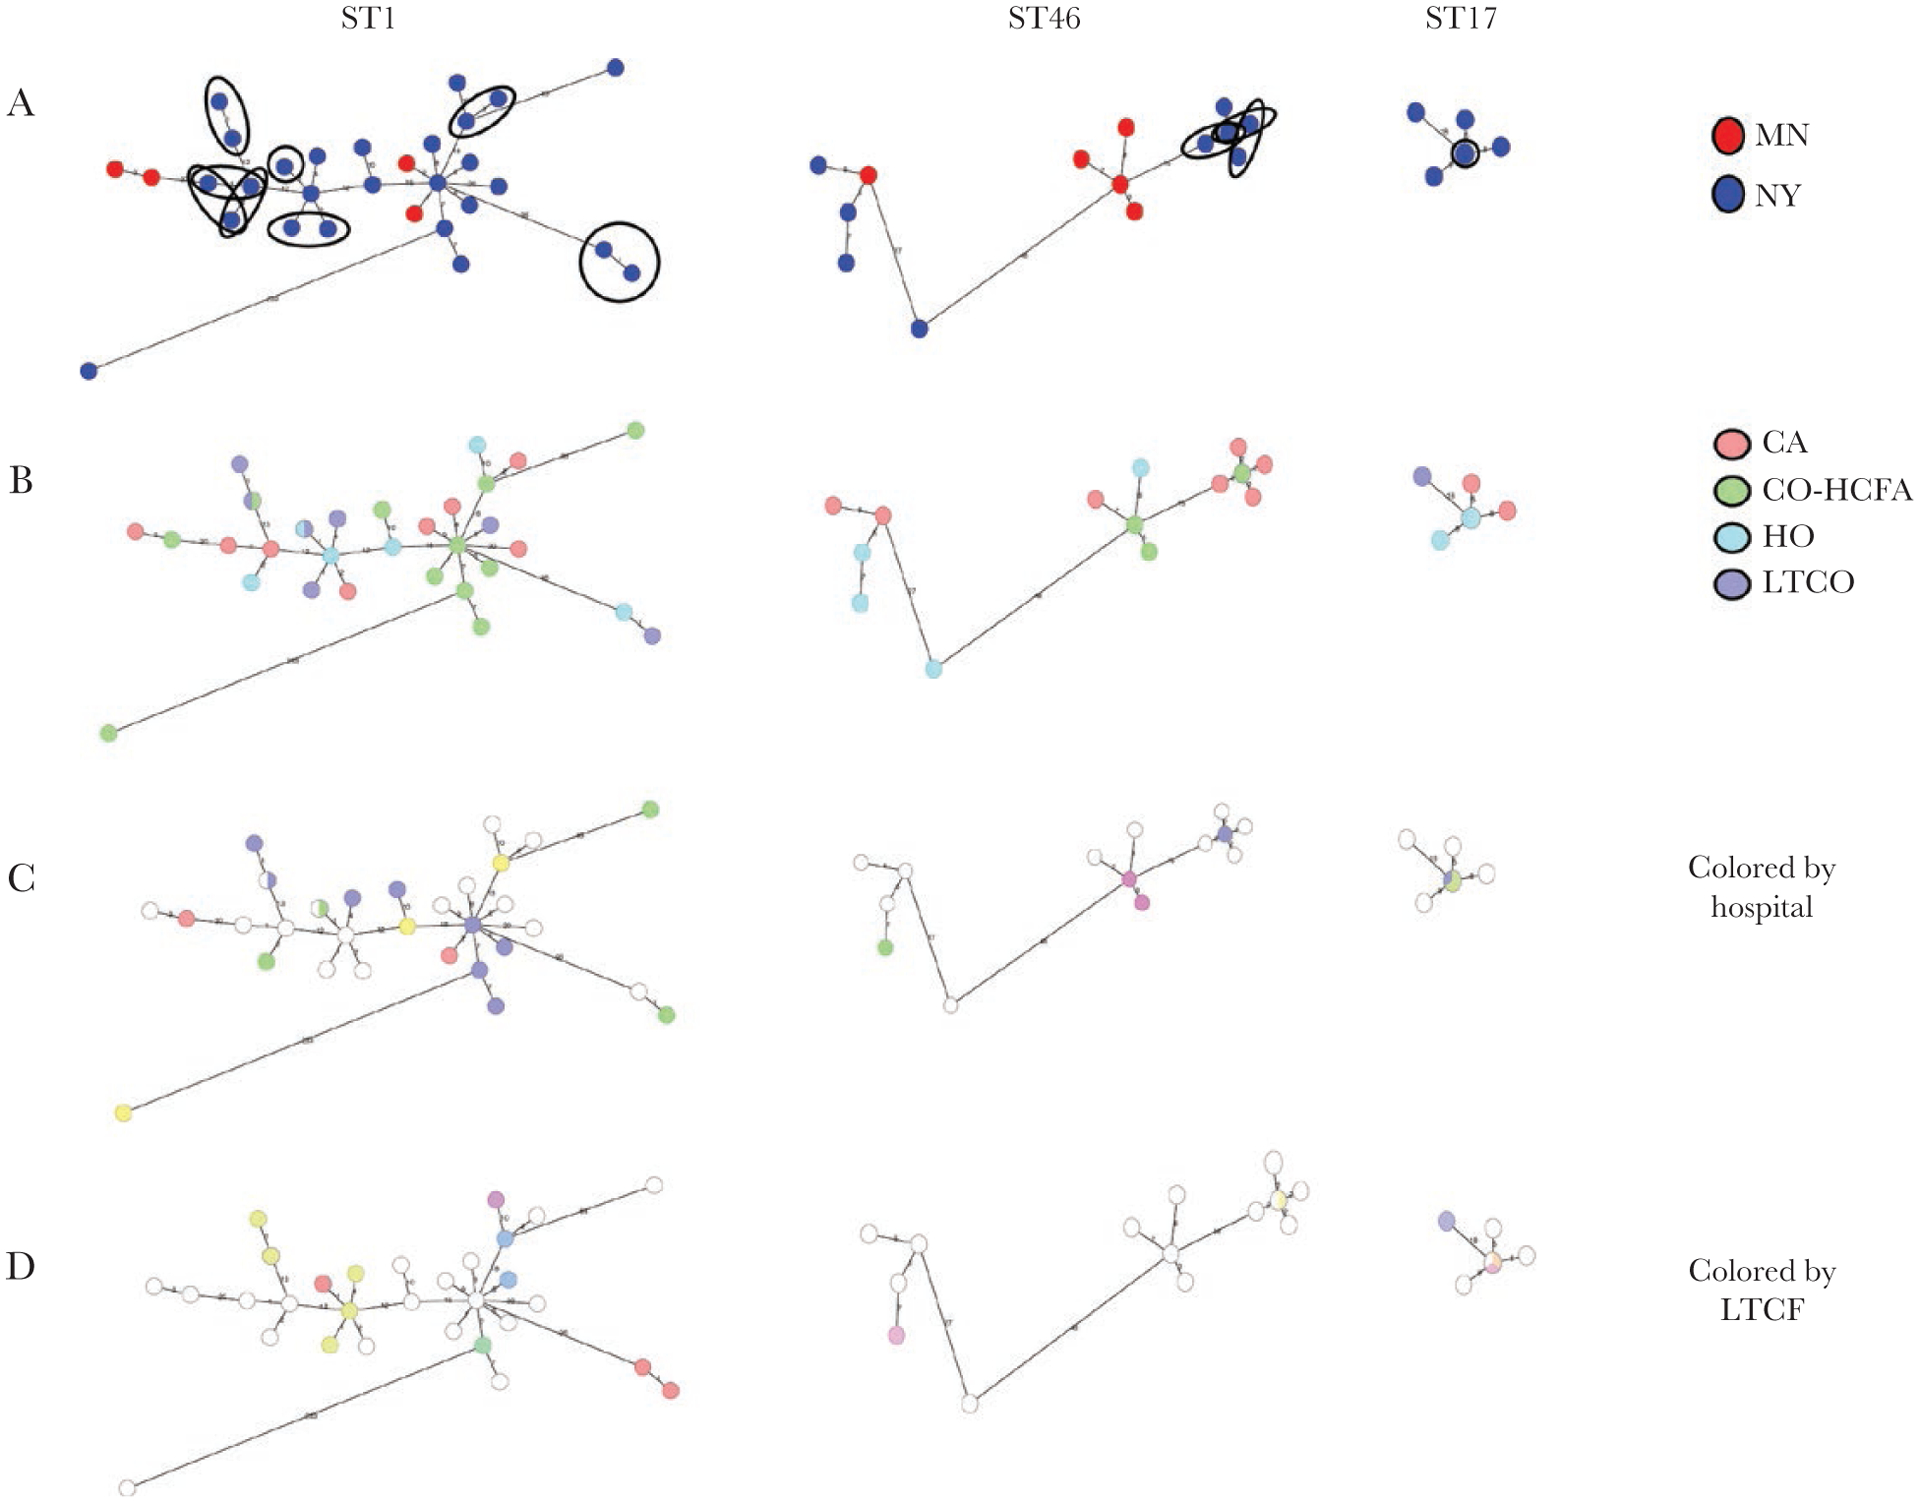
Characterization of patients with sequence type (ST) 46, ST1, and ST17 isolates. A, State of origin (Minnesota [MN] or New York [NY]). Closely related pairs likely due to direct transmission (by genomics and contact with a common facility) are circled. B, Epidemiological classification. C, Admission to a hospital in the 12 weeks before diagnosis. D, Admission to a long-term care facility (LTCF) in the 12 weeks before diagnosis. Abbreviations: CA, community associated; CO-HCFA, community onset–healthcare facility associated; HO, hospital onset; LTCO, long-term care facility onset.
Among the 10 pairs of ST46, 6 pairs had contact with a common healthcare facility, NYH04 (Figure 4 and Supplementary Figure 3). All cases except M2016019709 had minor and nonoverlapping exposures to NYH04, sometimes as brief as a single day (no overnight stays) (Supplementary Figure 3). For 4 of the 9 ST1 pairs, overlapping stays in the same facility were readily apparent across both LTCFs and hospitals (Supplementary Figure 2). Of note, although several samples came from patients in the same nursing homes (ie, NYLTCF004 and NYLTCF011) and hospital (ie, NYH04), the pairs did not appear to be interrelated by WGS, indicating several independent transmissions between 2 patients rather than larger clusters, even within single facilities (Figure 4 and Supplementary Figure 2). The 3 closely related ST17 pairs involved 3 patients and constituted a small cluster in New York, as shown in Figure 4, where the 3 related isolates are overlaid on the central node. In-depth record review revealed that all 3 patients had significant overlap in NYH01 (Supplementary Figure 4). Two of the patients also overlapped in NYLTCF003 (Supplementary Figure 4). The only other closely related pair by genomic criteria and with evidence of shared healthcare facility contact was a single pair of ST11 isolated from patients who overlapped in NYLTCF18.
Several other of the 33 pairs that met genomic criteria for potential transmission failed to reveal any common institutional contact upon chart review. Three such pairs included individuals from New York and Minnesota.
DISCUSSION
In the current study, we found that across 2 different Emerging Infections Program sites, some local trends emerged within the homogenous background of the prevailing MLSTs: ST42, ST8, and ST2. The most marked difference was in the relative disease burden caused by NAP1/RT027/ST1, which was significantly higher in New York (10.8%) than in Minnesota (3.1%). The presence of ST1 in New York, with its concentration among HCA-CDI cases, may explain a substantial part of the epidemiological differences between the 2 sites. Site disparities were also observed for ST17 and ST41, more frequently in New York and Minnesota, respectively. Interestingly, within the most common STs (ST42, ST8, and ST2), there was little if any clustering by state, indicating that isolates were no more related to those from the same state than to those from a different state. Similarly, a recent study of C. difficile isolates collected across Europe demonstrated that certain ribotypes (002, 014, and 020, which account for ST8 and ST2) did not cluster by country, suggesting that certain STs may have a source that has wide geographic distribution, such as the food chain [24].
Comparing data from geographically distant sites was useful for determining an association between MLST and epidemiological classification. Associations found between STs and either CA-CDI or HCA-CDI in both sites are more likely to reflect real ST-specific niches, rather than local trends. We found in both sites that ST1, ST53, and ST43 were more likely associated with HCA-CDI, while ST3 and ST41 were more commonly isolated from CA-CDI cases. While the association of ST1 and HCA-CDI is well described, ST53 (RT103) is a less frequently isolated toxigenic strain reported from other institutions [25]. Very little is reported about ST43, while ST3 (RT001/REA group J) is a commonly identified strain associated with both hospital and community strains [26–30].
As previously reported in the United States and Great Britain [22, 31], direct transmission between patients in either site was infrequent. Using genomic criteria of 0–1 SNPs across the core genome, with ≤10 SNPs across the whole genome, we found 33 pairs, of which 14 demonstrated contact with a common healthcare facility on record review. Ten of the 14 pairs were ST46 and ST1. The majority of the closely related pairs had ≥1 pair member with HCA-CDI, and transmission was more common in New York than in Minnesota. The disparity could be due to the larger number of ST1/RT027/NAP1 strain in New York, as this strain may be more transmissible than other circulating types [32]. While other studies have described the high transmissibility of MLST1, ST46 (RT087) is less well characterized [14, 33–35]. It is interesting that several of the patients with ST46 had very short contact (ie, short emergency department visits or same-day procedures) in NYH04 although were not present there simultaneously.
The group of isolates potentially due to transmission also included 3 pairs of ST17, which appeared to form a small cluster of CDI cases in New York, and a single pair of ST11 isolates. ST17 was recently identified as a major strain within a Japanese hospital, while ST11 is a well-described zoonotic strain [25].
Healthcare facility overlap between CDI cases was identified in almost half of the genomically related pairs, indicating a plausible transmission event. In several instances, multiple common exposures between hospitals and LTCFs characterized closely related pairs highlighting the complex interinstitutional transfer of strains with patients’ movement. However, several pairs of closely related isolates had no obvious overlap, even after in-depth record review, and indeed little healthcare exposure at all. This was particularly true for pairs of ST46, which were also more likely to involve community CDI cases (CA or CO-HCFA) CDI. While the numbers are small, this finding raises the possibility that those STs prevalent in healthcare and community environments may have transmission chains that are intermingled between the 2 settings or not related to healthcare exposure at all. If this finding is true, it will be important for genomic studies to continue to include community samples, in order to understand larger transmission patterns and broaden the current focus beyond healthcare institutions.
The lack of large case clusters, even when ST1 is present, highlights the effectiveness of current infection prevention practices at averting outbreaks in healthcare facilities. These practices may not always prevent single transmission events; however, these appear to be quite limited. While infection control practices cannot be relaxed, future interventions should focus on reducing patient-level risk factors for CDI through antibiotic stewardship.
Limitations of this study include the short time frame of 3 months and exclusion of specimens from recurrent and non-catchment CDI cases, likely leading to an underestimate of transmission. Similarly, this study did not include samples from colonized cases, which are known to play a role in transmission, although of a lower magnitude [14, 36]. In addition, potential transmissions were evaluated by reviewing available medical records for contact to a common healthcare facility but not to a specific ward, and some outpatient encounters might be missed. It should also be noted that the core SNP cutoff of 0–1 is different from the 0–2 cutoff, which is more commonly applied using other analytical pipelines (see Supplementary Methods).
Strengths of this work include the inclusion of isolates from CA cases, geographically and epidemiologically distinct sites, and extensive metadata associated with each isolate. The findings presented here expand on the growing body of knowledge of the current C. difficile landscape, highlighting the continuing presence of NAP1/RT027/ST1 as a transmissible, HCA strain even while its overall share of the disease causing C. difficile strain has declined. With the intense focus on NAP1/RT027/ST1 over the past 10–15 years, relatively little has been published on the most common MLSTs/ribotypes described here as well as by others conducting genomic surveillance studies. With the use of WGS, we expect that will change, along with the broadening of our understanding of CDI beyond the walls of healthcare institutions.
Supplementary Material
Acknowledgments.
The authors acknowledge the contributions of Brenda Tesini, MD, Rebecca Tsay, MPH, Lauren Korhonen, MPH, Maria Karlsson, PhD, Ashley Paulick, BS, and Michelle Adamczyk, BS.
Financial support.
This work was supported through a co-operative agreement with the Centers for Disease Control and Prevention Emerging Infections Program (grants U50/CCU511190 and NU50CK000486) and the Epidemiology and Laboratory Capacity for Infectious Diseases Program (grant U50/CK000371), and by the University of Rochester Medical Center Translational Immunology and Infectious Disease Institute.
Footnotes
Presented in part: Association of Public Health Laboratories GenomeTrakr meeting, College Park, Maryland, 17–18 September 2019.
Publisher's Disclaimer: Disclaimer. The findings and conclusions in this manuscript are those of the authors and do not necessarily represent the official position of the US Centers for Disease Control and Prevention.
Supplementary Data
Supplementary materials are available at The Journal of Infectious Diseases online. Consisting of data provided by the authors to benefit the reader, the posted materials are not copyedited and are the sole responsibility of the authors, so questions or comments should be addressed to the corresponding author.
Potential conflicts of interest. All authors: No reported conflicts. All authors have submitted the ICMJE Form for Disclosure of Potential Conflicts of Interest. Conflicts that the editors consider relevant to the content of the manuscript have been disclosed.
References
- 1.Leffler DA, Lamont JT. Clostridium difficile infection. N Engl J Med 2015; 372:1539–48. [DOI] [PubMed] [Google Scholar]
- 2.Guh AY, Mu Y, Winston LG, et al. ; Emerging Infections Program Clostridioides difficile Infection Working Group. Trends in U.S. Burden of Clostridioides difficile infection and outcomes. N Engl J Med 2020; 382:1320–30. [DOI] [PMC free article] [PubMed] [Google Scholar]
- 3.CDC. Antibiotic Resistance Threats in the United States, 2019. Atlanta, GA: U.S. Department of Health and Human Services, CDC; 2019. [Google Scholar]
- 4.McDonald LC, Killgore GE, Thompson A, et al. An epidemic, toxin gene-variant strain of Clostridium difficile. N Engl J Med 2005; 353:2433–41. [DOI] [PubMed] [Google Scholar]
- 5.Martin JS, Monaghan TM, Wilcox MH. Clostridium difficile infection: epidemiology, diagnosis and understanding transmission. Nat Rev Gastroenterol Hepatol 2016; 13:206–16. [DOI] [PubMed] [Google Scholar]
- 6.Giancola SE, Williams RJ 2nd, Gentry CA. Prevalence of the Clostridium difficile BI/NAP1/027 strain across the United States Veterans Health Administration. Clin Microbiol Infect 2018; 24:877–81. [DOI] [PubMed] [Google Scholar]
- 7.Redmond SN, Silva SY, Wilson BM, Cadnum JL, Donskey CJ. Impact of reduced fluoroquinolone use on Clostridioides difficile infections resulting from the fluoroquinolone-resistant ribotype 027 strain in a Veterans Affairs Medical Center. Pathog Immun 2019; 4:251–9. [DOI] [PMC free article] [PubMed] [Google Scholar]
- 8.Kazakova SV, Baggs J, McDonald LC, et al. Association between antibiotic use and hospital-onset Clostridioides difficile infection in US acute care hospitals, 2006–2012: an ecologic analysis. Clin Infect Dis 2020;70:11–8. [DOI] [PubMed] [Google Scholar]
- 9.Dingle KE, Didelot X, Quan TP, et al. ; Modernising Medical Microbiology Informatics Group. Effects of control interventions on Clostridium difficile infection in England: an observational study. Lancet Infect Dis 2017; 17:411–21. [DOI] [PMC free article] [PubMed] [Google Scholar]
- 10.Lessa FC, Mu Y, Bamberg WM, et al. Burden of Clostridium difficile infection in the United States. N Engl J Med 2015; 372:825–34. [DOI] [PMC free article] [PubMed] [Google Scholar]
- 11.Evans CT, Safdar N. Current trends in the epidemiology and outcomes of Clostridium difficile infection. Clin Infect Dis 2015; 60(suppl 2):S66–71. [DOI] [PubMed] [Google Scholar]
- 12.Khanna S, Pardi DS, Aronson SL, et al. The epidemiology of community-acquired Clostridium difficile infection: a population-based study. Am J Gastroenterol 2012; 107:89–95. [DOI] [PMC free article] [PubMed] [Google Scholar]
- 13.Centers for Disease Control and Prevention. 2017 Annual report for the Emerging Infections Program for Clostridioides difficile infection. 2017. https://www.cdc.gov/hai/eip/cdiff-tracking.html. Accessed April 1st, 2019.
- 14.Kong LY, Eyre DW, Corbeil J, et al. Clostridium difficile: Investigating transmission patterns between infected and colonized patients using whole genome sequencing. Clin Infect Dis 2019; 68:204–9. [DOI] [PMC free article] [PubMed] [Google Scholar]
- 15.Eyre DW, Cule ML, Wilson DJ, et al. Diverse sources of C. difficile infection identified on whole-genome sequencing. N Engl J Med 2013; 369:1195–1205. [DOI] [PMC free article] [PubMed] [Google Scholar]
- 16.Griffiths D, Fawley W, Kachrimanidou M, et al. Multilocus sequence typing of Clostridium difficile. J Clin Microbiol 2010; 48:770–8. [DOI] [PMC free article] [PubMed] [Google Scholar]
- 17.Bolger AM, Lohse M, Usadel B. Trimmomatic: a flexible trimmer for Illumina sequence data. Bioinformatics 2014; 30:2114–20. [DOI] [PMC free article] [PubMed] [Google Scholar]
- 18.Bankevich A, Nurk S, Antipov D, et al. SPAdes: a new genome assembly algorithm and its applications to single-cell sequencing. J Comput Biol 2012; 19:455–77. [DOI] [PMC free article] [PubMed] [Google Scholar]
- 19.Davis S, Pettengill JB, Luo Y, et al. CFSAN SNP Pipeline: an automated method for constructing SNP matrices from next-generation sequence data. PeerJ Computer Science 2015; 1:e20. [Google Scholar]
- 20.Price MN, Dehal PS, Arkin AP. FastTree: computing large minimum evolution trees with profiles instead of a distance matrix. Mol Biol Evol 2009; 26:1641–50. [DOI] [PMC free article] [PubMed] [Google Scholar]
- 21.Letunic I, Bork P. Interactive Tree Of Life (iTOL) v4: recent updates and new developments. Nucleic Acids Res 2019; 47:W256–9. [DOI] [PMC free article] [PubMed] [Google Scholar]
- 22.Eyre DW, Cule ML, Wilson DJ, et al. Diverse sources of C. difficile infection identified on whole-genome sequencing. N Engl J Med 2013; 369:1195–205. [DOI] [PMC free article] [PubMed] [Google Scholar]
- 23.Gower JC. Some distance properties of latent root and vector methods used in multivariate analysis. Biometrika 1966; 53:325–38. [Google Scholar]
- 24.Eyre DW, Davies KA, Davis G, et al. ; EUCLID Study Group. Two distinct patterns of Clostridium difficile diversity across Europe indicating contrasting routes of spread. Clin Infect Dis 2018; 67:1035–44. [DOI] [PMC free article] [PubMed] [Google Scholar]
- 25.Okada Y, Yagihara Y, Wakabayashi Y, et al. Epidemiology and virulence-associated genes of Clostridioides difficile isolates and factors associated with toxin EIA results at a university hospital in Japan. Access Microbiol 2020; 2. [DOI] [PMC free article] [PubMed] [Google Scholar]
- 26.Li C, Li Y, Huai Y, et al. Incidence and outbreak of healthcare-onset healthcare-associated Clostridioides difficile infections among intensive care patients in a large teaching hospital in China. Front Microbiol 2018; 9:566. [DOI] [PMC free article] [PubMed] [Google Scholar]
- 27.Liao F, Li W, Gu W, et al. A retrospective study of community-acquired Clostridium difficile infection in southwest China. Sci Rep 2018; 8:3992. [DOI] [PMC free article] [PubMed] [Google Scholar]
- 28.Liu XS, Li WG, Zhang WZ, Wu Y, Lu JX. Molecular characterization of Clostridium difficile isolates in China from 2010 to 2015. Front Microbiol 2018; 9:845. [DOI] [PMC free article] [PubMed] [Google Scholar]
- 29.Baines SD, O’Connor R, Freeman J, et al. Emergence of reduced susceptibility to metronidazole in Clostridium difficile. J Antimicrob Chemother 2008; 62:1046–52. [DOI] [PubMed] [Google Scholar]
- 30.Johnson S, Samore MH, Farrow KA, et al. Epidemics of diarrhea caused by a clindamycin-resistant strain of Clostridium difficile in four hospitals. N Engl J Med 1999; 341:1645–51. [DOI] [PubMed] [Google Scholar]
- 31.Eyre DW, Shaw R, Adams H, et al. WGS to determine the extent of Clostridioides difficile transmission in a high incidence setting in North Wales in 2015. J Antimicrob Chemother 2019; 74:1092–100. [DOI] [PubMed] [Google Scholar]
- 32.Eyre DW, Fawley WN, Rajgopal A, et al. Comparison of control of Clostridium difficile infection in six English hospitals using whole-genome sequencing. Clin Infect Dis 2017; 65:433–41. [DOI] [PMC free article] [PubMed] [Google Scholar]
- 33.Chatedaki C, Voulgaridi I, Kachrimanidou M, Hrabak J, Papagiannitsis CC, Petinaki E. Antimicrobial susceptibility and mechanisms of resistance of Greek Clostridium difficile clinical isolates. J Glob Antimicrob Resist 2019; 16:53–8. [DOI] [PubMed] [Google Scholar]
- 34.De Boer E, Zwartkruis-Nahuis A, Heuvelink AE, Harmanus C, Kuijper EJ. Prevalence of Clostridium difficile in retailed meat in the Netherlands. Int J Food Microbiol 2011; 144:561–4. [DOI] [PubMed] [Google Scholar]
- 35.Heslop OD, Roye-Green K, Coard K, Mulvey MR. A unique strain of community-acquired Clostridium difficile in severe complicated infection and death of a young adult. BMC Infect Dis 2013; 13:299. [DOI] [PMC free article] [PubMed] [Google Scholar]
- 36.Donskey CJ, Sunkesula VCK, Stone ND, et al. Transmission of Clostridium difficile from asymptomatically colonized or infected long-term care facility residents. Infect Control Hosp Epidemiol 2018; 39:909–16. [DOI] [PubMed] [Google Scholar]
Associated Data
This section collects any data citations, data availability statements, or supplementary materials included in this article.