

Abstract
African American adolescents living in neighborhoods with concentrated economic disadvantage are disproportionately exposed to community violence. This study builds upon previous research and examines patterns, severity, and chronicity of violence exposure, within a sample of African American adolescents living in low-resourced, urban neighborhoods (n = 327). The influence of both individual- and contextual-level factors on community violence exposure (CVE) are examined. Data were collected across four time points at 6-month intervals. Latent transition analysis identified three patterns of CVE at each time point: low witnessing and low victimization (LW-LV), high witnessing and low victimization (HW-LV), and high witnessing and high victimization (HW-HV), as well as transitions between each class. Although a stable LW-LV class membership over time was the most prevalent pattern, most adolescents experienced some change in exposure. Nearly one-third of the participants were classified in the HW-HV group at some point in time. Analyses on individual- and contextual-level factors revealed that more depressive symptoms, community problems (e.g., drugs, graffiti, noise), or community resources (e.g., schools, parks, recreational facilities) were associated with an increased likelihood of experiencing high levels of violent victimization. Implications for intervention and prevention of CVE are discussed.
Keywords: Community violence exposure, African American adolescents, latent transition analysis, individual level factors, contextual factors
The vast majority of urban adolescents, up to 80% of all adolescents and 95% of African American adolescents, report witnessing or experiencing some form of violence in their lifetime (Gaylord-Harden, Cunningham, & Zelencik, 2011; Kimonis, Ray, Branch, & Cauffman, 2011). Exposure to community violence, defined as “deliberate acts intended to cause physical harm against a person or persons in the community” (Cooley, Turner, & Beidel, 1995, p. 202), may be particularly harmful, especially for African American adolescents living in low-resourced urban neighborhoods. Zimmerman and Messner (2013) found that the odds of being exposed to community violence were 112% higher for African American adolescents than they were for White adolescents. These disparities in violence exposure may be attributable to factors such as socioeconomic status, residence in neighborhoods with higher levels of concentrated disadvantage (e.g., higher rates of poverty, unemployment), and lack of access to beneficial youth services (Zimmerman & Messner, 2013).
Community violence exposure (CVE) may have significant effects on mental health among African American and other ethnic minority youth, including higher rates of depressive symptoms, aggression, and post-traumatic stress disorder (PTSD) (Bennett & Joe, 2015; Shukla & Wiesner, 2015). These effects are particularly noticeable in adolescents experiencing chronic CVE (Fowler, Tompsett, Braciszewski, Jacques-Tiura, & Baltes, 2009). These effects may be further impacted by the proximity and severity of the violence exposure. Those who are the victims of violence and are exposed to more serious instances of violence may be at greater odds of negative outcomes than those who only witness or hear about violence (Fowler et al., 2009) and those exposed to less serious forms of violence (Goldner, Gross, Richards, & Ragsdale, 2015). Because of the negative effects of CVE, African American adolescents may become less engaged in school and exhibit more risky behaviors (Voisin, Patel, Hong, Takahashi, & Gaylord-Harden, 2016), potentially further perpetuating CVE that can result in chronic exposure (Lambert, Nylund-Gibson, Copeland-Linder, & Ialongo, 2010). Given the elevated risk of CVE for African American adolescents (Richards et al., 2015; Zimmerman & Messner, 2013) and the consequential accompanying adverse outcomes (Fowler et al., 2009; Voisin et al., 2016), focused research examining patterns, chronicity and predictors of CVE for this group of adolescents is merited.
Patterns and Chronicity of CVE
Understanding differences in cross-sectional and longitudinal patterns (e.g., high vs. low or stable vs. transitional) of CVE is pertinent to determining the consequences of exposure and the risk for future exposure. For example, African American youth who are experiencing chronic CVE may face very different outcomes than youth who are experiencing acute episodes of CVE (Lambert et al., 2010). A study by Lambert and colleagues (2010) found that, in a sample of 543 urban African American early adolescents in grades 6 through 8, the majority had stable exposure over time. Adolescents experiencing high levels of CVE at the beginning of the study often remained in the high group, while those in the low CVE group rarely reported an increase in their level of exposure (Lambert et al., 2010). Conversely, in a study of 349 African American adolescents, ages 11 to 17 and living in extreme poverty, Spano, Rivera, Vazsonyi, and Bolland (2012) found one stable trajectory of violence exposure, accounting for 36% of the sample; the remaining 64% experienced fluctuations in CVE.
The differences in CVE stability in Lambert et al. (2010) and Spano et al. (2012) may be attributable to the age of the participants. As adolescents age, the risk of CVE increases. A study of 2,344 adolescents (36% African American), between the ages of 9 and 15, found that a 1-year increase in age was associated with a 21% increase in the odds of CVE (Zimmerman & Messner, 2013). In a study of 241 African American early adolescents (Mage = 12.86), Gaylord-Harden, Dickson, and Pierre (2016) found that among three distinct classes of CVE (i.e., low, moderate, and high), age was significantly associated with an increased risk of being a member of the high exposure class relative to the low exposure class. Of note, Spano and colleagues’ (2012) studied adolescents with a large age range (i.e., ages 9-19), while Lambert and colleagues (2010) studied younger adolescents within a 3-year age range (Mage = 11.76 at beginning of study). Together, the above studies show an array of patterns of CVE for African American youth, yet the actors accounting for the variability are not well established.
The “cumulative effects” model of CVE suggests that CVE may be connected to adolescent psychological well-being via a dose-response mechanism, such that repeated or chronic CVE is associated with more severe psychological symptoms (Lynch, 2003) in studies with predominantly ethnic minority (e.g., African American, multiracial; Kennedy, Bybee, Sullivan, & Greeson, 2010) and predominantly African American samples (Heinze, Stoddard, Aiyer, Eisman, & Zimmerman, 2017). Nationally representative samples of adolescents have shown that cumulative exposure to multiple forms of victimization is associated with more depression (Turner, Finkelhor, & Ormrod, 2006; Zinzow et al., 2009), aggression (Turner et al., 2006), and PTSD (Zinzow et al., 2009). Examining cumulative CVE requires measuring the frequency of exposure over an extended time period (Kennedy & Ceballo, 2014); however, most researchers either measure only the presence or absence of CVE or the frequency of CVE over a short period of time. When studies do utilize multiple waves of data, often researchers compare initial reports of violence at baseline to outcomes in the following waves. However, the effects may be bilateral (Fowler et al., 2009). That is, factors such as aggression and depression, which are typically viewed as outcomes of CVE, may be risk factors for CVE as well. Thus, while there is a spate of literature relative to CVE among African American adolescents and its sequelae, there is a research shortcoming relative to the patterns and cumulative effects of CVE, as well as the individual- and contextual-level factors that may contribute to these nuances.
Predictors of CVE
Individual- and Contextual-Level Factors
Individual and contextual factors may impact the pattern, severity, and chronicity of adolescent CVE. Individual-level factors may include an adolescent’s mental health, behavioral traits, family dynamics, and neighborhood perceptions. Contextual-level factors may include neighborhood economic and social characteristics, including community problems and available community resources.
Individual-level factors.
Internalizing and externalizing symptoms in African American adolescents may be positively associated with CVE in the past year (Fowler et al., 2009) and lifetime (Li, Nussbaum, & Richards, 2007). Specifically, researchers have found depressive symptoms in African American adolescents to be positively related to recent CVE (Shukla & Wiesner, 2015) and lifetime CVE (Bennett & Joe, 2015). Even when controlling for violence exposure in other contexts, Mendelson, Turner, and Tandon (2010) found witnessing community violence to be independently associated with depressive symptoms in African American adolescents. Similarly, researchers have consistently found aggressive behaviors to be positively associated with high levels of CVE. That is, individuals reporting higher levels of aggressive behaviors also report higher levels of CVE. This association has been found among both younger African American adolescents (Farrell, Thompson, Curran, & Sullivan, 2019) and older African American adolescents (Burnside, Gaylord-Harden, So, & Voisin, 2018), reporting both witnessing violence and violent victimization. Overall, prior research has found higher levels of internalizing and externalizing behaviors to be associated with increased CVE.
Violence exposure also is influenced by parental behaviors. Researchers have suggested that adolescents with high levels of parental monitoring may have less CVE because they are less likely to have deviant peers and spend less time in the community where violence occurs (Low & Espelage, 2014). However, this proposed effect may be dependent on age. Spano and colleagues (2012) found a negative correlation between parental monitoring and CVE for younger African American adolescents, yet no link for older African American adolescents. It also may be possible that parental monitoring can better protect against chronic CVE, than a single incident of CVE (Luthar & Goldstein, 2004). While this research suggests that parental monitoring may influence CVE, especially over time, more research is needed to understand this association.
Contextual-level factors.
The neighborhood or environment youth live in may have protective or detrimental effects on CVE. The support and resources available in these contexts may help protect youth from CVE (Gardner & Brooks-Gunn, 2009), whereas the absence of these resources may exacerbate CVE risk and increase racial/ethnic disparities in CVE (Zimmerman & Messner, 2013). Studies in this area are limited and the findings are mixed. For example, in studies of predominantly Hispanic and African American adolescents, neighborhood disadvantage has been found to be associated with witnessing violence (Zimmerman & Messner, 2013), but not with reported victimizations (Gibson, 2012). Jain, Buka, Subramanian, and Molnar (2012) found witnesses and victims, who were disproportionately African American, were both more likely to live in neighborhoods with higher mean concentrated poverty than youth unexposed to violence. Among African American youth who have witnessed violence, CVE has been found to be positively associated with reporting more neighborhood problems (Shukla & Wiesner, 2015) and fewer youth services (Zimmerman & Messner, 2013), regardless of participation in those services (Gardner & Brooks-Gunn, 2009). These studies suggest that characteristics of the neighborhood, such as poverty and availability of resources, may contribute to levels of CVE.
Severity of Violence Exposure
The negative outcomes of CVE and risk of chronic CVE also may be impacted by the severity and proximity of violence exposure. Goldner et al. (2015) examined the mental and behavioral effects of African American youth, depending on the exposure severity (i.e., moderate or severe) and type (i.e., witnessing or victimization). They found that the severe types of exposure predicted depression, PTSD, and delinquency, but the moderate witnessing group did not predict any of the examined outcomes. It is worth noting that Lambert and colleagues (2010) did not find different classifications of youth based on type of exposure, though they hypothesized this may have been due to the co-occurrence of types of CVE, such that youth were unlikely to report only victimization or only having witnessed violence.
Researchers also have found that victims of community violence are more likely than those who only witness or hear about violence to later perpetrate violence (Kimonis et al., 2011) or become victims of violence again (Elsaesser, Hong, & Voisin, 2016). While these studies suggest that those exposed to severe incidents of violence and/or direct victimization may be at higher risk for chronic exposure, there is a dearth of research examining the effects of types and severity of CVE over time.
Present Study
Given the serious cumulative effects of CVE, it is important to consider risk factors for differential cross-sectional and longitudinal patterns of exposure to CVE. To enhance our understanding of CVE risk factors, both individual- and contextual-level factors should be examined, over time, to assess changes in CVE and differences in the severity of CVE. While some longitudinal CVE studies have exclusively focused on African American participants (Lambert et al., 2010; Spano et al., 2012) and included contextual neighborhood factors (Jain et al., 2012), few investigators have done both with a sample of high school-aged African American adolescents.
The present study addresses the current research gap, drawing on a sample of urban African American ninth graders who live in low-resourced neighborhoods. The adolescents were followed through 10th grade, to examine patterns, severity, and chronicity of violence exposure, in addition to the influence of individual- and contextual-level factors on CVE. Latent Transition Analysis was used to identify cross-sectional patterns of CVE and changes in CVE patterns over time, as well as to examine the effects of individual and contextual factors on these patterns. We predicted that factors such as sex, depressive symptoms, aggression, parental monitoring, community problems, and community resources would influence the likelihood of violence exposure. Given the small age range in our sample, we predicted that patterns of CVE among our sample of African American adolescents would be generally stable over time.
Method
Participants
Participants were recruited as part of a larger randomized controlled efficacy trial of a preventive intervention for African American adolescents. Data collection began in 2014 and concluded in 2016. Participants were recruited during their ninth-grade year. Participants were included in the study if they returned signed parent/guardian permission and student assent forms and if they were enrolled ninth-grade students at a participating high school. A total of 408 adolescents were recruited (74.52% of eligible students); however, only African American participants were utilized in this study. Of the 408 participants recruited, 327 identified as African American. The majority of the African American participants were female (56.60%) and the average age was 14.54 (SD = 0.59). Most of the African American participants in this study lived in households that received food stamps (n = 267; 81.7%).
Procedure
All study procedures were approved by the Institutional Review Board at DePaul University and by the local school district’s Research Review Board. Participants were recruited from four public high schools in a large Midwestern city. High schools with a majority African American student enrollment were selected for participation. The schools were located in low-resourced neighborhoods that also had high rates of reported community violence. Each school was located in a neighborhood with rates of community violence that ranged from 9.1 to 15.2 violent crimes per 1,000 residents. In participating schools, 89.1% to 98.6% of students lived in families with 185% of the federal poverty line. Ninth-grade students were recruited at the beginning of their freshman year and were followed through their 10th-grade year. These participants were assessed by research staff, using a two-step procedure. As part of the procedure of the parent study, participants first completed a brief screener survey to assess imminent suicide risk. Students identified as at imminent risk for suicide were discontinued in the study and referred to the school-based health center (SBHC) for risk assessment and appropriate follow-up services. Those participants who were not deemed at imminent risk for suicide then completed a baseline assessment to measure community violence exposure and other study-specific variables. At the completion of the pre-intervention baseline phase of the study, participants were randomized to either the intervention condition or a standard care control condition. After the screening assessment, participants were assessed a total of four times: (a) baseline (i.e., Wave 1), (b) immediately post-intervention (i.e., Wave 2), (c) 6 months after completion of the intervention (i.e., Wave 3), and (d) 12 months after completion of the intervention (i.e., Wave 4). Participants received $7 for completing the brief screener survey and $15 for completing each of the four waves of assessments.
Measures
Demographic and background information.
Demographic information was obtained using 17 items assessing a range of variables, including age, sex, ethnicity, religious involvement, family size/constellation, parent employment, highest level of parental education, and household income.
Community violence exposure.
Exposure to community violence was measured using the Children’s Report of Exposure to Violence (CREV; Cooley, Turner, & Beidel, 1995). The CREV is a 25-item self-report measure of violence exposure. Participants respond to items about how frequently they have been exposed to violence on a 5-point Likert-type scale, ranging from 1 = no, never to 5 = every day. Example items included “how many times have you seen somebody you know being beaten up,” “how many times have you seen somebody you know being shot or stabbed,” and “how many times have you been robbed or mugged?” In a sample of predominantly African American children and adolescents (n = 228), the CREV demonstrated good 2-week test-retest reliability (r = .75), internal consistency (α = .78), and exploratory factor analysis suggested adequate construct validity (Cooley et al., 1995). The internal consistency of the CREV in the current study was .93.
The CREV assesses four factors of violence exposure (i.e., media, hearing about violence, direct witnessing of violence, and direct experience of violent victimization). Due to the ubiquity of hearing about violence from others and through the media in this population, only the factors associated with direct witnessing of violence and violent victimization were used. In their study examining CVE stability in younger adolescents, Lambert and colleagues (2010) dichotomized seven exposure variables (four variables measuring witnessing CVE and three variables measuring victimization) to indicate whether or not each event had been experienced. Following the method of Lambert et al. (2010), seven items associated with either witnessing (i.e., witnessing someone being beaten up, robbed or mugged, shot or stabbed, or killed) or victimization (i.e., being beaten, robbed or mugged, shot or stabbed) were recoded to indicate whether or not participants had experienced each event. Each variable was recoded, such that a value of zero indicated no experience with the violent act, while a value of one indicated that the participant had experienced that violent act.
Aggression.
The Buss-Perry Aggression Questionnaire - Short Form (BPAQ-SF) was used to measure general aggression (Bryant & Smith, 2001). The BPAQ-SF is a 12-item, self-report inventory of aggression. Items are measured on a 5-point scale, ranging from 1 = very unlike me to 5 = very like me. Example items included “Sometimes I fly off the handle for no good reason,” “I have trouble controlling my temper,” and “There are people who pushed me so far that we came to blows.” Items were summed to create a total aggression score, with higher scores indicating higher levels of aggression. The BPAQ-SF has reported good internal consistency estimates (i.e., ranging from .70 to .83) and shown strong correlations with other measures of anger and aggression (Bryant & Smith, 2001). In the current study, the internal consistency was .91.
Depressive symptoms.
Depressive symptoms were measured using the Center for Epidemiological Studies – Depression Scale (CES-D; Radloff, 1977). The CES-D is a 20-item scale measuring the frequency of depressive symptoms in the past week. Items were rated on a 4-point Likert scale (0 = rarely or none of the time to 3 = most of the time). Example items included “I felt depressed,” “I had trouble keeping my mind on what I was doing,” and
“I felt that I could not shake off the blues even with help from my family or friends.” Several items were reverse coded, and all items were summed to create a total score. Higher scores indicated higher levels of depressive symptoms. The CES-D has demonstrated good internal consistency (α = .85-.90; Radloff, 1977). In a sample of adolescents (n = 2,416), factorial validity analysis supported the factor structure of the CES-D and factorial invariance both longitudinally and between boys and girls (Motl, Dishman, Birnbaum, & Lytle, 2005). In the current study, the internal consistency of the CES-D was .86.
Community problems and resources.
Community problems and resources were measured using self-report measures created by Tolan, Gorman-Smith, and Henry (2001). These constructs were measured only at Wave 1. The community problems measure included 14 items. Items were rated on a 5-point scale. Participants responded to each item by identifying the degree to which they agreed that various community issues were problems in their community such as crime, vacant lots, and vandalism. Example items included “vacant lots are a problem on my block,” “abandoned or boarded-up homes are a problem on my block,” and “crime has gotten worse in my neighborhood in the last few years.” Items were averaged to create a mean score. The community problems measure has demonstrated acceptable internal consistency when used with youth (α = .78; Tolan et al., 2001). In the current study, the internal consistency was somewhat low (α = .50).
Community resources were measured using nine items created by Tolan et al. (2001). Items were used to determine whether resources were located within the participant’s neighborhood or convenient to the participant. Each item was rated either yes = 1 or no = 0. Example items included “there is a clinic or other medical services near my neighborhood,” “there are parks that we can use in or near my neighborhood,” and “there are neighborhood or block organizations that deal with neighborhood issues or problems.” Responses were averaged to create a mean score for community resources. Higher scores indicated higher levels of neighborhood problems or resources. The community resources measure has demonstrated somewhat low internal consistency (α = .58; Tolan et al., 2001), likely due to the variability in resources gauged by the items. In the current study, the internal consistency was .52.
Parental monitoring.
Parental monitoring was measured using the Parental Monitoring Scale (PMS; Small & Kerns, 1993). The PMS is a youth-report, 8-item Likert type scale used to measure youths’ perceptions of parental tracking behavior and knowledge of social activities. Participants respond to items on a 5-point scale (0 = Never to 4 = Always). Example items included “my parent(s) usually know what I am doing after school,” “my parent(s) know who my friends are,” and “I talk to my parent(s) about the plans I have with my friends.” The PMS has evidenced high internal consistency (α = .87) and predictive validity through a stepwise discriminant analysis that identified it as a protective factor for unwanted sexual activity (Small & Kerns, 1993). In the current study, internal consistency of the PMS was .83.
Analytic Strategy
Latent transition analysis (LTA) was utilized, to examine the study’s hypotheses. For this study, a step-by-step model was followed to determine correct specification of the measurement and structural models (Nylund, 2007). All models were estimated using Mplus Version 8.3 (Muthén & Muthén, 1998-2017), using full information maximum likelihood (FIML) estimation. FIML estimation tends to perform similarly to other missing data techniques, such as multiple imputation (Newman, 2003). However, when applied to data sets with high levels of missingness, FIML generally exhibits higher power to reject misspecified models compared to multiple imputation (Enders & Mansolf, 2018). Latent class analysis (LCA) was used to determine the measurement model at each wave. For each measurement point, multiple class structures were examined and evaluated to determine the best model. Models were evaluated by examining fit indicators (i.e., Bayesian Information Criteria [BIC]; bootstrap likelihood ratio test [BLRT]) and interpretability. For the BIC, lower values indicated a better fitting model. For the BLRT, a significant p-value indicated that the current class model was a better fit than the model with one less class.
Following the determination of measurement models at each time point, the structural model was examined using LTA. Transition probabilities between classes were estimated for adjacent time points. Both time-varying and time-invariant covariates were examined to determine their effects on classification at each stage.
Results
Descriptive Statistics
Complete data, for the variables of interest, was available for 182 of the 327 African American adolescents enrolled in the study, and these adolescents comprised the analytic sample. The decrease in sample size for this study, from 327 to 182, represents attrition associated with longitudinal study participation and non-response on model covariates. Participants were not included in analyses if they were missing data on any of the model covariates. No significant differences were found between those included in the analytic sample and those not included on baseline CVE indicators (witnessing someone being beaten up: χ2 [1] = 2.82, p = .093; witnessing robbing or mugging: χ2 [1] = 2.47, p = .116; witnessing shooting or stabbing: χ2 [1] = 2.33, p = .127; witnessing killing: χ2 [1] = 1.13, p = .288; being beaten: χ2 [1] = 0.13, p = .718; being robbed or mugged: χ2 [1] = 0.90, p = .343; being shot or stabbed: χ2 [1] = 1.58, p = .209) or covariates (depression: t(311) = −1.75, p = .081, parental monitoring: t(311) = 1.92, p = .056; aggression: t(311) = −0.97, p = .334; intervention condition: χ2 [1] = 1.37, p = .242; community problems: t(325) = 1.55, p = .123; community resources: t(325) = 1.48, p = .141; sex: χ2 [1] = 0.00, p = .994). In this study, CVE indicators were included along with time-varying and time-invariant covariates. Descriptive statistics are presented in Table 1.
Table 1.
Descriptive Statistics for Community Violence Exposure Indicators and Time-Varying Covariates
| Wave 1 | Wave 2 | Wave 3 | Wave 4 | |
|---|---|---|---|---|
|
| ||||
| Indicators | f (%) | f (%) | f (%) | f (%) |
| Witness someone beaten up | 156 (85.71) | 126 (69.23) | 115 (63.19) | 124 (68.13) |
| Witness robbing or mugging | 77 (42.31) | 99 (54.40) | 74 (40.66) | 98 (53.85) |
| Witness shooting or stabbing | 75 (41.21) | 83 (45.60) | 69 (37.91) | 93 (51.10) |
| Witness killing | 48 (26.37) | 72 (39.56) | 60 (32.97) | 75 (41.21) |
| Victim of beating | 64 (35.16) | 54 (29.67) | 47 (25.82) | 51 (28.02) |
| Victim of robbery/mugging | 31 (17.03) | 40 (21.98) | 32 (17.58) | 34 (18.68) |
| Victim of shooting/stabbing | 17 (9.34) | 34 (18.68) | 24 (13.19) | 28 (15.38) |
|
| ||||
| Time-Varying Covariates | M (SD) | M (SD) | M (SD) | M (SD) |
|
| ||||
| Depression | 16.35 (9.52) | 17.43 (9.42) | 16.95 (8.65) | 16.33 (9.28) |
| Parental Monitoring | 3.10 (0.67) | 3.07 (0.76) | 2.98 (0.81) | 3.02 (0.81) |
| Collective Efficacy | 2.50 (0.51) | 2.39 (0.52) | 2.32 (0.43) | 2.31 (0.47) |
| Aggression | 28.00 (11.76) | 28.47 (12.50) | 28.37 (12.38) | 29.65 (11.84) |
|
| ||||
| Time-Invariant Covariates | M (SD) | |||
|
| ||||
| Community Problems | 3.11 (0.51) | |||
| Community Resources | 0.55 (0.20) | |||
|
| ||||
| f (%) | ||||
|
| ||||
| Sex | 103 (56.59) | |||
Measurement Model
First, the measurement model for each wave was assessed. Multiple LCAs were conducted to identify which class structure best fit the CVE data. Five LCA models were estimated at each wave, starting with a 1-class model up to a 5-class model. Model fit statistics for each class model were examined and compared to determine the best fitting class structure at each wave (see Table 2).
Table 2.
Model Fit Indices for Latent Class Analysis Models with 1-5 Classes for Each Time Point
| 1 Class | 2 Classes | 3 Classes | 4 Classes | 5 Classes | |
|---|---|---|---|---|---|
| Wave 1 | |||||
| Log likelihood | −1283.84 | −1129.61 | −1103.51 | −1080.78 | −1075.66 |
| BIC | 2608.21 | 2346.07 | 2340.18 | 2341.05 | 2377.12 |
| BLRT | N/A | 0.000 | 0.000 | 0.000 | 0.667 |
| Wave 2 | |||||
| Log likelihood | −1186.61 | −930.82 | −884.02 | −862.12 | −853.48 |
| BIC | 2412.49 | 1945.79 | 1897.05 | 1898.13 | 1925.73 |
| BLRT | N/A | 0.000 | 0.000 | 0.000 | 0.050 |
| Wave 3 | |||||
| Log likelihood | −915.04 | −734.00 | −699.75 | −685.98 | −675.90 |
| BIC | 1867.93 | 1549.10 | 1523.86 | 1539.59 | 1562.68 |
| BLRT | N/A | 0.000 | 0.000 | 0.000 | 0.000 |
| Wave 4 | |||||
| Log likelihood | −822.00 | −662.40 | −625.57 | −605.68 | −597.34 |
| BIC | 1680.92 | 1403.90 | 1372.41 | 1374.83 | 1400.32 |
| BLRT | N/A | 0.000 | 0.000 | 0.000 | 0.050 |
Model fit statistics for Wave 1 class structures seem to favor the 3-class and 4-class models. In Wave 1, the 3-class model evidenced the lowest BIC and a significant BLRT. However, the BLRT was significant for the 4-class model, indicating better fit relative to the 3-class model. Examining the structure of the 4-class model, it was evident that the additional class did not substantially differ from the classes in the 3-class model. Since the 3-class model had the lowest BIC and better interpretability, we determined that the 3-class model best fit the data. Results for Waves 2, 3, and 4 utilized the same process and also indicated a 3-class model.
The 3-class models were then interpreted for each wave (see Figure 1 for profile plots). For Wave 1, classes were differentiated based on levels of witnessing and being a victim of violent events. One class indicated low probability of witnessing violent acts and being a victim of violent acts. Due to the low probability of exposure across all indicators, this class was labeled “low witnessing, low victimization” (LW-LV). The second class indicated a high probability of witnessing violence, but a relatively low probability of being a victim of violence. This class was labeled “High witnessing, low victimization” (HW-LV). The last class identified indicated a high probability of witnessing violence and a high probability of being a victim of violence. This class was labeled “high witnessing, high victimization” (HW-HV). The class structures at subsequent waves indicated very similar patterns to those of Wave 1; thus, classes in Waves 2, 3, and 4 were labeled the same as those of Wave 1. While the patterns were similar across waves, proportions of participants in each class varied slightly across waves (see Table 3).
Figure 1.
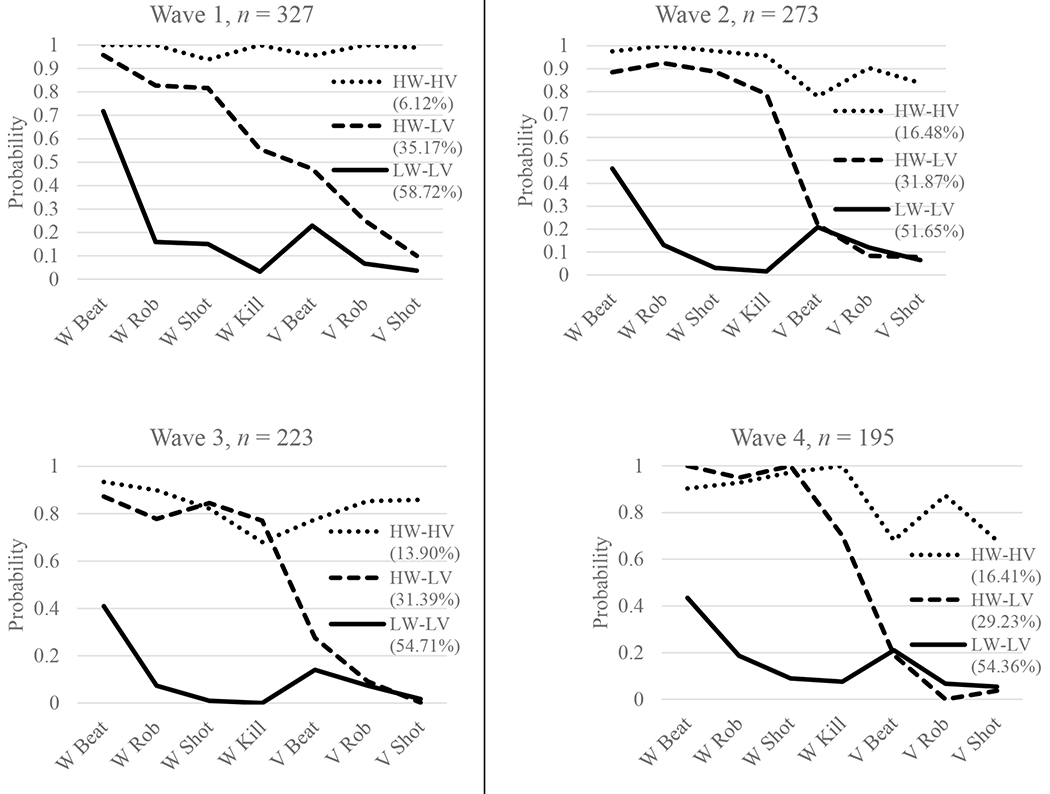
Conditional item probability profile plots for 3-class solutions, Waves 1 through 4. Higher probability indicates greater likelihood of experiencing violent event. HW-HV = high witnessing, high victimization; HW-LV = high witnessing, low victimization; LW-LV = low witnessing, low victimization. W Beat = witness beating; W Rob = witness robbery; W Shot = witness shooting or stabbing; W Kill = witness killing; V Beat = victim of beating; V Rob = victim of robbery; V Shot = Victim of shooting or stabbing.
Table 3.
Percentages of Participants in CVE Classes at Each Wave and Transition Probabilities for the 3-Class LTA Model with Covariates
| CVE Class Membership | ||||
|---|---|---|---|---|
| Wave 1 | Wave 2 | Wave 3 | Wave 4 | |
|
| ||||
| LW-LV | 54.90% | 47.30% | 55.85% | 53.54% |
| HW-LV | 38.65% | 41.07% | 29.86% | 31.40% |
| HW-HV | 6.46% | 11.63% | 14.29% | 15.06% |
|
| ||||
| Transition Probabilities | ||||
|
| ||||
| LW-LV | HW-LV | HW-HV | ||
|
| ||||
| Wave 1 | Wave 2 | |||
|
| ||||
| LW-LV | 0.696 | 0.229 | 0.075 | |
| HW-LV | 0.208 | 0.644 | 0.148 | |
| HW-HV | 0.162 | 0.554 | 0.284 | |
|
| ||||
| Wave 2 | Wave 3 | |||
|
| ||||
| LW-LV | 0.752 | 0.208 | 0.040 | |
| HW-LV | 0.423 | 0.414 | 0.163 | |
| HW-HV | 0.249 | 0.260 | 0.491 | |
|
| ||||
| Wave 3 | Wave 4 | |||
|
| ||||
| LW-LV | 0.732 | 0.188 | 0.080 | |
| HW-LV | 0.267 | 0.587 | 0.145 | |
| HW-HV | 0.328 | 0.236 | 0.436 | |
*Note: LW-LV = Low witnessing, low victimization; HW-LV = high witnessing, low victimization; HW-HV = high witnessing, high victimization. Table depicts transition probabilities for adjacent time points. Earlier time points are represented in rows, and later time points are represented in columns.
Structural Model
LTA models were examined to determine transitions between classes and covariate influence on class. Prior to examining the structural model with covariates, measurement invariance of class structure was tested (Nylund, 2007). Full measurement invariance was tested by fixing measurement parameters for each class to equality over time. This invariant model was compared to a model where measurement parameters were freely estimated over time. Results indicated a significant decrease in fit by assuming measurement invariance (χ2diff = 168.42, df = 63, p < .001). Partial measurement invariance was then tested. Items with low in-class range of probabilities across waves were fixed to equality over time. Specifically, in the LW-LV class, four items were fixed: witness killing, victim beating, victim robbing, victim shooting. In the HW-LV class, one item was fixed: victim shooting. Lastly, for the HW-HV class, one item was fixed: witness beating. Relative to the freely estimated model, this model with partial measurement invariance indicated no significant decrease in fit, χ2diff = 25.84, df = 18, p = .103.
After establishing partial measurement invariance, LTA models were examined to determine transition probabilities over time and the impact of time-varying and time-invariant covariates on class membership, controlling for intervention effects. Proportions of participants in each class in the full LTA model are given in Table 3. The LW-LV class was the largest class consistently, followed by the HW-LV class, then the HW-HV class, although proportions within each class varied over time points. Estimated transition probabilities between adjacent waves may be found in Table 3. In general, the probability of staying in a class across waves, rather than transition into a different class, was highest. However, in some instances, there was a higher probability of transitioning into a different class at later waves.
Longitudinal CVE patterns also were examined. Since there were four waves of data collection and 3 classes of CVE at each wave, there were a total of 81 possible transition patterns. Due to the large number of possible transition patterns, only the most prevalent transition patterns are discussed here. Also, patterns are discussed in terms of general trends over time: increasing CVE, decreasing CVE, or stability of CVE. The largest transition pattern consisted of participants who stayed in the LW-LV class at all four waves. A total of 25.82% of participants were included in this transition pattern. The second largest transition pattern consisted of participants who stayed in the HW-LV class over time (6.59%). The third largest transition pattern consisted of participants who were in the HW-LV class in Waves 1 and 2, then transitioned into the LW-LV class for Waves 3 and 4 (6.04%).
Given the number of possible transition patterns, generalized patterns also were examined to identify trends in increasing, decreasing, or stable violence exposure. Of the whole sample, 33.5% (n = 61) of participants experienced stable violence exposure across all four waves. The remaining participants experienced at least one transition. A total of 17% of participants experienced each class of violence exposure at some point. An examination of pairwise transitions (e.g., Wave 1 to Wave 2) identified that the majority of participants (58.8-64.8%) were stable across two waves. However, since only 33.5% of participants were stable over time, it may be that those who were stable over two time points were unstable in their violence exposure at other time points. Additionally, 29.7% of participants were in the HW-HV class at some point during the study.
Lastly, we examined the influence of time-invariant and time-varying covariates on class membership. Odds ratios were calculated for each covariate, examining the likelihood that a person would be in one class compared to the HW-HV class. Intervention condition, sex, parental monitoring, and aggression did not significantly predict class membership at any wave. There were significant results for community resources, community problems, and depressive symptoms. Participants who reported more community resources were less likely to be in the LW-LV class compared to the HW-HV class at Wave 1 (OR = 0.18, p = .046) and at Wave 3 (OR = 0.08, p < .001). Participants who reported more community problems at Wave 1 were less likely to be in the LW-LV class (OR = 0.23, p < .001) or in the HW-LV class (OR = 0.30, p < .001) compared to the HW-HV class at Wave 2 and at Wave 4 (LW-LV: OR = 0.24, p < .001; HW-LV: OR = 0.17, p < .001). Lastly, participants who reported more depressive symptoms were less likely to be in the LW-LV class (OR = 0.89, p = .003) or in the HW-LV class (OR = 0.92, p = .003) at Wave 2. Participants who reported more depressive symptoms at Wave 4 were less likely to be in the LW-LV class compared to the HW-HV class (OR = 0.92, p = .004).
Discussion
This longitudinal study examined cross-sectional and longitudinal patterns of community violence exposure, as well as the influence of individual- and contextual-level factors on CVE, in a sample of African American ninth-grade adolescents who were followed over a 24-month period. At each time point, three patterns of community violence exposure were identified: (a) low witnessing and low victimization (LW-LV), (b) high witnessing and low victimization (HW-LV), and (c) high witnessing and high victimization (HW-HV). One-third of participants reported stable CVE across all time points, partially supporting our hypothesis that CVE patterns would be generally stable over time. On the other hand, two-thirds of the sample experienced at least one transition across waves. This suggests that, although stability of CVE may be expected in the short term (i.e., over the course of one year), we can expect some fluctuation over longer periods of time. The most prevalent transition pattern was individuals in the LW-LV class with stable exposure over time, and the majority of adolescents experienced some change in exposure. Nearly one-third of participants were in the HW-HV group at some point. Hypotheses of individual- and contextual-level factors that would influence CVE also were only partially supported. We hypothesized that individual-level factors (i.e., sex, depressive symptoms, aggression, parental monitoring) and contextual-level factors (i.e., community problems and community resources) would influence the likelihood of violence exposure. Within our sample, only depression, community problems, and community resources influenced the likelihood of CVE patterns.
Our study and that of Lambert et al. (2010) were similar in how they defined CVE (i.e., witnessing violence and violent victimization) and measurement of CVE (i.e., CREV), yet differences were observed relative to the number of classes identified and the proportion of adolescents experiencing stable CVE. Lambert et al. (2010) only identified two classes of exposure, specifically high exposure (HE) and low exposure (LE), in contrast to this study’s identification of three classes of exposure (i.e., LW-LV, HW-LV, HW-HV). Additionally, in Lambert and colleagues’ (2010) study, 78% of participants had stable patterns of CVE. In the current study, only 33.5% of participants experienced stable CVE patterns. We note that the participants in the Lambert et al. (2010) study were younger (i.e., grades 6-8; Mbaseline = 11.76 years old) than those of this study (i.e., grades 9 and 10; Mbaseline = 14.54 years old). Conceivably, age may influence the categorization of exposure for youth in two primary ways. As adolescents age, the risk of CVE increases (Zimmerman & Messner, 2013). Also, age may predict exposure to more severe community violence (i.e., victimization rather than witnessing; Gaylord-Harden et al., 2016). Additionally, the data analyzed by Lambert et al. (2010) was collected nearly 20 years ago. In contrast, the data collection for the current study began in 2014. The stressors faced by this population, as well as the temporal social ecological factors affecting CVE, may have changed. The increases in exposure that are associated with age and the recency of the current study may explain this study’s identification of three, rather than two, classes of exposure.
In addition to patterns of community violence exposure, we examined whether individual- and contextual-level factors impacted the likelihood of being in either the LW-LV group or the HW-LV group, relative to the HW-HV group. Reporting more community problems, having access to more community resources, and greater depressive symptoms were associated with a decreased likelihood of being in either the LW-LV or HW-LV group. Participants who reported more community problems, access to community resources, and more depressive symptoms were more likely to experience violent victimization. Contrary to our predictions, parental monitoring and sex of the participant did not significantly predict CVE class membership at any wave. It may be that the impact of parental monitoring and sex differences on CVE are less relevant when considered in conjunction with other individual and contextual factors. It also may be possible that simply tracking social activities is not enough as adolescents age and develop. Instead, parental messaging about approval or disapproval of violence may be more predictive of exposure. A study of Black adolescent males in an under-resourced neighborhood found that their perception of parental expectations related to violence (e.g., “Do your parents want you to stay away from situations where you could get into a fight?”) significantly predicted their self-efficacy in avoiding violence (Thomas et al., 2016). Related, parents may endorse gendered attitudes about violence that can impact parenting behaviors related to restrictiveness and unstructured socializing and subsequent exposure to violence (Antunes et al., 2020). Future studies should consider parental attitudes and messaging surrounding parenting behaviors and child coping strategies in response to violence exposure.
Similar to the findings of Lambert and colleagues (2010), depressive symptoms were found to increase the likelihood of classification to the HW-HV group. The significance of depression in predicting CVE patterns is consistent with previous findings (Bennett & Joe, 2015; Shukla & Wiesner, 2015). On the other hand, the finding that both community problems and community resources increased the likelihood of classification to the HW-HV group is counterintuitive. The association between higher community problems and higher levels of CVE is consistent with previous literature (Shukla & Wiesner, 2015). Zimmerman and Messner (2013) found that a deficiency in or less access to youth services (e.g., after-school programs, mental health services) accounted for disparities in community violence exposure among Black and White adolescents. Community problems may lead to the allocation of resources to these communities, thereby explaining our finding. Greater access to resources may not necessarily decrease one’s exposure to violence, however, they may provide youth with opportunities to develop coping strategies that could help buffer the effects of violence exposure.
Strengths and Limitations
This longitudinal study of CVE among African American adolescents expands our understanding of changes in the patterns and chronicity of violence exposure over time and associated psychological factors. Our longitudinal assessment (i.e., LTA) of CVE allowed us to examine the severity of community violence exposure cross-sectionally, the stability of community violence exposure longitudinally, and the influence of individual- and contextual-level factors on CVE. Given the complex nature of CVE, understanding the diverse set of factors that impact one’s exposure and victimization is crucial to understanding and addressing CVE.
There were several limitations to this study. First, community problems and resources were only measured at Time 1. This did not allow for the measurement of neighborhood-level change, or the impact of such changes on CVE patterns over time. Second, this study examined specific types of CVE. An examination of more distinct types of violence (e.g., sexual assault) may result in different patterns of CVE or changes in CVE patterns over time. Third, this study focused on a small age range of adolescents. Future research may benefit from examining CVE across different phases of adolescence, particularly relative to major life transitions or events (e.g., moving from middle school to high school, before and after COVID-19). Finally, participant attrition over time decreased the sample size from 327 to 182. For this study, assessments were completed at participating schools during the school day. While every effort was made to assess all participating students, they were not assessed if a student was no longer enrolled at a participating school, was not in attendance on the days in which assessments occurred, or had dropped out of school. While there were no significant differences between those included in LTA models and those not included on relevant study variables, it is possible that levels of community violence exposure changed for those no longer participating in the study. As such, these results, including CVE classifications, transitions, and associations represent students who were enrolled in participating schools throughout the study. In future studies, efforts should be made to follow students who transfer schools or drop out of schools. Such efforts would assist in generalizing findings to more adolescents and increasing statistical power to find existing associations in the population.
Future Research
The current findings highlight the need for future research on community violence exposure among African American adolescents, particularly as it relates to chronic exposure and the association between context and exposure. Given the various classes of violence exposure identified and the transitions adolescents experience in their exposure, future research may examine the impact of such trajectories on proximal and distal outcomes, such as depression, anxiety, PTSD, and suicidal ideation and behavior. It may be that chronically high exposure, or exposure that increases over time, may have different impacts on mental and physical health among African American adolescents. Additionally, mixed methods approaches to studying community violence exposure may provide unique opportunities to contextualize adolescents’ experiences and better understand how community or neighborhood factors, such as community problems or resources, affect such exposure.
In conclusion, the current findings suggest that for African American adolescents, who often experience high levels of exposure to community violence, exposure may vary over time and be influenced by both individual- and contextual-level factors. Identifying specific risk factors associated with more chronic and severe exposure may guide preventive intervention efforts. Community-engaged, culturally-grounded interventions that seek to address risk factors associated with CVE may aid in protecting youth from community violence exposure or reducing the impact of such exposure.
Acknowledgements
We thank the adolescents who participated in this project, as well as their parents/guardians. We sincerely appreciate the participating schools and school-based health centers who supported the completion of the study.
Funding:
This work was supported by the Eunice Kennedy Shriver National Institute of Child Health and Human Development [grant number HD072293] and the National Institute of Mental Health [grant number MH118382].
Contributor Information
Christopher R. Whipple, Department of Psychology, Penn State Harrisburg, Middletown, PA, USA
W. LaVome Robinson, Department of Psychology, DePaul University, Chicago, IL, USA.
Leonard A. Jason, Department of Psychology, DePaul University, Chicago, IL, USA
Övgü Kaynak, Department of Psychology, Penn State Harrisburg, Middletown, PA, USA.
Chelsea W. Harris, Department of Psychology, DePaul University, Chicago, IL, USA
Simone P. Grisamore, Department of Psychology, DePaul University, Chicago, IL, USA
Melinda N. Troyka, Department of Psychology, DePaul University, Chicago, IL, USA
References
- Antunes MJL, Ahlin EM, Emmert AD, & Manasse M (2020). Gender differences in youth exposure to community violence: A partial test of power-control theory. Feminist Criminology, 15(2), 123–146. [Google Scholar]
- Bennett MD, & Joe S (2015). Exposure to community violence, suicidality, and psychological distress among African American and Latino youths: Findings from the CDC Youth Violence Survey. Journal of Human Behavior in the Social Environment, 25(8), 775–789. [Google Scholar]
- Bryant FB, & Smith BD (2001). Refining the architecture of aggression: A measurement model for the Buss-Perry Aggression Questionnaire. Journal of Research in Personality, 35(2), 138–167. [Google Scholar]
- Burnside AN, Gaylord-Harden NK, So S, & Voisin DR (2018). A latent profile analysis of exposure to community violence and peer delinquency in African American adolescents. Children and Youth Services Review, 91, 196–203. [Google Scholar]
- Cooley MR, Turner SM, & Beidel DC (1995). Assessing community violence: The children’s report of exposure to violence. Journal of the American Academy of Child & Adolescent Psychiatry, 34(2), 201–208. [DOI] [PubMed] [Google Scholar]
- Elsaesser C, Hong JS, & Voisin DR (2016). Violence exposure and bullying among African American adolescents: Examining the protective role of academic engagement. Children and Youth Services Review, 70, 394–402. [Google Scholar]
- Enders CK, & Mansolf M (2018). Assessing the fit of structural equation models with multiply imputed data. Psychological Methods, 23(1), 76–93. [DOI] [PubMed] [Google Scholar]
- Farrell AD, Thompson EL, Curran PJ, & Sullivan TN (2019). Bidirectional relations between witnessing violence, victimization, life events, and physical aggression among adolescents in urban schools. Journal of Youth and Adolescence, 49, 1309–1327. [DOI] [PMC free article] [PubMed] [Google Scholar]
- Fowler PJ, Tompsett CJ, Braciszewski JM, Jacques-Tiura AJ, & Baltes BB (2009). Community violence: A meta-analysis on the effect of exposure and mental health outcomes of children and adolescents. Development and Psychopathology, 21(1), 227–259. [DOI] [PubMed] [Google Scholar]
- Gardner M, & Brooks-Gunn J (2009). Adolescents’ exposure to community violence: Are neighborhood youth organizations protective? Journal of Community Psychology, 37(4), 505–525. [DOI] [PMC free article] [PubMed] [Google Scholar]
- Gaylord-Harden NK, Cunningham JA, & Zelencik B (2011). Effects of exposure to community violence on internalizing symptoms: Does desensitization to violence occur in African American youth? Journal of Abnormal Child Psychology, 39, 711–719. [DOI] [PubMed] [Google Scholar]
- Gaylord-Harden NK, Dickson D, & Pierre C (2016). Profiles of community violence exposure among African American youth: An examination of desensitization to violence sing latent class analysis. Journal of Interpersonal Violence, 31(11), 2077–2101. [DOI] [PubMed] [Google Scholar]
- Gibson CL (2012). An investigation of neighborhood disadvantage, low self-control, and violent victimization among youth. Youth Violence and Juvenile Justice, 10(1), 41–63. [Google Scholar]
- Goldner J, Gross IM, Richards MH, & Ragsdale BL (2015). The relation of severity and type of community violence exposure to emotional distress and problem behaviors among urban African American adolescents. Violence and Victims, 30(3), 432–449. [DOI] [PubMed] [Google Scholar]
- Heinze JE, Stoddard SA, Aiyer SM, Eisman AB, & Zimmerman MA (2017). Exposure to violence during adolescence as a predictor of perceived stress trajectories in emerging adulthood. Journal of Applied Developmental Psychology, 49, 31–38. [DOI] [PMC free article] [PubMed] [Google Scholar]
- Jain S, Buka SL, Subramanian SV, & Molnar BE (2012). Protective factors for youth exposed to violence: Role of developmental assets in building emotional resilience. Youth Violence and Juvenile Justice, 10(1), 107–129. [Google Scholar]
- Kennedy AC, Bybee D, Sullivan CM, & Greeson M (2010). The impact of family and community violence on children’s depression trajectories: Examining the interactions of violence exposure, family social support, and gender. Journal of Family Psychology, 24, 197–207. [DOI] [PubMed] [Google Scholar]
- Kennedy TM, & Ceballo R (2014). Who, what, when, and where? Toward a dimensional conceptualization of community violence exposure. Review of General Psychology, 18(2), 69–81. [Google Scholar]
- Kimonis ER, Ray JV, Branch JR, & Cauffman E (2011). Anger mediates the relation between violence exposure and violence perpetration in incarcerated boys. Child Youth Care Forum, 40, 381–400. [Google Scholar]
- Lambert SF, Nylund-Gibson K, Copeland-Linder N, & Ialongo NS (2010). Patterns of community violence exposure during adolescence. American Journal of Community Psychology, 46(3-4), 289–302. [DOI] [PMC free article] [PubMed] [Google Scholar]
- Li ST, Nussbaum KM, & Richards MH (2007). Risk and protective factors for urban African-American youth. American Journal of Community Psychology, 39, 21–35. [DOI] [PubMed] [Google Scholar]
- Low S, & Espelage D (2014). Conduits from community violence exposure to peer aggression and victimization: Contributions of parental monitoring, impulsivity, and deviancy. Journal of Counseling Psychology, 61(2), 221. [DOI] [PubMed] [Google Scholar]
- Luthar SS, & Goldstein A (2004). Children’s exposure to community violence: Implications for understanding risk and resilience. Journal of Clinical Child and Adolescent Psychology, 33(3), 499–505. [DOI] [PMC free article] [PubMed] [Google Scholar]
- Lynch M (2003). Consequences of children’s exposure to community violence. Clinical Child and Family Psychology Review, 6, 265–274. [DOI] [PubMed] [Google Scholar]
- Mendelson T, Turner AK, & Tandon SD (2010). Violence exposure and depressive symptoms among adolescents and young adults disconnected from school and work. Journal of Community Psychology, 38(5), 607–621. [Google Scholar]
- Motl RW, Dishman RK, Birnbaum AS, & Lytle LA (2005). Longitudinal invariance of the Center for Epidemiological Studies – Depression scale among girls and boys in middle school. Educational and Psychological Measurement, 65(1), 90–108. [Google Scholar]
- Muthén LK, & Muthén BO (1998-2017). Mplus User’s Guide. Eighth Edition. Los Angeles, CA: Muthén & Muthén. [Google Scholar]
- Newman DA (2003). Longitudinal modeling with randomly and systematically missing data: A simulation of ad hoc, maximum likelihood, and multiple imputation techniques. Organizational Research Methods, 6(3), 328–362. [Google Scholar]
- Nylund KL (2007). Latent transition analysis: Modeling extensions and an application to peer victimization. Retrieved from http://www.statmodel.com/download/Nylund%20dissertation%20Updated1.pdf [Google Scholar]
- Radloff LS (1977). The CES-D scale: A self-report depression scale for research in the general population. Applied psychological measurement, 1(3), 385–401. [Google Scholar]
- Richards MH, Romero E, Zakaryan A, Carey D, Deane K, Quimby D, … & Burns M (2015). Assessing urban African American youths’ exposure to community violence through a daily sampling method. Psychology of Violence, 5(3), 275. [Google Scholar]
- Small SA, & Kerns D (1993). Unwanted sexual activity among peers during early and middle adolescence. Incidence and risk factors. Journal of Marriage and the Family, 55, 941–952. [Google Scholar]
- Shukla KD, & Wiesner M (2015). Direct and indirect violence exposure: Relations to depression for economically disadvantaged ethnic minority mid-adolescents. Violence and Victims, 30(1), 120–135. [DOI] [PubMed] [Google Scholar]
- Spano R, Rivera C, Vazsonyi AT, & Bolland JM (2012). Specifying the interrelationship between exposure to violence and parental monitoring for younger versus older adolescents: A five year longitudinal test. American Journal of Community Psychology, 49(1-2), 127–141. [DOI] [PubMed] [Google Scholar]
- Thomas A, Caldwell CH, Assari S, Jagers RJ, & Flay B (2016). You do what you see: How witnessing physical violence is linked to violent behavior among male African American adolescents. The Journal of Men’s Studies, 24(2), 185–207. [Google Scholar]
- Tolan PH, Gorman-Smith D, & Henry DB (2001). Chicago youth development study community and neighborhood measure: Construction and reliability technical report. Families and Communities Research Group, University of Illinois, Chicago, Ill, USA. [Google Scholar]
- Turner HA, Finkelhor D, & Ormrod R (2006). The effect of lifetime victimization on the mental health of children and adolescents. Social Science and Medicine, 62, 13–27. [DOI] [PubMed] [Google Scholar]
- Voisin DR, Patel S, Hong JS, Takahashi L, & Gaylord-Harden N (2016). Behavioral health correlates of exposure to community violence among African-American adolescents in Chicago. Children and Youth Services Review, 69, 97–105. [Google Scholar]
- Zimmerman GM, & Messner SF (2013). Individual, family background, and contextual explanations of racial and ethnic disparities in youths’ exposure to violence. American Journal of Public Health, 103(3), 435–442. [DOI] [PMC free article] [PubMed] [Google Scholar]
- Zinzow HM, Ruggiero KJ, Resnick H, Hanson R, Smith D, Saunders B, & Kilpatrick D (2009). Prevalence and mental health correlates of witnessed parental and community violence in a national sample of adolescents. Journal of Child Psychology and Psychiatry, 50, 441–450. [DOI] [PMC free article] [PubMed] [Google Scholar]