Abstract
Background:
The capacity to replay data collected in real life by people with type 1 diabetes mellitus (T1DM) would lead to individualized (vs population) assessment of treatment strategies to control blood glucose and possibly true personalization. Patek et al introduced such a technique, relying on regularized deconvolution of a population glucose homeostasis model to estimate a residual additive signal and reproduce the experimental data; therefore, allowing the subject-specific replay of what-if scenarios by altering the model inputs (eg, insulin). This early method was shown to have a limited domain of validity. We propose and test in silico a similar approach and extend the method applicability.
Methods:
A subject-specific model personalization of insulin sensitivity and meal-absorption parameters is performed. The University of Virginia (UVa)/Padova T1DM simulator is used to generate experimental scenarios and test the ability of the methodology to accurately reproduce changes in glucose concentration to alteration in meal and insulin inputs. Method performance is assessed by comparing true (UVa/Padova simulator) and replayed glucose traces, using the mean absolute relative difference (MARD) and the Clarke error grid analysis (CEGA).
Results:
Model personalization led to a 9.08 and 6.07 decrease in MARD over a prior published method of replaying altered insulin scenarios for basal and bolus changes, respectively. Replay simulations achieved high accuracy, with MARD <10% and more than 95% of readings falling in the CEGA A-B zones for a wide range of interventions.
Conclusions:
In silico studies demonstrate that the proposed method for replay simulation is numerically and clinically valid over broad changes in scenario inputs, indicating possible use in treatment optimization.
Keywords: decision support, glucose variability, insulin therapy, type 1 diabetes
Introduction
New therapies for type 1 diabetes mellitus (T1DM) require controlled clinical trials to evaluate their safety and effectiveness before being deployed in clinical practice. Improvements in mathematical techniques for modeling the physiological dynamics of glucose homeostasis in health 1 and T1DM 2 have led to the development of computer platforms allowing for realistic simulations of blood glucose (BG) response to carbohydrate intake and insulin treatment policies.3-5 Among these, the University of Virginia (UVa)/Padova T1DM simulator6,7 has been accepted by the United States Food and Drug Administration as a substitute to animal trials in the preclinical testing of insulin therapies, being equipped with a fully identified mathematical model of glucose-insulin interaction and an in silico population of 300 virtual subjects.
By the addition of model-based simulations of glucose and insulin metabolism, as well as other physiological processes, research has been accelerated, leading to more rapid development of new technologies and therapies, including the now commercially available “artificial pancreas” (AP) system. 8 However, as noted by Patek et al 9 the available simulation platforms, including the UVa/Padova simulator, cannot account for the behavioral or physiological factors influencing BG (eg, stress or hormonal fluctuations) that are not directly incorporated into the underlying dynamic model. Thus, there is a gap between the in silico evaluation of prospective therapies on platforms such as the UVa/Padova simulator and the variable, individual responses to treatments observed in people with T1DM in clinical practice.
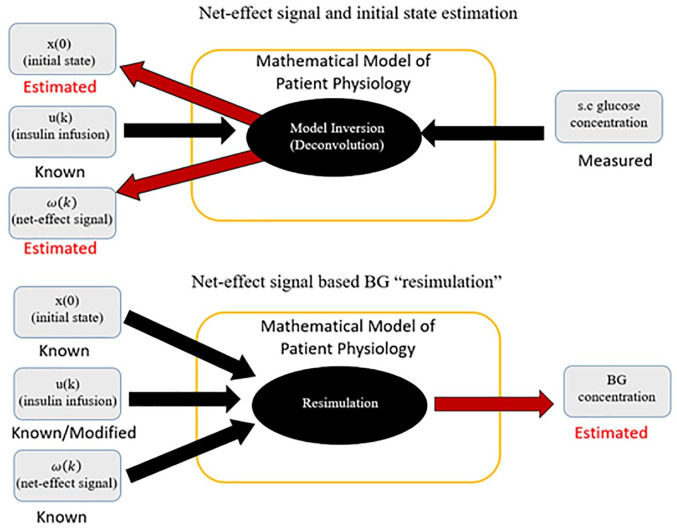
To address this gap, Patek et al proposed a method implementing real-world, data-driven, subject-specific simulations that could facilitate the in silico development, optimization, and evaluation of personalized treatment policies.10,11 The technique relies on regularized deconvolution 12 and a linear time-invariant (LTI) model of BG and insulin dynamics to extract a residual signal representative of un-modeled phenomena. This extracted signal is then fed back into the LTI model, together with the known insulin record, in order to reproduce the variability observed in the real-world BG trace. If a modified insulin schedule is used instead, a hypothetical, simulated trace of the expected BG signal under the modified action can be produced (Figure 1). Simulated BG traces achieved by this procedure can provide insight into the possible effect of alterations in insulin treatment for the specific patient in the timeframe of the observed data.
Figure 1.
A schematic diagram of the simulation procedure. In the top diagram, a visual representation of the signal calculation as described in Patek et al 9 is shown. Below, the resimulation procedure, in which the signal is used to “replay” the data to estimate BG traces with modified insulin is demonstrated.
While this methodology represents a powerful tool allowing for the simulation of what-if scenarios and optimization of insulin therapy at an individual (vs population) level, it suffers some limitations. For example, the residual signal is calculated from the insulin record and BG measurements only, without considering ingested carbohydrates as model input, limiting simulated replays exclusively to alterations in insulin therapy. Furthermore, as pointed out by Vettoretti et al, 13 the “domain of validity” of such simulation procedure is dependent on the intrinsic hypothesis that the estimated residual signal is independent of the inputs changes (eg, new treatment) envisioned in the simulation. The critical task of assessing the impact of such lack of independence on the method capacity to reproduce and predict glucose traces under modified inputs is only feasible in a computer simulation environment, such as the UVa/Padova simulator, 13 and not in vivo.
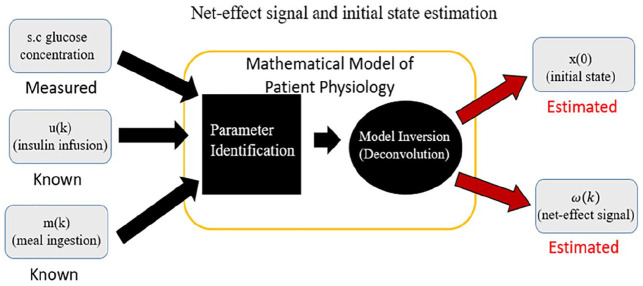
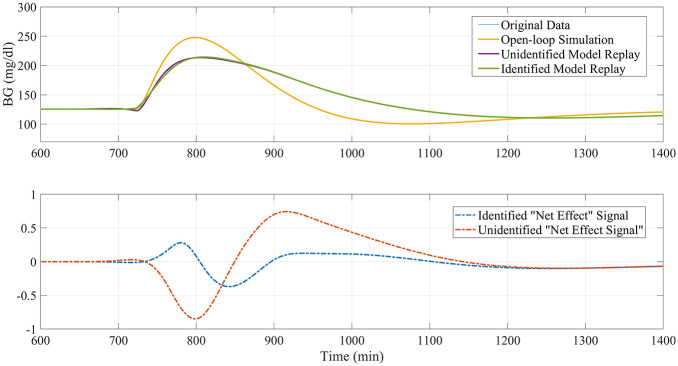
On these premises, the purpose of this work is to propose an updated version of the replay simulation methodology that overcomes some of its current limitations and extends its domain of validity. This updated version incorporates carbohydrate intakes as a known model input (Figure 2); an updated model structure for insulin and carbohydrate pharmacokinetics; and an initial identification of the LTI model to individualize the model before estimating the residual input so as to attenuate spurious nonzero residual signals when all impactful phenomena are known and modeled and allows for better replays of alternative scenarios—such as the removal of meals (Figure 3) and reduction of the dependence of the residual signal on modeled inputs (Figure 4).
Figure 2.
Workflow of signal derivation for replay including meal records and our proposed initial system identification.
Figure 3.
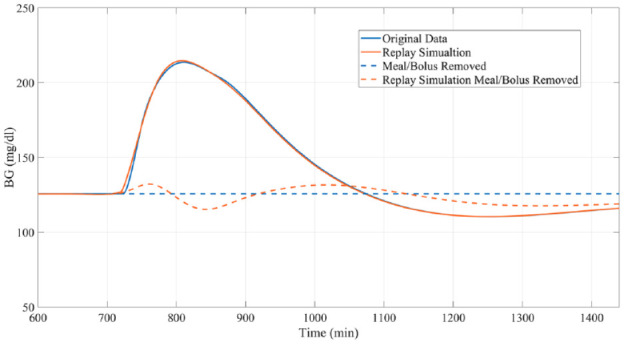
Example of a “replay simulation” of the removal of a meal and bolus occurring at minute 720 compared to the actual results obtained from the original simulator.
Figure 4.
Example of identification procedure attenuating the amplitude of replay signal in a scenario where all phenomena are modeled and meal/insulin dependency should be zero.
Methods
In the following section, we will first present the proposed updated replay simulation procedure; and propose a set of validation experiments within the UVa/Padova simulator to assess the domain of validity for this new methodology and present a potential clinical application of the method on real-world data as an example for its use in the development of T1DM treatments going forward.
The Updated Subcutaneous Oral Glucose Minimal Model (SOGMM)
The original procedure proposed by Patek et al was centered around a linearized, discretized version of the SOGMM, derived from the standard minimal model as presented by Dalla Man et al. 14 The core nonlinear glucose-insulin dynamics in the model are described by the following equations
| (1) |
| (2) |
where G(t) is plasma glucose concentration and Gb its basal state (mg/dL), Ip (t) is plasma insulin mass (mU), Ib is basal plasma insulin concentration (mU/L), Ra (t) is plasma glucose rate of appearance (mg/min), X(t) is insulin action (1/min), Sg is glucose effectiveness (L/min), SI is insulin sensitivity (L/min per mU/L), p2 is the delay between insulin concentration and insulin action (1/min), Vg (dL/kg) and VI (L/kg) are glucose and insulin distribution volumes, and BW is the subject’s body weight (kg). For a more detailed explanation of the physiological meanings of these parameters and those that follow, as well as reference values, the reader is encouraged to consult.9,14,15 On top of these core equations, the SOGMM includes submodels of subcutaneous insulin transport and carbohydrate absorption that are designed with a sequential, compartmental structure.
In our updated implementation, while the core equations are maintained, these two sequential submodels are altered to incorporate a triangular structure, allowing for a direct diffusion from their corresponding first compartments to the BG or plasma insulin compartment, respectively. This triangular meal-absorption model is written as
| (3) |
| (4) |
| (5) |
where Q1 (t) and Q2 (t) are the meal amounts in the first and second meal-absorption compartment (mg), , , and are rate constants (L/min), f is the meal bioavailability (unitless), and um (t) is the meal input (mg/min). A similar triangular model can be implemented with insulin kinetics, leading to a triangular insulin-transport submodel of the form:
| (6) |
| (7) |
| (8) |
where Isc1 (t) and Isc2 (t) represent insulin masses in the two subcutaneous transport compartments (mU), Ip (t) is plasma insulin mass (mU), , and are rate constants (L/min), kcl is insulin clearance rate (L/min), and ui (t) is the subcutaneous insulin infusion input (mU/min).
In addition to modifying the structure of these two submodels, further input terms to account for known inputs beyond insulin records, such as meals or hypoglycemia treatments, are added. Furthermore, we propose that the forcing signal enters the system directly in the BG compartment, as opposed to passing through the meal subsystem.
According to the above changes, the state transition matrix of the implemented model has the form
| (9) |
resulting in the following state-space representation
| (10) |
| (11) |
where the state vector is defined as
| (12) |
and is the residual signal to be estimated by deconvolution, Bi = [0010000]T, Bm = [0000010]T, Bω = [100000]T, and C = [100000].
The following steps of model discretization and deconvolution calculation used here are the same deployed in the previous implementation of the method as are the parameters other than the triangular insulin model ( and , and the identified parameters are discussed in the section below. 9
Model Personalization
The simulation procedure proposed by Patek et al used population values for all model parameters except for BW, SI, and Gb, each of which was given subject-specific values based on total basal insulin delivery and glycated hemoglobin (HbA1c). We propose to use a least-square fitting methodology to identify SI, f, , , and on the data directly. A priori local identifiability of these parameters was confirmed via computer algebra methods (DAISY 16 ). Before the deconvolution calculation, we identify these parameters on the BG traces, feeding insulin and meal data as known model inputs. SI and f are identified for each day of data, while the meal-absorption parameters— , , and —are fitted for each individual meal, with initialization values , , , , and SI calculated as in Patek et al. 9
Design of Simulation Studies
In order to evaluate our methodology, we propose several experiments performed using the 100 virtual adults of the UVa/Padova T1DM simulator. For each experiment, the BG replays obtained with the proposed method in response to treatment changes are compared with the glucose traces generated by the UVa/Padova simulator by feeding the same modified inputs. Method performance is then assessed by comparing replayed and true (ie, from the UVa/Padova simulator) BG profiles using mean absolute relative difference (MARD) and percent time in regions defined by the Clark error grid analysis (CEGA). 17 Furthermore, results obtained with this new method are contrasted with those obtained by Patek et al’s original technique in the case of insulin changes (bolus and basal insulin adjustments), but not meal alterations, since the previous method does not allow for such direct replay of meal carbohydrate changes.
Meal Size Adjustment
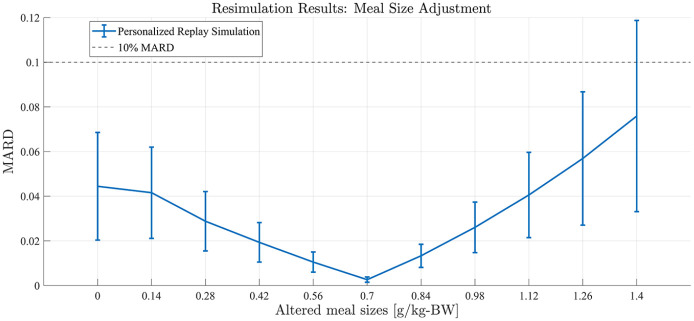
Single-meal, 24-hour simulations were performed. In silico subjects received a meal consisting of 0.7 g of carbohydrates per kg of BW (gCHO/kgBW) at 12 PM, which was bolused using intensive insulin therapy and the built-in subjects’ treatment parameters. Upon model identification and deconvolution computation, the replay simulations were computed by altering the meal size, with changes from −100% (the meal is removed) to +100% (the meal is doubled) in 20% increments (example in Figure 5). Comparison of replayed and true BG traces focused on the 12-hour postprandial (PP) interval.
Figure 5.
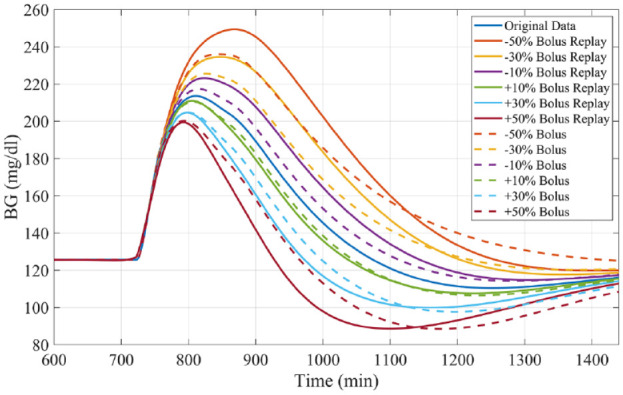
Representative example of meal size alterations by replay simulation as assessed in experiment 1 for University of Virginia/Padova simulator adult subject 1.
Meal Removal
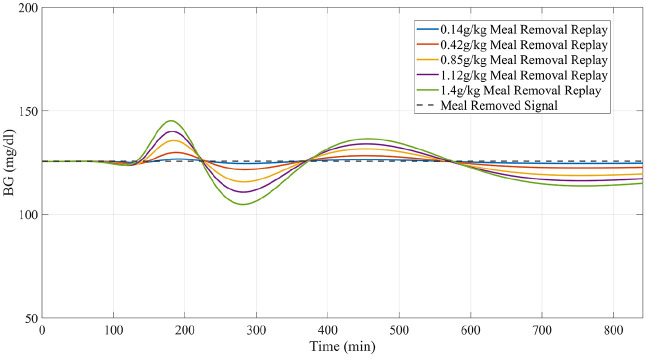
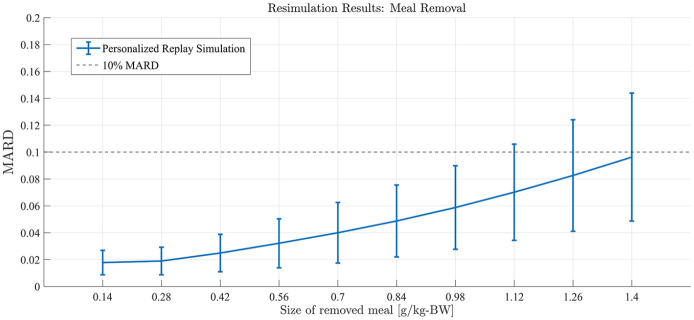
Similar to experiment 1, subjects received a meal at 12 PM of the simulation day under their standard insulin therapy. Meal sizes ranging from 0.14 gCHO/kgBW to 1.4 gCHO/kgBW were simulated (example in Figure 6). The meal and accompanying bolus were then removed entirely using the replay simulation. Performance was again assessed in the PP period.
Figure 6.
Representative example of total meal/bolus removal of varying sizes generated by replay simulation as assessed in experiment 2 for University of Virginia/Padova simulator adult subject 1.
Bolus Adjustment
Like experiments 1 and 2, subjects received a 0.7 gCHO/kgBW meal at 12 PM. Reductions and increases in the meal bolus, ranging from a 50% decrease through a 50% increase of the original size, in 10% increments, were simulated and compared with the true profiles (example in Figure 7), focusing on the PP period. Results are compared with those obtained by performing resimulation using Patek et al’s original methodology.
Figure 7.
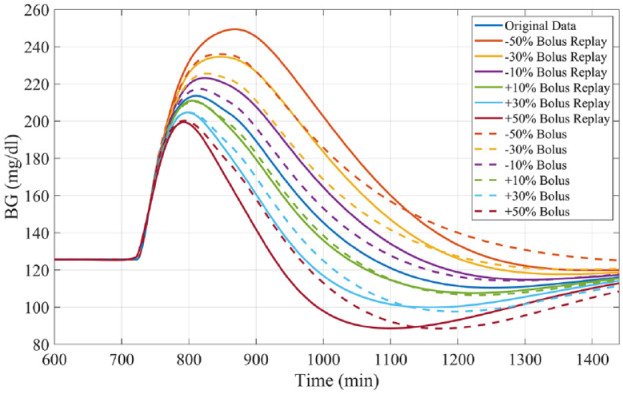
Representative example of bolus size alterations by replay simulation as assessed in experiment 3 for University of Virginia/Padova simulator adult subject 1.
Basal Adjustment
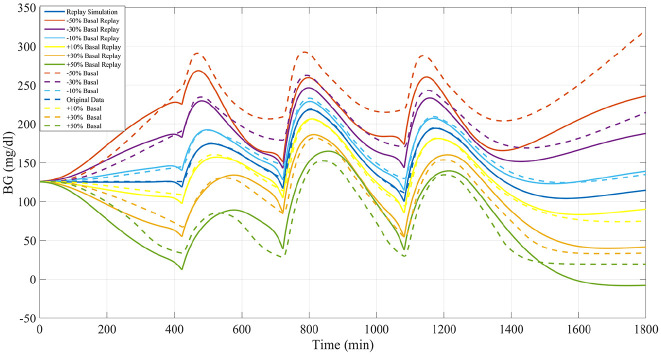
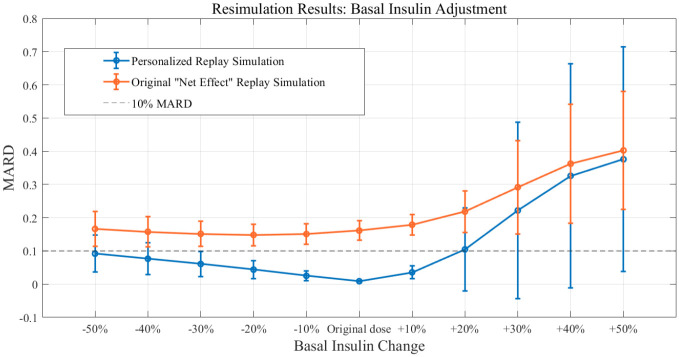
Three-meal, 24-hour simulations were performed. The meal schedule included meals of size 0.4 gCHO/kgBW, 0.8 gCHO/kgBW, and 0.7 gCHO/kgBW given at 07 AM, 12 PM, and 6 PM, respectively. To assess the ability of the proposed methodology to accurately reproduce the impacts of basal insulin adjustments, alterations of basal insulin ranging from a 50% reduction to a 50% increase in 10% increments were replayed and compared against the results obtained by rerunning the same scenarios in the UVa/Padova simulator (example in Figure 8). Performance was assessed across the whole 24 hours. Again results are compared with those obtained by performing resimulation using Patek et al’s original methodology.
Figure 8.
Representative example of basal insulin alterations by replay simulation as assessed in experiment 4 for University of Virginia/Padova simulator adult subject 1.
Clinical Data Application Walkthrough
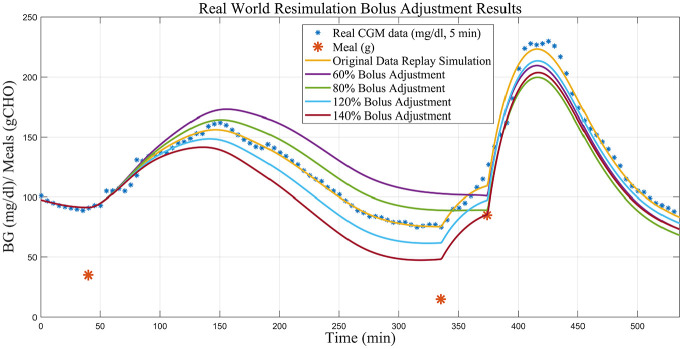
To demonstrate how this method may proceed in a clinical setting, we present a walkthrough of the application of the proposed simulation procedure using real-world clinical data from a study conducted at the UVa Center for Diabetes Technology. The replay simulation results from alterations to the insulin bolus given with a meal observed in real-world clinical data, ranging from a 40% decrease to a 40% increase, will be demonstrated.
Results
The results in terms of MARD performance across the four experimental scenarios are presented in Figures 9 to 12. The plots present performance achieved by the personalized method as compared to the population method.
Figure 9.
Results from experiment 1. Replay simulation of altered meal sizes. Mean population performance (postprandial mean absolute relative difference) and SE bars.
Figure 10.
Results from experiment 2. Replay simulation of total meal removal of varying sizes. Mean population performance (postprandial mean absolute relative difference) and SE bars.
Figure 11.
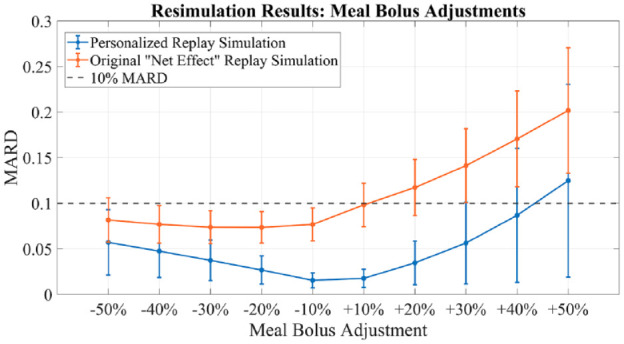
Results from experiment 3. Replay simulation of bolus size variations. Mean population performance (postprandial mean absolute relative difference) and SE bars. Compared with original “net effect” methodology.
Figure 12.
Results from experiment 4. Replay simulations of basal adjustments. Mean population performance (total mean absolute relative difference) and SE bars. Compared with original “net effect” methodology.
In terms of CEGA, for simulation experiment 1, results presented in Table 1 show all meal size changes below 60% increase resulted in 100% of instances falling in zone A or B of the grid. For larger increases from 60% to 100%, zone D performance was observed, but never in excess of 2.12%. No zone C or E performance was observed. For simulation experiments 2 and 3, results presented in Tables 2 and 3, 100% of instances fell in zone A or B (>95% zone A in experiment 2, >85% zone A in experiment 3) for all experimental scenarios, except for greater than or equal to 30% increases in meal bolus which exhibited, 0.789%, 3.679% and 6.963% zone D performance, for 30%, 40%, and 50% increases, respectively. For simulation experiment 4, presented in Table 4, zone A or B performance was greater than 95% for basal changes up to 20% increase, with more than 10% time spent in zone D for basal increases greater than or equal to 30%.
Table 1.
Mean Percent Time in Relevant Section of the Clark Error Grid Across the 100 University of Virginia/Padova Simulator Adult Subjects Under the Meal Alteration Scenarios Given in the Left Column.
| Original 0.7 g/kg-BW (%) | A (%) | B (%) | C (%) | D (%) | E (%) |
|---|---|---|---|---|---|
| 0 | 68.177 | 31.823 | 0 | 0 | 0 |
| 20 | 74.059 | 25.940 | 0 | 0 | 0 |
| 40 | 84.406 | 15.594 | 0 | 0 | 0 |
| 60 | 95.3116 | 4.688 | 0 | 0 | 0 |
| 80 | 100 | 0 | 0 | 0 | 0 |
| 100 | 100 | 0 | 0 | 0 | 0 |
| 120 | 100 | 0 | 0 | 0 | 0 |
| 140 | 96.135 | 3.864 | 0 | 0 | 0 |
| 160 | 87.537 | 12.185 | 0 | 0.277 | 0 |
| 180 | 78.788 | 20.294 | 0 | 0.918 | 0 |
| 200 | 69.612 | 28.267 | 0 | 2.120 | 0 |
Table 2.
Mean of Percent Time in the Relevant Section of the Clark Error Grid Across the 100 University of Virginia/Padova Simulator Adult Subjects with Meals Totally Removed Corresponding to Percent (Given in Left Column) of the Standard 0.7 g/kg Body Weight (BW) Carbohydrate Meal at Noon Scenario.
| g/kw-BW | A (%) | B (%) | C (%) | D (%) | E (%) |
|---|---|---|---|---|---|
| 0.14 | 100 | 0 | 0 | 0 | 0 |
| 0.28 | 100 | 0 | 0 | 0 | 0 |
| 0.42 | 100% | 0 | 0 | 0 | 0 |
| 0.56 | 100 | 0 | 0 | 0 | 0 |
| 0.7 | 99.954 | 0.046 | 0 | 0 | 0 |
| 0.84 | 99.738 | 0.262 | 0 | 0 | 0 |
| 0.98 | 98.108 | 1.892 | 0 | 0 | 0 |
| 1.12 | 95.860 | 4.139 | 0 | 0 | 0 |
| 1.26 | 92.777 | 7.223 | 0 | 0 | 0 |
| 1.4 | 88.657 | 11.343 | 0 | 0 | 0 |
Table 3.
Mean Percent Time in Relevant Section of the Clark Error Grid Across the 100 University of Virginia/Padova Simulator Adult Subjects Under the Bolus Alteration Scenarios Given in the Left Column (Boluses Given for Single 0.7 g/kg Body Weight Carbohydrate Meal at Noon).
| Original bolus (%) | A (%) | B (%) | C (%) | D (%) | E (%) |
|---|---|---|---|---|---|
| −50 | 98.279 | 1.720 | 0 | 0 | 0 |
| −40 | 99.693 | 0.307 | 0 | 0 | 0 |
| −30 | 100 | 0 | 0 | 0 | 0 |
| −20 | 100 | 0 | 0 | 0 | 0 |
| −10 | 100 | 0 | 0 | 0 | 0 |
| +10 | 100 | 0 | 0 | 0 | 0 |
| +20 | 99.484 | 0.424 | 0 | 0 | 0 |
| +30 | 97.379 | 1.831 | 0 | 0.789 | 0 |
| +40 | 92.421 | 3.900 | 0 | 3.679 | 0 |
| +50 | 84.969 | 8.066 | 0 | 6.963 | 0 |
Table 4.
Mean Percent Time in Relevant Section of the Clark Error Grid Across the 100 University of Virginia/Padova Simulator Adult Subjects Under the Basal Alteration Scenarios Given in the Left Column.
| Basal (%) | A (%) | B (%) | C (%) | D (%) | E (%) |
|---|---|---|---|---|---|
| 50 | 100 | 0 | 0 | 0 | 0 |
| 60 | 88.487 | 11.323 | 0 | 0.19 | 0 |
| 70 | 94.185 | 5.76 | 0 | 0.055 | 0 |
| 80 | 98.507 | 1.493 | 0 | 0 | 0 |
| 90 | 99.391 | 0.609 | 0 | 0 | 0 |
| 110 | 99.44 | 0.372 | 0 | 0.188 | 0 |
| 120 | 90.674 | 5.675 | 0 | 3.652 | 0 |
| 130 | 74.967 | 13.636 | 0 | 11.397 | 0 |
| 140 | 66.621 | 16.608 | 0 | 16.771 | 0 |
| 150 | 66.596 | 16.934 | 0 | 16.469 | 0 |
In the replay of real-world clinical data shown in Figure 13, the simulation indicates that the hypoglycemia treatment could be avoided if the first meal’s insulin bolus was reduced by 20%-40%. If the bolus given with the first meal is reduced to 80% of the original, we achieve a case where both the hypotreatment is avoided (BG does not drop below 90 mg/dL and the subsequent hypotreatment is removed in the replay simulation) and the PP hyperglycemia is significantly reduced (fewer than 5 minutes spent above 180 mg/dL). If situations similar to the above example are persistent in the subject’s data and replay simulations, an alteration (here an increase) in the insulin to carbohydrate ratio may be warranted.
Figure 13.
Replay simulations of bolus adjustments on real clinical data.
Discussion
Available, validated T1DM simulation platforms allow for the tuning of insulin therapies but do not implement real-world, subject-specific replays of what-if scenarios. In this work, we have presented significant updates to a previously published simulation tool that allows for the optimization of treatments in T1DM at an individual (vs population) level. These results demonstrate the ability of the updated simulation procedure to faithfully reconstruct the results obtained from the same scenarios when replayed in the UVa/Padova simulator for adjustments in insulin therapy and meals across the virtual population. Smaller alterations in insulin or meals resulted in smaller errors in the BG signals as reconstructed by the replay simulation. For meal alterations, total meal removals, and bolus adjustments, the MARD across the simulator subjects was below the clinically accepted threshold through a wide range of scenarios. In cases of “large” meals (180%-200% of the original 0.7 g/kg BW, or about 100 g CHO on average), in both adjustment and removal, performance was somewhat degraded but still adequate for a large portion of the tested population. For the case of meal alterations and related boluses, the results were encouraging, with across the board A-B range performance greater than 95% in all scenarios except for the 50% increased bolus. Outcomes from basal adjustments within 20% of the original rate were reproduced with a high degree of accuracy. Total time in the A or B range was greater than 95% on average across all subjects in each basal scenario (reduction or increase) until at least a 30% increase was given; outside of this range, the resimulation procedure was less effective in reproducing the glucose traces generated by the UVa/Padova simulator. For reductions in basal rate exceeding 20%, CEGA performance was still respectable, with time outside of A-B range averaging less than 1%; however, MARD performance degraded, with deviations in SEs approaching 10% MARD threshold for reductions of 40% and 50%. For the case of basal increases, any simulated increase in basal insulin resulted in some time outside of the A-B range, and, as in the case of reductions, for increases exceeding 20%, the mean MARD exceeded 10%. This inability to reproduce relatively large changes in basal insulin is a limitation of the replay simulation procedure to effectively recover the UVa/Padova simulator’s nonlinear dynamics in these ranges. Specifically, we note that components of the UVa/Padova simulator, for example, the nonlinear risk gains active when BG is below its basal value, 7 are elements that are unlikely to be accurately reproducible by the replay simulator’s combination of the linear model and additive disturbance. However, we note that such large changes in basal insulin titration are not generally considered in clinical practice, for example, in Dassau et al 18 basal rate adjustments were algorithmically limited to 25% maximum for any segment of the daily profile.
For these experiments, the use of simulated data was required in order to secure a “ground truth” comparison to assess the potential domain of validity for the replay simulations. Other models (such as the ones presented by Sorenson 19 or Hovorka et al 20 ) may lead to slightly different results, but none (including the used platform) are expected to fully represent actual human data. Furthermore, adding sources of BG variability, for example, physical activity or time-varying insulin sensitivity, to the simulator platform, may allow for more robust evaluations of our method performance in the future. The schema of parameter identification can be expanded as well. Interpretations of f as a varying parameter of the bioavailability of meals indicate that it may be suitable to identify meal-specific f values in addition to the meal compartment transfer parameters when dealing with real-world data. Likewise, diurnal variations in insulin sensitivity could be identified or estimated to further refine the procedure in future implementations.
Conclusion
The workflow for the development of new therapies for people with T1DM involves many steps, culminating in rigorous clinical trials and, if successful, real-world deployment. Patek et al 9 proposed a simulation methodology for evaluating new insulin therapies based on real-world data which we have extended to directly include the capability to evaluate adjustments in meal inputs as well. Additionally, we have updated the underlying SOGMM model, implementing triangular insulin-transport and meal-absorption subsystems as well as a prior system identification procedure to achieve a more accurate recreation of the original data. This simulation procedure was able to satisfactorily reproduce differing scenarios in the UVa/Padova T1DM simulator. Finally, as the ultimate purpose of the replay simulation procedure is to allow for simulated modifications of real diabetes data by clinicians and engineers in order to evaluate potential changes in therapy, the implementation of such changes in human clinical trials remain the best standard by which to evaluate the usefulness of this new method. Plans are currently in place for further research along both of these lines at the UVa Center for Diabetes Technology.
Footnotes
Declaration of Conflicting Interests: The author(s) declared no potential conflicts of interest with respect to the research, authorship, and/or publication of this article.
Funding: The author(s) disclosed receipt of the following financial support for the research, authorship, and/or publication of this article: PriMed project, UVA Strategic Investment Fund.
ORCID iDs: Jonathan Hughes  https://orcid.org/0000-0002-4875-9046.
Thibault Gautier  https://orcid.org/0000-0002-0546-6622.
Patricio Colmegna  https://orcid.org/0000-0001-9074-8634.
References
- 1. Dalla Man C, Rizza R, Cobelli C. Meal simulation model of the glucose insulin system. IEEE Trans Biomed Eng. 2007;54(10):1740-1749. [DOI] [PubMed] [Google Scholar]
- 2. Cobelli C, Dalla Man C, Sparacino G, Magni L, De Nicolao G, Kovatchev B. Diabetes: models, signals, and control. IEEE Rev Biomed Eng. 2009. Jan 1;2:54-96. [DOI] [PMC free article] [PubMed] [Google Scholar]
- 3. Kovatchev B, Breton M, Dalla Man C, Cobelli C. In silico preclinical trials: a proof of concept in closed-loop control of type 1 diabetes. J Diabetes Sci Technol. 2009;3(1):44-55. [DOI] [PMC free article] [PubMed] [Google Scholar]
- 4. Steil G, Clark B, Kanderian S, Rebrin K. Modeling insulin action for development of a closed-loop artificial pancreas. Diabetes Technol Ther. 2005;2(7):94-108. [DOI] [PubMed] [Google Scholar]
- 5. Wilinska M, Chassin L, Acerini C, Allen J, Dunger D, Hovorka R. Simulation environment to evaluate closed-loop insulin delivery systems in type 1 diabetes. J Diabetes Sci Technol. 2010;4(1):132-144. [DOI] [PMC free article] [PubMed] [Google Scholar]
- 6. Man CD, Micheletto F, Lv D, Breton M, Kovatchev B, Cobelli C. The UVA/PADOVA type 1 diabetes simulator: new features. J Diabetes Sci Technol. 2014;8(1):26-34. [DOI] [PMC free article] [PubMed] [Google Scholar]
- 7. Visentin R, Campos-Náñez E, Schiavon M, et al. The UVA/Padova type 1 diabetes simulator goes from single meal to single day. J Diabetes Sci Technol. 2018;12(2):273-281. [DOI] [PMC free article] [PubMed] [Google Scholar]
- 8. Kovatchev B, Tamborlane W, Cefalu W, Cobelli C. The artificial pancreas in 2016: a digital treatment ecosystem for diabetes. Diabetes Care. 2016;39(7):1123-1126. [DOI] [PMC free article] [PubMed] [Google Scholar]
- 9. Patek SD, Lv D, Ortiz EA, et al. Empirical representation of blood glucose variability in a compartmental model. In: Kirchsteiger H, Jorgenson JB, Renard E, del Re L, eds. Prediction Methods for Blood Glucose Concentration. Cham: Springer; 2016:133-157. [Google Scholar]
- 10. Kovatchev BP, Patek SD, Ortiz EA, Breton MD. Assessing sensor accuracy for non-adjunct use of continuous glucose monitoring. Diabetes Technol Ther. 2015;17(3):177-186. [DOI] [PMC free article] [PubMed] [Google Scholar]
- 11. Breton M, Patek S, Lv D, et al. Continuous glucose monitoring and insulin informed advisory system with automated titration and dosing of insulin reduces glucose variability in type 1 diabetes mellitus. Diabetes Technol Ther. 2018;20(8):531-540. [DOI] [PMC free article] [PubMed] [Google Scholar]
- 12. Sparacino G, Pillonetto G, De Nicolao G, Cobelli C. Deconvolution for physiological signal analysis. In: Cerutti S, Marchesi C, eds. Advanced Methods of Biomedical Signal Processing. Hoboken, NJ: John Wiley & Sons; 2011:169-198. [Google Scholar]
- 13. Vettoretti M, Facchinetti A, Sparacino G, Cobelli C. Predicting insulin treatment scenarios with the net effect method: domain of validity. Diabetes Technol Ther. 2016;18(11):694-704. [DOI] [PubMed] [Google Scholar]
- 14. Dalla Man C, Caumo A, Cobelli C. The oral glucose minimal model: estimation of insulin sensitivity from a meal test. IEEE Trans Biomed Eng. 2002;49(5):419-429. [DOI] [PubMed] [Google Scholar]
- 15. Man CD, Caumo A, Basu R, Rizza R, Toffolo G, Cobelli C. Minimal model estimation of glucose absorption and insulin sensitivity from oral test: validation with a tracer method. Am J Physiol Endocrinol Metab. 2004;287(4):E637-E643. [DOI] [PubMed] [Google Scholar]
- 16. Bellu G, Saccomani MP, Audoly S, D’Angiò L. DAISY: a new software tool to test global identifiability of biological and physiological systems. Comput Methods Programs Biomed. 2007;88(1):52-61. [DOI] [PMC free article] [PubMed] [Google Scholar]
- 17. Clarke WL, Cox D, Gonder-Frederick LA, Carter W, Pohl SL. Evaluating clinical accuracy of systems for self-monitoring of blood glucose. Diabetes Care. 1987;10(5):622-628. [DOI] [PubMed] [Google Scholar]
- 18. Dassau E, Pinsker J, Kudva Y, et al. Twelve-week 24/7 ambulatory artificial pancreas with weekly adaptation of insulin delivery settings: effect on hemoglobin A1c and hypoglycemia. Diabetes Care. 2017;40(12):1719-1726. [DOI] [PMC free article] [PubMed] [Google Scholar]
- 19. Sorenson JT. A Physiological Model of Glucose Metabolism in Man and Its Use to Design and Assess Improved Insulin Therapies for Diabetes [dissertation]. Massachusetts Institute of Technology, Cambridge, MA, USA; 1985. [Google Scholar]
- 20. Hovorka R, Canonico V, Chassin LJ, et al. Nonlinear model predictive control of glucose concentration in subjects with type 1 diabetes. Physiol Meas. 2004;25(4):905-920. [DOI] [PubMed] [Google Scholar]


