Abstract
Transition-metal oxides such as cupric and cuprous oxides are strongly correlated materials made of earth-abundant chemical elements displaying energy band gaps of around 1.2 and 2.1 eV. The ability to design nanostructures of cupric and cuprous oxide semiconductors with in situ phase change and morphological transition will benefit several applications including photovoltaic energy conversion and photoelectrochemical water splitting. Here, we have developed a physicochemical route to synthesize copper oxide nanostructures, enabling the phase change of cupric oxide into cuprous oxide using an electric field of 105 V/m in deionized water via a new synthetic design protocol called electric-field-assisted pulsed laser ablation in liquids (EFA-PLAL). The morphology of the nanostructures can also be tuned from a sphere of ∼20 nm to an elongated leaf of ∼3 μm by controlling the intensity of the applied electric field. Futuristically, the materials chemistry occurring during the EFA-PLAL synthesis protocol developed here can be leveraged to design various strongly correlated nanomaterials and heterostructures of other 3d transition-metal oxides.
1. Introduction
Binary oxides of copper such as cupric (CuO) and cuprous (Cu2O) are p-type semiconducting materials with energy band gaps of ∼1.2 and ∼2.1 eV, respectively.1 The crystal structure of CuO is monoclinic, which is described by the centrosymmetric space group C2/c, whereas Cu2O has a cubic crystal structure, which belongs to the pn3 space group. Within the copper ions, d electrons experience Coulombic repulsion, which tends to localize individual electrons at atomic lattice sites, while hybridization with the oxygen’s p electron states tends to delocalize the electrons.2 These copper oxides (CuxO; x = 1 or 2) are consequently materials having the appropriate energy band gap to enable the absorption of light and generate charge carriers via photovoltaic phenomena; and to split the water molecule into hydrogen and oxygen using solar energy through photoelectrochemical phenomena. Indeed, the energy required for water splitting is between 1.6 and 2.4 eV,3 and CuxO has a suitable energy band gap for oxidizing and reducing water. Furthermore, the CuO and Cu2O nanostructures (NSs) are also used for other applications such as batteries,4,5 gas sensors,6 catalysts,7,8 and pigments.9
To further develop several technological applications such as photovoltaic energy conversion and photoelectrochemical water splitting, our ability to design strongly correlated structures of CuxO semiconductors with in situ phase change and morphological transition is crucial. There exist several thermodynamic pathways to promote the phase change of CuO into Cu2O.10 Recently, some studies have reported the synthesis of CuxO NSs by the hydrothermal method11 and CuO nanowires (NWs) by an electric-field-assisted thermal oxidation method.12 Electric field plays a critical role in controlling the growth and morphology of the synthesized CuO NWs as ion diffusion and velocity can be tuned via an external electric field.12 Earlier studies had also investigated the role of electrical discharges with various conductivities (chemically controlled) on the growth of Cu-based NSs.13
We present here a new pathway to induce a phase transition in CuxO NSs by transforming CuO into Cu2O using an electric field, which is mechanistically understood via the Oswald ripening process. Indeed, by increasing the value of the electric field from 0 to 105 V/m, there is a structural phase change from CuO to Cu2O. Moreover, there is also a morphological transition, accompanying the structural change, evolving from a sphere of ∼20 nm to an elongated leaf of ∼3 μm. This paper reports for the very first time a synthesis of CuxO NSs by electric-field-assisted-pulsed laser ablation in liquids (EFA-PLAL).
2. EFA-PLAL Synthesis, Mechanism, and Characterization
2.1. Background
CuxO nanostructures (NSs) can be obtained by various methods including the hydrothermal synthetic method, chemical precipitation methods, thermal conversion of precursors, electrochemical method, thermal oxidation method, and pulsed laser ablation in liquids (PLAL).1 PLAL is an interesting technique as it produces NSs with a naked surface. A complete list of CuxO NSs performed by PLAL is given in Table 1.
Table 1. CuxO NSs Synthesized by Laser Ablation in Liquids (LAL)a.
| ref | type of laser | repetition rate (Hz) | irradiation time (min) | solvent | energy/pulse or fluence | result |
|---|---|---|---|---|---|---|
| Femtosecond – PLAL | ||||||
| (14) | Ti:Sapphire at 800 nm | 1000 | 9 | deionized (DI) water, acetone | 500 μJ/pulse and 50 μJ/pulse | Cu at Cu2O NPs and Cu2O at Cu NPs |
| Picosecond – PLAL | ||||||
| (15) | Nd:YAG at 532 nm | 10 | 60 | DI water, ethanol | 31 mJ/pulse | Cu2O NPs |
| Nanosecond – PLAL | ||||||
| (16) | Nd:YAG at 355 nm | 10 | 60 | DI water | 150 mJ/pulse | Cu/CuO NPs |
| (17) | Nd:YAG at 532 nm | 10 | 15, 30 | spinach water extract | 200 mJ/pulse | |
| (18) | Nd:YAG at 532 nm | DI water | 20 mJ/pulse | CuO NPs | ||
| (19) | Nd:YAG at 532 nm | 6 | 15, 30, 45, 60 | DI water | 30 mJ/pulse | CuO NPs |
| (20) | Nd:YAG at 532 nm | 10 | 15 | DI water with hydrogen peroxide (0–5%) | 60 mJ/pulse | CuO and Cu2O NPs |
| (21) | Nd:YAG at 532 nm | 10 | DI water | 25 mJ/pulse | Cu a tCu2O NPs | |
| (22) | Nd:YAG at 1064 nm | 1 | 5–20 | DI water | 40–200 mJ/pulse | CuO NPs |
| (23) | Nd:YAG at 1064 nm | 10 | DI water, acetonitrile, methanol, ethanol, hexane, 1-propanol, butanol, ethylene glycol | 80 mJ/pulse | ||
| (24) | Nd:YAG at 1064 nm | 10 | poly(vinyl alcohol) | 75 mJ/pulse | ||
| (25) | Nd:YAG at 1064 nm | 10 | 60 | DI water, ethylene glycol | 27 J/cm2 and 80 J/cm2 | hollow CuO NPs and Cu NPs |
| (26) | Nd:YAG at 1064 nm | 10 | 4 | ethanol | 1.5 J/pulse | Cu2O NPs |
| (27) | Nd:YAG at 1064 nm | DI water | 40 mJ/pulse | CuO and Cu2O NPs | ||
| (28) | Nd:YAG at 1064 nm | 20 | DI water, sodium hydroxide, hydrogen peroxide, ethyl alcohol | |||
| (29) | Nd:YAG at 532 nm | 10 | 15, 30, 60 | methanol, 2-propanol | 30 mJ/pulse | Cu at Cu2O NPs |
| (30) | Nd:YAG at 1064 nm | 10 | 60 | PVP aqueous solution | 80 mJ/pulse | Cu2O at CuO NPs |
| (31) | Nd:YAG at 1064 nm | 10 | 5 | DI water, acetone | 130 mJ/pulse | CuO NPs, Cu NPs |
| (32) | Nd:YAG at 1064 nm | 10 | 1.66 | DI water | 10 mJ/pulse | Cu/CuO NPs |
| (33) | Nd:YAG at 1064 nm | 20 | 60 | DI water | 180 mJ/pulse | Cu2O NPs |
| (34) | Ce:Nd:YAG at 1064 nm | 10 | 30 | hydrogen peroxide | 40, 70, 100 mJ/pulse | Cu/CuO flakes |
| (35) | Yb fiber at 1064 nm | 21 000 | DI water | 1 mJ/pulse | CuO NPs | |
| Continuous – LAL | ||||||
| (32) | diode laser at 530 nm | CW | 120 | DI water | / | Cu/CuO NPs |
| Nanosecond – EFA-PLAL | ||||||
| this work | Nd:YAG at 1064 nm | 1000–15 000 | 30 + 30 | DI water | 350 J/cm2 | CuO/Cu2O NSs |
LAL, laser ablation in liquids; PLAL, pulsed laser ablation in liquids; EFA-PLAL, electric-field-assisted-PLAL.
2.2. Synthesis
The NSs were created using a two-step process. The first step was a regular PLAL setup (Figure 1a). A Q-switched Nd:YAG laser from Electro Scientific Industries operating at 1064 nm was used to irradiate a Cu target. Spherical Cu beads (99.99% from Sigma Aldrich) were used as targets in this experiment. The diameter of the beads was ∼2 mm. A 25 mL rounded flask was used as a container, and 3 mL of DI water was poured into it. Consequently, the height of the liquid above the surface of the target was measured to be 10 mm. The pulse repetition rate of the laser was varied from 1 to 15 kHz. Consequently, the pulse duration time varied slightly from 70 to 200 ns depending on the repetition rate. The laser shined a pulsed beam with an energy per pulse of around 5.5 mJ per pulse at 1 kHz. The beam was deflected by a flat mirror oriented at a 45° angle (with respect to the laser rail) to irradiate the target from the top and was then focused using an 83 mm focal length lens. The beam’s spot size on the target was measured by scanning electron microscopy (SEM) to be around ∼45 μm. Therefore, the intensity of the laser was determined to be around ∼3.5 × 10⁵ W/cm2. At 1 kHz, the fluence was calculated to be ∼3.5 × 10² J/cm2. The Cu target was finally irradiated for 30 min.
Figure 1.
(a, b) Sketch of the synthesis protocol. Step 1 uses a PLAL setup, while step 2 uses an EFA-PLAL setup.
The second step is an EFA-PLAL setup, as depicted in Figure 1b. EFA-PLAL differs from the PLAL setup in using a direct-current (DC) electric field with adjustable voltage from two parallel electrodes being applied on both sides of the Cu target.36 The electrodes were two rectangular plates made of Cu. The laser beam was unfocused during the second step, and the target was removed from the container. The colloid obtained after the first step was irradiated for another 30 min. The container was a square cuvette with the electrodes placed face to face on two opposite walls of the cuvette. The potential difference applied between the electrodes was kept constant during the entire duration of the second step at 0, 100, 250, 500, 750, or 1000 V. All of the synthesis details are summarized in Table 2.
Table 2. Parameters of the EFA-PLAL Synthesis.
| parameter | step 1 | step 2 |
|---|---|---|
| mode | PLAL | EFA-PLAL |
| laser | Nd:YAG | Nd:YAG |
| wavelength (nm) | 1064 | 1064 |
| repetition rate (kHz) | 5.1 | 5.1 |
| duration (min) | 30 | 30 |
| target | Cu beads | _ |
| beam | focused | unfocused |
| volume (mL) | 3 | 3 |
| container | 25 mL single-neck rounded flask | 3 mL square cuvette |
2.3. Mechanism
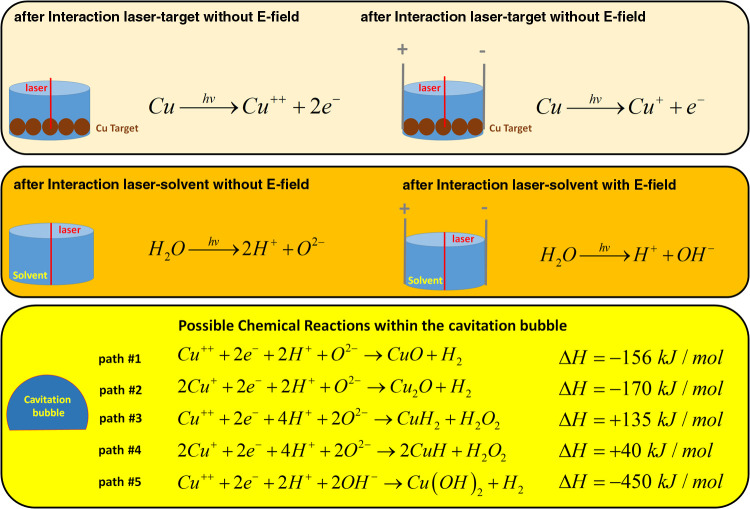
The solvent used in this synthesis protocol, DI water in our case, confines the plasma plume and also provides a reactive medium to generate a compound based on the target’s chemical element, in this case, Cu. The electron configuration of Cu is [Ar]3d104s1, meaning that Cu has 11 valence electrons, 1 belonging to the 4s orbital and 10 belonging to the 3d orbital.37 When the laser beam hits the Cu target, it starts ionizing Cu into Cu+ and 1e–, by removing the electron from the 4s orbital. Another electron can easily be removed from the 3d orbital to form Cu++. The laser beam also break downs the water molecule of the solvent into hydrogen ions (H+) and oxygen ions (O2–) or into hydrogen ions and hydroxide groups (OH–). When the plasma cools down (laser beam is off), the Cu+ ions, Cu++ ions, H+ ions, O2– ions, and electrons (e–) start reacting all together to form CuO or Cu2O according to the chemical reactions shown in Scheme 1.
Scheme 1. Possible Chemical Reactions Occurring during the EFA-PLAL Synthesis Protocol.
Based on the ionic species present during the irradiation, Cu+ ions and Cu++ ions will react with O2– because the enthalpy of formation of CuxO is more negative than the enthalpy of formation of copper hydrides (CuH or CuH2). Moreover, the chemical reaction among Cu2+, OH–, and e– will not occur under our synthesis conditions despite a favorable formation enthalpy. Indeed, the presence of the electric field influences the way Cu will be ionized. Without an electric field being present, Cu can be ionized two times into Cu++ as the Cu+ ions do not move (no electric field present) after being ionized the first time by the laser beam. Therefore, CuO is expected without an electric field. When an electric field is present, the Cu+ ions created by the interaction of the laser beam and the Cu target move along the electric field lines and consequently leave the ablation area; therefore, Cu+ ions cannot be reirradiated a second time by the laser beam to form Cu++. Thus, Cu2O is expected when an electric field is present.
2.4. Characterization
The colloids were then characterized by atomic emission spectroscopy (4210 MP-AES from Agilent), scanning electron microscopy (JEOL JSM-7000F, equipped with a field emission gun, and operating at 15 kV), and transmission electron microscopy (Thermo Fisher Scientific Talos F200X operating at 200 kV). To perform Raman, FT-IR, and SEM analyses, a droplet of colloids was deposited onto a silicon wafer and dried in an environmentally controlled glovebox. The samples for the TEM study were each prepared by the drop-casting of one droplet of the colloid onto a TEM grid followed by air-drying. Raman spectra were obtained with a RENISHAW inVia Qontor confocal Raman microscope with thermoelectric cooling for ultralow noise levels. The spectra were recorded in a backscattering configuration with ultrafast data collection (over 1800 spectra per second). The excitation line was at 532 nm, and the laser power was kept at 50% of the source power to avoid heating the samples. The IR measurements were performed using a Varian 670 FT-IR spectrometer.
3. Results and Discussion
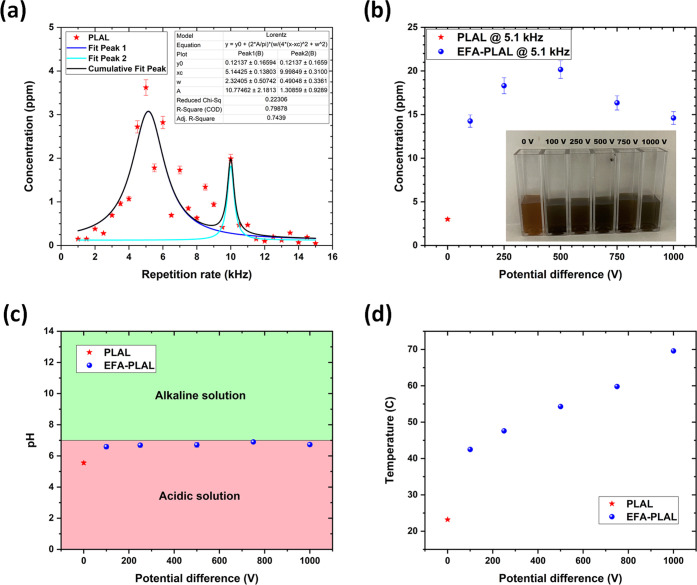
The lifetime of the cavitation bubble can be determined by analyzing the concentration of the colloid versus the repetition rate of the laser (Figure 2a). At low repetition rates, the concentration of NSs increases with the repetition rate. However, by shining the laser beam too fast on the target, the laser will encounter the cavitation bubble, which will correspond to a decrease in concentration of NSs within the colloid. From Figure 2a, it is seen that the maximal production of NSs is reached at 5.1 ± 0.1 kHz; consequently, the cavitation bubble lifetime is estimated to be ∼0.196 ± 0.004 ms. At 10.2 kHz, there is a second peak that still produces some significant amount of NSs, but the concentration is less than the one at 5.1 kHz because approximately only half of the laser shoots reach the target.
Figure 2.
(a) Concentration of CuxO colloids synthesized at 0 V for various repetition rates from 1 kHz up to 15 kHz. The optimal repetition rate was determined at ∼5.1 kHz. (b) Concentration of CuxO colloids synthesized at 5.1 kHz for various potential differences from 0 V up to 1000 V. Inset: Photo of the colloids synthesized at 5.1 kHz under various potential differences. (c) pH of the CuxO colloids synthesized at 5.1 kHz versus the potential difference used during the synthesis. All of the pH values have been measured at room temperature (T ∼ 23 °C). (d) Temperature of the colloids synthesized at 5.1 kHz versus the potential difference used during the synthesis.
After determining the best repetition (5.1 kHz) to irradiate the Cu target in DI water, the electric field was activated during the synthesis to generate five colloids at various voltages of 100, 250, 500, 750, and 1000 V. Another sample (at 0 V) was synthesized without the electric field to serve as a reference. A picture of the sample’s series can be seen in the inset in Figure 2b. Figure 2b shows the concentration of Cu-based NSs within each of the colloids synthesized at various voltages. As seen in Figure 2b, the concentration is multiplied by ∼5 in comparison to the colloid synthesized without any applied voltage. This can be understood by having the electric field ON between the electrodes; the cavitation bubble is shifted spatially, allowing the laser to reach the target without encountering any shielding effect due to the cavitation bubble and, consequently, enhancing the ablation of Cu. Consequently, the colloids (0, 100, 250, 500, 750, and 1000 V) are acidic by exhibiting a pH around ∼6.7 (Figure 2c). Indeed, the presence of CuxO nanoparticles (NPs) in the solvent decreases the pH of the solvent compared to a pure DI water solvent, whatever the synthesis protocol is, PLAL or EFA-PLAL. In the Supporting Information, the pH of the colloid is also plotted as a function of the concentration of CuxO NSs within the colloid (Figure S1). From Figure S1, it is clear that the EFA-PLAL was very efficient to increase the concentration of NSs with respect to a regular PLAL protocol. In Figure 2d, the temperature of the colloid was monitored, and its value increased with the value of the electric field applied during the synthesis.
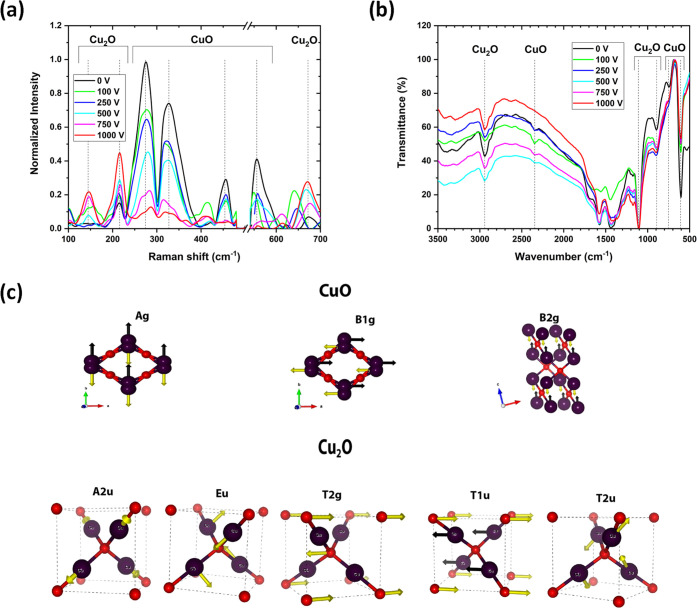
The presence of two phases of CuxO was detected by Raman spectroscopy (Figure 3a). Indeed, in Figure 3a, each colloid displays some peaks belonging to both oxides CuO and Cu2O. However, it seems that by increasing the value of the electric field during the synthesis, Cu2O is promoted compared to CuO. CuO seems to dominate the colloid at a low electric field. At 0 V, the oxidation state of Cu is II, consequently forming CuO NSs. By increasing the potential difference during the synthesis, the oxidation state of Cu decreases to I and forms Cu2O NSs. The Raman peaks of CuO and Cu2O are listed in Table 3. In the Ag and Bg Raman modes, only the oxygen atoms move, with displacements in the b-direction for Ag and perpendicular to the b-axis for Bg modes. The presence of CuO and Cu2O was also confirmed by FT-IR (Figure 3b). The infrared active modes involve the motion of both O and the Cu atoms. The vibration modes of CuO and Cu2O are illustrated in Figure 3c. The presence of IR bands at 900, 1100, and 2950 cm–1 confirm the Cu2O phase, while the presence of bands at 600, 750, and 2350 cm–1 affirm the CuO phase.
Figure 3.
(a) Raman spectra of the colloids synthesized at 5.1 kHz under various potential differences. (b) FT-IR spectra of the colloids synthesized at 5.1 kHz under various potential differences. (c) Illustration showing the vibrational modes for CuO and Cu2O.
Table 3. Theoretical and Experimental Raman Frequencies of CuO and Cu2O.
| material | vibrational mode | theoretical (cm–1) | experimentala (cm–1) |
|---|---|---|---|
| CuO | Ag | 294,38 296,39 298,40 31941 | 276 |
| Bg | 348,38 346,39 345,40 38241 | 327 | |
| Au | 42138 | 455 | |
| Bg | 624,38 631,39 632,40 63941 | 671 | |
| Cu2O | T2u/Γ25- | 8842 | not observed |
| Eu/Γ12- | 11042 | 145 | |
| T1u/Γ15- | 149,42 15342 | 216 | |
| A2u/Γ2- | 34842 | not observed | |
| T2g/Γ25+ | 51542 | not observed | |
| T1u/Γ15- | 640,42 66042 | 672 |
This work.
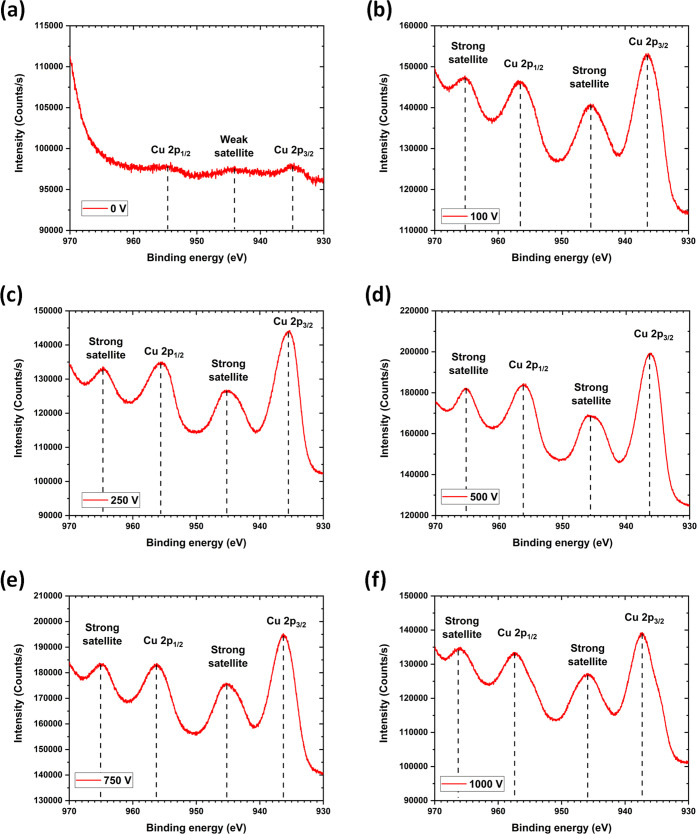
The nature of the oxide present at the surface of the nanostructure has been investigated by X-ray photoelectron spectroscopy (XPS). The PLAL sample synthesized at 0 V looks very different from all of the other samples synthesized with a nonzero potential difference (EFA-PLAL), as can be seen in Figure 4. It is possible to distinguish the Cu oxidation states using the satellite peak features of Cu 2p.43,44 In Figure 4a, there is a weak satellite peak around ∼944 eV, indicating the presence of Cu2O at the surface. In Figure 4b–f, there are two strong satellite peaks around ∼945 and ∼965 eV, indicating the presence of CuO at the surface of the NSs.
Figure 4.
XPS of the CuxO NSs synthesized at 5.1 kHz under various potential differences: (a) 0 V, (b) 100 V, (c) 250 V, (d) 500 V, (e) 750 V, and (f) 1000 V.
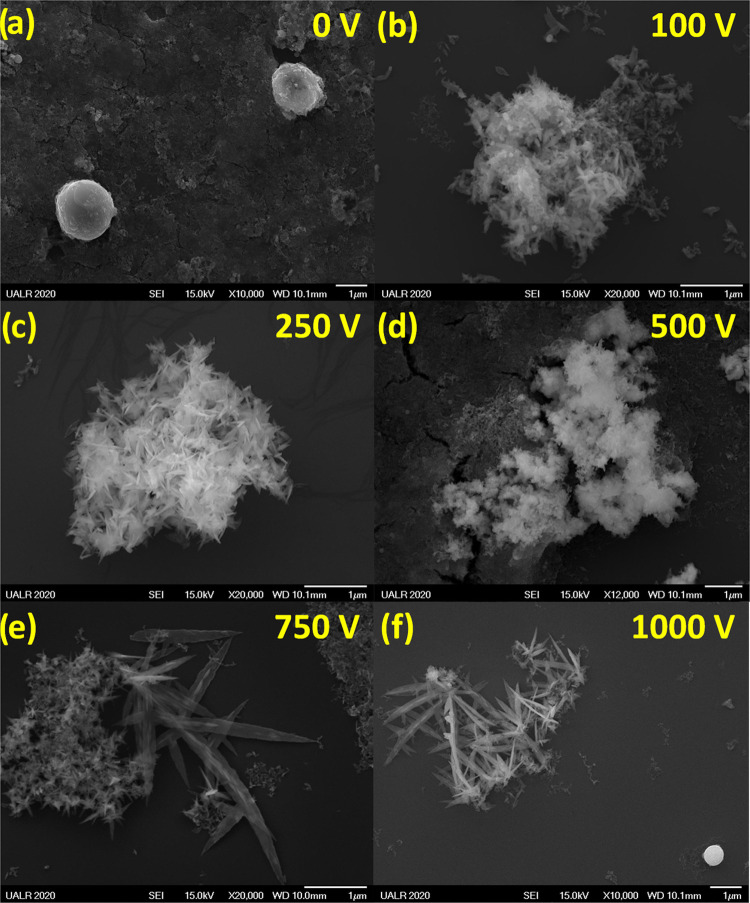
Finally, the morphology of CuxO NSs was analyzed by SEM and is shown in Figure 5. At 0 V, the CuxO NSs are spherical; however, at nonzero voltages, the NSs are elongated into leaves. The larger size of NSs obtained at higher potential differences can be explained by the larger temperatures reached by the colloid during the synthesis when the electric field is applied (Figure 2d). Indeed, the more intense the electric field (i.e., potential difference across the cuvette), the higher the temperature. Consequently, the NSs become bigger because of the Oswald ripening process.45 This process is a heat-induced size change of NSs in solution. By increasing the potential difference from 0 to 1000 V, the surface-to-volume ratio of the NSs increases by having the morphology evolving from a sphere to a nanoleaf. Furthermore, the composition of CuxO seems also to evolve from CuO to Cu2O when the potential difference increases from 0 to 1000 V (Figure 3a). This effect on the chemical composition may also be explained by the Oswald ripening process.46 However, the Oswald ripening process explains why we observe larger structures at higher potential differences but does not explain the elongation. Indeed, the elongation is due to a growth-oriented attachment process occurring by aligning the seeds along the direction of the electric field, consequently creating nanoleaves when an electric field is applied. More SEM images are shown in Figure S2.
Figure 5.
SEM images of the CuxO NSs synthesized at 5.1 kHz under various potential differences: (a) 0 V, (b) 100 V, (c) 250 V, (d) 500 V, (e) 750 V, and (f) 1000 V.
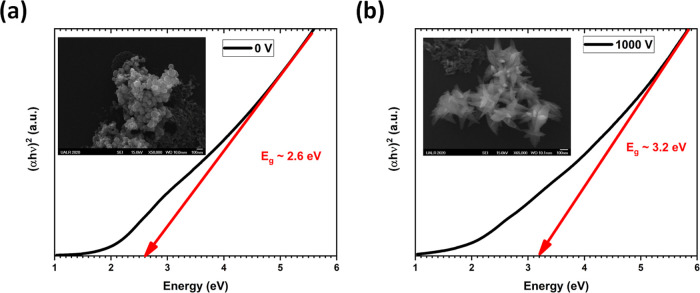
In Figure 6, let us focus on the synthesized NSs synthesized under the two most extreme potential differences, i.e., 0 V and 1000. The sample at 0 V shows CuO NPs with sizes smaller than 20 nm, while the sample at 1000 V shows Cu2O NSs with the length reaching several hundreds of nanometers (inset). It is still possible to encounter spherical NPs in the sample at 1000 V as the spherical NPs produced during the first step process may not have crossed the laser beam path during the second step process. The electron diffraction of both samples confirms the crystallinity of the NSs produced.
Figure 6.
(a, b) Tauc plots of the CuxO NSs synthesized at 5.1 kHz under potential differences of 0 and 1000 V, respectively. Inset: SEM image of the CuxO NSs.
The Tauc plot calculated from the absorbance curve obtained by UV–visible spectroscopy on these two extreme samples shows energy band gaps around 2.6 and 3.2 eV at 0 and 1000 V, respectively. Based on the previous discussion, it is evident that the CuO NSs displayed a band gap around 2.6 eV, while Cu2O NSs exhibited a band gap around 3.2 eV. This is in good agreement with what is observed in the literature.47,48 These values are much larger than the bulk energy band gaps of CuO and Cu2O (1.2 and 2.1 eV, respectively). This is due to the small size of the CuxO NSs, as shown in Figure 7. Indeed, as the size decreases, the energy band gap increases.49,50
Figure 7.
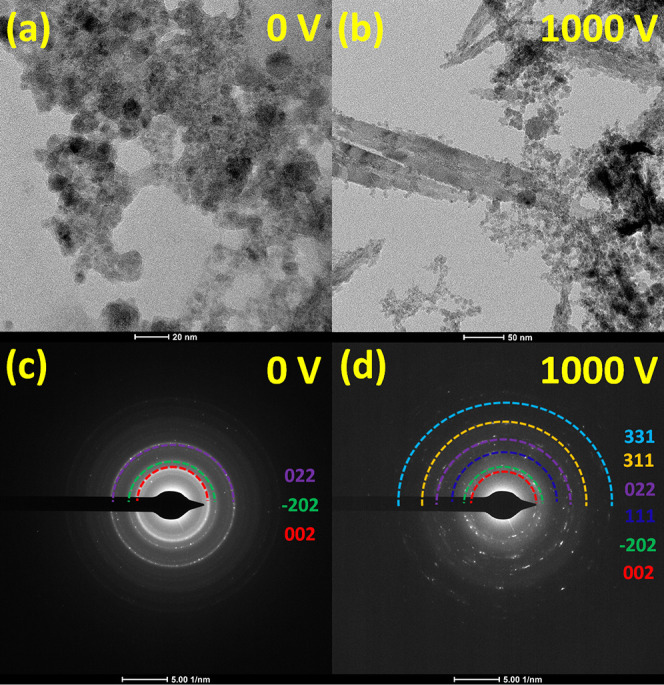
(a, b) TEM images of the CuxO NSs synthesized at 5.1 kHz under a potential difference of 0 and 1000 V, respectively. (c, d) Electron diffraction patterns corresponding to the TEM images shown in (a) and (b), respectively.
To further confirm the electric-field-induced phase transition in the synthesized CuxO NSs, we performed TEM and selected area electron diffraction (SAED) studies. The typical diameter of CuO nanoparticles prepared at 0 V is observed to be ∼20 nm, which is shown in Figure 7a. The corresponding SAED pattern (Figure 7c) confirms the presence of the CuO phase with (022), (−202), and (002) crystal planes with concentric rings of distinct bright spots confirming the crystalline structure of CuO NSs. In contrast, the TEM topography image (Figure 7b) for the samples prepared at 1000 V shows elongated leaflike NSs of over 250 nm. The corresponding SAED pattern in Figure 7d demonstrates the presence of several crystal planes such as (331), (311), (022), (111), (−202), and (002), confirming the formation of both CuO and Cu2O crystalline phases.
5. Conclusions
CuxO NSs have been successfully synthesized by the EFA-PLAL technique. The first step of the synthesis protocol serves to synthesize the CuxO seeds, while the second step serves to elongate the seeds into their final shape. The intensity of the electric field has a huge influence on the morphology of the NSs and the crystalline phase of the oxide formed. When the electric field is OFF, the NSs are spherical, while when the electric field is ON, elongated nanoleaves are formed. The electric field used during the synthesis also helps control the oxidation state of Cu by promoting a phase transition from CuO to Cu2O. At low electric fields, Cu II (CuO) is favored, while at higher electric fields, Cu I (Cu2O) is preferred. Indeed, from the Raman and XPS analyses, it is clear that at 0 V the core and the surface of the spherical nanoparticles are made of CuO, while at 1000 V, Cu2O becomes predominant in the core and the surface. Also, the two structures displayed significantly different energy band gaps around 2.6 eV for the CuO NSs and around 3.2 eV for the Cu2O NSs. Moreover, the electric field also helped enhance the concentration of the colloid by a factor of ∼5. Finally, this new synthesis protocol could be extended to synthesize other 3d transition-metal oxides, which will pave the path to new oxide heterostructure designs.
Acknowledgments
The authors are grateful to the Center for Integrative Nanotechnology Sciences (CINS) of UA Little Rock for sharing their instruments (UV–visible–NIR and SEM). This work was partially supported by the French RENATECH network. S.K.B. acknowledges the MRFN Faculty Fellow Program 2021, which was supported by NSF through the Penn State University MRSEC DMR 1420620 & MRSEC DMR 2011839. T. H. and G. G. acknowledge UA Little Rock for its financial support.
Supporting Information Available
The Supporting Information is available free of charge at https://pubs.acs.org/doi/10.1021/acsomega.1c05498.
Figure S1: pH versus the concentration of the CuxO NSs within the colloid; Figure S2: SEM images of the CuxO NSs synthesized by EFA-PLAL at 0 and 1000 V (PDF)
Author Contributions
⊥ T.H. and N.J. contributed equally to this work.
The authors declare no competing financial interest.
Notes
The data that support the findings of this study are available from the corresponding author upon reasonable request.
Supplementary Material
References
- Zhang Q.; Zhang K.; Xu D.; Yang G.; Huang H.; Nie F.; Liu C.; Yang S. CuO nanostructures: Synthesis, characterization, growth mechanisms, fundamental properties, and applications. Prog. Mater. Sci. 2014, 60, 208–337. 10.1016/j.pmatsci.2013.09.003. [DOI] [Google Scholar]
- Tokura Y. Correlated-Electron Physics in Transition-Metal Oxides. Phys. Today 2003, 56, 50–55. 10.1063/1.1603080. [DOI] [Google Scholar]
- Balık M.; Bulut V.; Erdogan I. Y. Optical, structural and phase transition properties of Cu2O, CuO and Cu2O/CuO: Their photoelectrochemical sensor applications. Int. J. Hydrogen Energy 2019, 44, 18744–18755. 10.1016/j.ijhydene.2018.08.159. [DOI] [Google Scholar]
- Liang Z.; Zhao R.; Qiu T.; Zou R.; Xu Q. Metal-organic framework-derived materials for electrochemical energy applications. EnergyChem 2019, 1, 100001 10.1016/j.enchem.2019.100001. [DOI] [Google Scholar]
- Jiang B.; Wei Y.; Wu J.; Cheng H.; Yuan L.; Li Z.; Xu H.; Huang Y. Recent progress of asymmetric solid-state electrolytes for lithium/sodium-metal batteries. EnergyChem 2021, 3, 100058 10.1016/j.enchem.2021.100058. [DOI] [Google Scholar]
- Steinhauer S. Gas Sensors Based on Copper Oxide Nanomaterials: A Review. Chemosensors 2021, 9, 51. 10.3390/chemosensors9030051. [DOI] [Google Scholar]
- Yuan G.; Yu S.; Jie J.; Wang C.; Li Q.; Pang H. Cu/Cu2O nanostructures derived from copper oxalate as high performance electrocatalyst for glucose oxidation. Chin. Chem. Lett. 2020, 31, 1941–1945. 10.1016/j.cclet.2019.12.034. [DOI] [Google Scholar]
- Ye W.; Guo X.; Ma T. A review on electrochemical synthesized copper-based catalysts for electrochemical reduction of CO2 to C2+ products. Chem. Eng. J. 2021, 414, 128825 10.1016/j.cej.2021.128825. [DOI] [Google Scholar]
- Kim S. J.; Kim S.; Lee J.; Jo Y.; Seo Y.-S.; Lee M.; Lee Y.; Cho C. R.; Kim J.-P.; Cheon M.; Hwang J.; Kim Y. I.; Kim Y.-H.; Kim Y.-M.; Soon A.; Choi M.; Choi W. S.; Jeong S.-Y.; Lee Y. H. Color of Copper/Copper Oxide. Adv. Mater. 2021, 33, 2007345 10.1002/adma.202007345. [DOI] [PMC free article] [PubMed] [Google Scholar]
- Wu F.; Banerjee S.; Li H.; Myung Y.; Banerjee P. Indirect Phase Transformation of CuO to Cu2O on a Nanowire Surface. Langmuir 2016, 32, 4485–4493. 10.1021/acs.langmuir.6b00915. [DOI] [PubMed] [Google Scholar]
- Yuan M.; Guo X.; Pang H. Derivatives (Cu/CuO, Cu/Cu2O, and CuS) of Cu superstructures reduced by biomass reductants. Mater. Today Chem. 2021, 21, 100519 10.1016/j.mtchem.2021.100519. [DOI] [Google Scholar]
- Tang C.; Liao X.; Zhong W.; Yu H.; Liu Z. Electric field assisted growth and field emission properties of thermally oxidized CuO nanowires. RSC Adv. 2017, 7, 6439–6446. 10.1039/C6RA27426A. [DOI] [Google Scholar]
- Hamdan A.; Glad X.; Cha M. S. Synthesis of Copper and Copper Oxide Nanomaterials by Pulsed Electric Field in Water with Various Electrical Conductivities. Nanomaterials 2020, 10, 1347. 10.3390/nano10071347. [DOI] [PMC free article] [PubMed] [Google Scholar]
- Santillán J. M. J.; Videla F. A.; Fernandez van Raap M. B.; Schinca D. C.; Scaffardi L. B. Analysis of the structure, configuration, and sizing of Cu and Cu oxide nanoparticles generated by fs laser ablation of solid target in liquids. J. Appl. Phys. 2013, 113, 134305 10.1063/1.4798387. [DOI] [Google Scholar]
- Ali M.; Remalli N.; Yehya F.; Chaudhary A. K.; Srikanth V. V. S. S. Picosecond laser induced fragmentation of coarse Cu2O particles into nanoparticles in liquid media. Appl. Surf. Sci. 2015, 357, 1601–1605. 10.1016/j.apsusc.2015.10.041. [DOI] [Google Scholar]
- Roske C. W.; Lefler J. W.; Muller A. M. Complex nanomineral formation utilizing kinetic control by PLAL. J. Colloid Interface Sci. 2017, 489, 68–75. 10.1016/j.jcis.2016.08.079. [DOI] [PubMed] [Google Scholar]
- Altuwirqi R. M.; Albakri A. S.; Al-Jawhari H.; Ganash E. A. Green synthesis of copper oxide nanoparticles by pulsed laser ablation in spinach leaves extract. Optik 2020, 219, 165280 10.1016/j.ijleo.2020.165280. [DOI] [Google Scholar]
- Tiwari P. K.; Shweta; Sing A. K.; Singh V. P.; Prasad S. M.; Ramawat N.; Tripathi D. K.; Chauhan D. K.; Rai A. K. Liquid assisted pulsed laser ablation synthesized copper oxide nanoparticles (CuO-NPs) and their differential impact on rice seedlings. Ecotoxicol. Environ. Saf. 2019, 176, 321–329. 10.1016/j.ecoenv.2019.01.120. [DOI] [PubMed] [Google Scholar]
- Al-Jumaili B. E. B.; Talib Z. A.; Zakaria A.; Ramizy A.; Ahmed N. M.; Paiman S. B.; Ying J. L.; Muhd I. B.; Baqiah H. Impact of ablation time on Cu oxide nanoparticle green synthesis via pulsed laser ablation in liquid media. Appl. Phys. A: Mater. Sci. Process. 2018, 124, 577 10.1007/s00339-018-1995-5. [DOI] [Google Scholar]
- Gondal M. A.; Qahtan T. F.; Dastageer M. A.; Saleh T. A.; Maganda Y. W.; Anjum D. H. Effects of oxidizing medium on the composition, morphology and optical properties of copper oxide nanoparticles produced by pulsed laser ablation. Appl. Surf. Sci. 2013, 286, 149–155. 10.1016/j.apsusc.2013.09.038. [DOI] [Google Scholar]
- Nath A.; Das A.; Rangan L.; Khare A. Bacterial Inhibition by Cu/Cu2O Nanocomposites Prepared via Laser Ablation in Liquids. Sci. Adv. Mater. 2012, 4, 106–109. 10.1166/sam.2012.1257. [DOI] [Google Scholar]
- Khashan K. S.; Sulaiman G. M.; Abdulameer F. A. Synthesis and Antibacterial Activity of CuO Nanoparticles Suspension Induced by Laser Ablation in Liquid. Arabian J. Sci. Eng. 2016, 41, 301–310. 10.1007/s13369-015-1733-7. [DOI] [Google Scholar]
- Begildayeva T.; Lee S. J.; Yu Y.; Park J.; Kim T. H.; Theerthagiri J.; Ahn A.; Jung H. J.; Choi M. Y. Production of copper nanoparticles exhibiting various morphologies via pulsed laser ablation in different solvents and their catalytic activity for reduction of toxic nitroaromatic compounds. J. Hazard. Mater. 2021, 409, 124412 10.1016/j.jhazmat.2020.124412. [DOI] [PubMed] [Google Scholar]
- Menazea A. A.; Mostafa A. M.; Al-Ashkar E. A. Effect of nanostructured metal oxides (CdO, Al2O3, Cu2O) embedded in PVA via Nd:YAG pulsed laser ablation on their optical and structural properties. J. Mol. Struct. 2020, 1203, 127374 10.1016/j.molstruc.2019.127374. [DOI] [Google Scholar]
- Rawat R.; Tiwari A.; Arun N.; Rao S. V. S. N.; Pathak A. P.; Rao S. V.; Tripathi A. Synthesis of CuO hollow nanoparticles using laser ablation: effect of fluence and solvents. Appl. Phys. A: Mater. Sci. Process. 2020, 126, 226 10.1007/s00339-020-3403-1. [DOI] [Google Scholar]
- Rajan M. T.; Hassan R.; Hong H. P. Laser Plasma Induced Cu2O Nanoparticle Synthesis in Ethanol and Nanofluid Particle Characterization. J. Nanofluids 2019, 8, 1676–1682. 10.1166/jon.2019.1718. [DOI] [Google Scholar]
- Bhardwaj A. K.; Kumar V.; Pandey V.; Naraian R.; Gopal R. Bacterial killing efficacy of synthesized rod shaped cuprous oxide nanoparticles using laser ablation technique. SN Appl. Sci. 2019, 1, 1426 10.1007/s42452-019-1283-9. [DOI] [Google Scholar]
- Goncharova D. A.; Kharlamova T. S.; Lapin I. N.; Svetlichnyi V. A. Chemical and Morphological Evolution of Copper Nanoparticles Obtained by Pulsed Laser Ablation in Liquid. J. Phys. Chem. C 2019, 123, 21731–21742. 10.1021/acs.jpcc.9b03958. [DOI] [Google Scholar]
- Baruah P. K.; Sharma A. K.; Khare A. Role of confining liquids on the properties of Cu@Cu2O nanoparticles synthesized by pulsed laser ablation and a correlative ablation study of the target surface. RSC Adv. 2019, 9, 15124–15139. 10.1039/C9RA00197B. [DOI] [PMC free article] [PubMed] [Google Scholar]
- Liu P. S.; Li Z. G.; Cai W. P.; Fang M.; Luo X. D. Fabrication of cuprous oxide nanoparticles by laser ablation in PVP aqueous solution. RSC Adv. 2011, 1, 847–851. 10.1039/c1ra00261a. [DOI] [Google Scholar]
- Tilaki R. M.; Zad A. I.; Mahdavi S. M. Size, composition and optical properties of copper nanoparticles prepared by laser ablation in liquids. Appl. Phys. A: Mater. Sci. Process. 2007, 88, 415–419. 10.1007/s00339-007-4000-2. [DOI] [Google Scholar]
- Rafique M.; Rafique M. S.; Butt S. H.; Afzal A.; Kalsoom U. Laser nature dependence on enhancement of optical and thermal properties of copper oxide nanofluids. Appl. Surf. Sci. 2019, 483, 187–193. 10.1016/j.apsusc.2019.03.306. [DOI] [Google Scholar]
- Svetlichnyi V. A.; Goncharova D. A.; Shabalina A. V.; Lapin I. N.; Nemoykina A. L. Cu2O Water Dispersions and Nano-Cu2O/Fabric Composite: Preparation by Pulsed Laser Ablation, Characterization and Antibacterial Properties. Nano Hybrids Compos. 2017, 13, 75–81. 10.4028/www.scientific.net/NHC.13.75. [DOI] [Google Scholar]
- Azadi H.; Aghdam H. D.; Malekfar R.; Bellah S. M. Effects of energy and hydrogen peroxide concentration on structural and optical properties of CuO nanosheets prepared by pulsed laser ablation. Results Phys. 2019, 15, 102610 10.1016/j.rinp.2019.102610. [DOI] [Google Scholar]
- Tyurnina A. E.; Shur V. Y.; Kozin R. V.; Kuznetsov D. K.; Pryakhina V. I.; Burban G. V. Synthesis and investigation of stable copper nanoparticle colloids. Phys. Solid State 2014, 56, 1431–1437. 10.1134/S1063783414070324. [DOI] [Google Scholar]
- Xiao J.; Liu P.; Wang C. X.; Yang G. W. External field-assisted laser ablation in liquid: An efficient strategy for nanocrystal synthesis and nanostructure assembly. Prog. Mater. Sci. 2017, 87, 140–220. 10.1016/j.pmatsci.2017.02.004. [DOI] [Google Scholar]
- https://www.rsc.org/periodic-table/element/29/copper.
- Guha S.; Peebles D.; Wieting J. T. Raman and infrared studies of cupric oxide. Bull. Mater. Sci. 1991, 14, 539–543. 10.1007/BF02744682. [DOI] [Google Scholar]
- Joya M. R.; Barba-Ortega J.; Raba A. M. Vibrational Raman modes and particle size analysis of cupric oxide with calcination temperature. Indian J. Pure Appl. Phys. 2019, 57, 268–271. [Google Scholar]
- Xu J. F.; Ji W.; Shen Z. X.; Li W. S.; Tang S. H.; Ye X. R.; Jia D. Z.; Xin X. Q. Raman Spectra of CuO Nanocrystals. J. Raman Spectrosc. 1999, 30, 413–415. . [DOI] [Google Scholar]
- Debbichi L.; Marco de Lucas M. C.; Pierson J. F.; Krüger P. Vibrational Properties of CuO and Cu4O3 from First-Principles Calculations, and Raman and Infrared Spectroscopy. J. Phys. Chem. C 2012, 116, 10232–10237. 10.1021/jp303096m. [DOI] [Google Scholar]
- Yu P. Y.; Shen Y. R. Multiple Resonance Effects on Raman Scattering at the Yellow-Exciton Series of Cu2O. Phys. Rev. Lett. 1974, 32, 373–376. 10.1103/PhysRevLett.32.373. [DOI] [Google Scholar]
- https://xpssimplified.com/elements/copper.php.
- Pauly N.; Tougaard S.; Yubero F. Determination of the Cu 2p primary excitation spectra for Cu, Cu2O and CuO. Surf. Sci. 2014, 620, 17–22. 10.1016/j.susc.2013.10.009. [DOI] [Google Scholar]
- Kuo C. L.; Hwang K. C. Does Morphology of a Metal Nanoparticle Play a Role in Ostwald Ripening Processes?. Chem. Mater. 2013, 25, 365–371. 10.1021/cm3031279. [DOI] [Google Scholar]
- Alloyeau D.; Prévot G.; Le Bouar Y.; Oikawa T.; Langlois C.; Loiseau A.; Ricolleau C. Ostwald Ripening in Nanoalloys: When Thermodynamics Drives a Size-Dependent Particle Composition. Phys. Rev. Lett. 2010, 105, 255901 10.1103/PhysRevLett.105.255901. [DOI] [PubMed] [Google Scholar]
- Dahonog L. A.; Dela Vega M. S. D. C.; Balela M. D. L. pH-dependent synthesis of copper oxide phases by polyol method. J. Phys.: Conf. Ser. 2019, 1191, 012043 10.1088/1742-6596/1191/1/012043. [DOI] [Google Scholar]
- Zoolfakar A. S.; Rani R. A.; Morfa A. J.; O’Mullane A. P.; Kalantar-zadeh K. Nanostructured copper oxide semiconductors: a perspective on materials, synthesis methods and applications. J. Mater. Chem. C 2014, 2, 5247–5270. 10.1039/C4TC00345D. [DOI] [Google Scholar]
- Guisbiers G. Advances in thermodynamic modelling of nanoparticles. Adv. Phys. X 2019, 4, 1668299 10.1080/23746149.2019.1668299. [DOI] [Google Scholar]
- Geoffrion L. D.; Guisbiers G. Quantum confinement: Size on the grill!. J. Phys. Chem. Solids 2020, 140, 109320 10.1016/j.jpcs.2019.109320. [DOI] [Google Scholar]
Associated Data
This section collects any data citations, data availability statements, or supplementary materials included in this article.


