Introduction
Modern ventilators are equipped with monitors that present real-time pulmonary function values, as well as a graphical representation of curves, which allow us to assess pulmonary mechanics and interaction between the patient and the ventilator. Using the graphs of the different curves, we can adjust the ventilatory parameters in the most appropriate way, reducing the patient's respiratory work and maximizing comfort. 1
The objective of this review is to summarize the basic concepts of pulmonary graphics on invasive conventional mechanical ventilation of the neonate, and to demonstrate how they contribute to our understanding of respiratory physiology and the management of the ventilated patient. In order to summarize these basic concepts on graphic interpretation, the authors carefully analyzed medical literature on neonatal ventilation, through books and articles from PubMed.
Curves
The technology used in the calculation of pulmonary function values and in the graphic design of the curves is based on data that can be obtained from the flow or pressure sensor that exists between the patient and the ventilator. Currently, due to the development of precise technology, flow sensors are preferred. 2
The measured tidal volume expired in each respiratory cycle along with a constant adjustment of the inspiratory pressure to reach the target volume in the next breaths, allows ventilation with guaranteed volume. This modality is less influenced by the escape of air around the endotracheal tube, and can be used with leaks of up to 50%. The sensor allows measurement of the flows generated during inspiration and expiration, sends the information to the ventilator, and it is within this that the calculations of flows, pressures, and volumes are made in relation to time and to each other. The flow sensor also allows the detection of whether the inspiratory flow is triggered by the patient, in order to synchronize the ventilator's work with that of the patient. Flow sensors must be calibrated periodically. 3-5
In invasive conventional mechanical ventilation, there are 3 open curves and 2 closed or loop curves. The 3 open curves are: (1) pressure curve; (2) flow curve; and (3) volume curve. The closed or loop curves (loops) are: (1) pressure–volume curve and (2) flow–volume curve. 6,7
Pressure (P) is a quantity that measures the effect of a force; volume (V) is the three-dimensional space occupied by an amount of air; flow (F) translates the movement of a quantity of air (volume) from point A to point B. 8,9
The pressure (P) that the ventilator must generate is the force necessary to inflate the lung with a certain tidal volume of air (Vt) that moves in a flow (F) from the endotracheal tube to the alveolus. Pressure depends on lung compliance and resistance to flow: P = Vt/C + RxF.
From the relationship between pressure, volume, and flow over time, open pressure, flow, and volume curves arise. From the relationship between the 3 variables, the pressure–volume and flow–volume closed (or loop) curves arise. 6-9
To facilitate description, we will only use the term curve to describe curves and loops. The morphology of the curves in pressure ventilation is different from that observed in controlled volume ventilation. In this description, the morphologies of the curves obtained in pressure ventilators used in neonatology are presented. We will not address the curves of high frequency oscillatory ventilation.
Pressure Curve
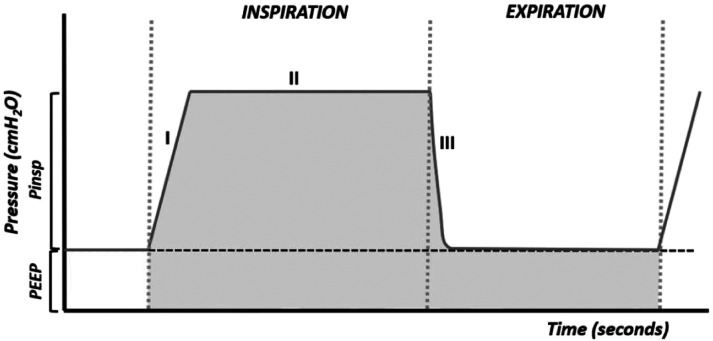
The pressure curve, or pressure–time curve (Figure 1), is not very informative. However, it is useful in adjusting the flow of the ventilator. It is a square curve in which phase I corresponds to the beginning of inflation, in which the pressure will rise above the PEEP (positive end-expiratory pressure), its inclination (ramp) is more vertical the greater the flow of the ventilator and the more rigid the breathing circuit. Phase II is a plateau that appears when the selected pressure is reached and that is maintained throughout the inspiratory phase.
Figure 1.
Pressure–time curve. The shaded area corresponds to the mean airway pressure (Paw).
Phase III represents a rapid reduction in pressure in the respiratory system after the opening of the expiratory valve. In this phase, the pressure drops to the level of PEEP (or the functional residual capacity if a PEEP has not been set).
The pressure curve is useful for adjusting the ventilator flow. In order for the ventilator to be able to provide the desired pressure, it is necessary that the air flow set is sufficient for this pressure to be reached. Flow and tidal volume increase when pressure is increased.
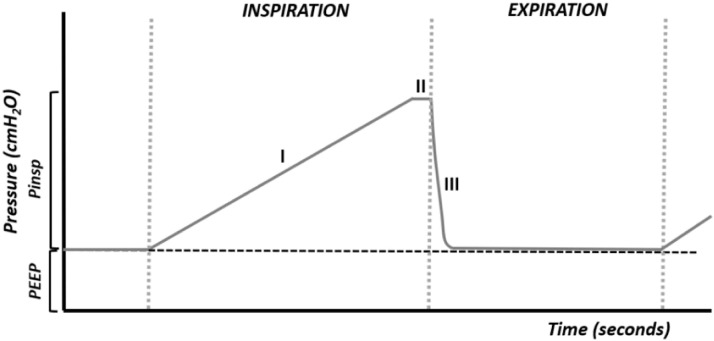
When the flow is insufficient, the desired pressure cannot be reached, or it will be reached at the end of inspiration (Figure 2), decreasing the delivery of air, the tidal volume, and the gas exchange.
Figure 2.
Flow too low. Phase I is quite prolonged, not allowing adequate air delivery.
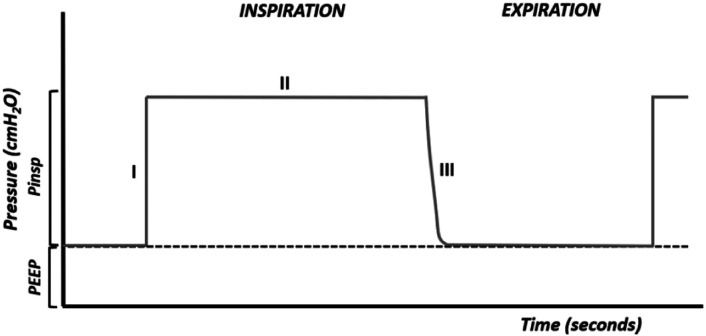
When the flow is excessive, the desired pressure is reached quickly and the opening of the airways and alveoli is too fast and harmful (Figure 3).
Figure 3.
Flow is too high.
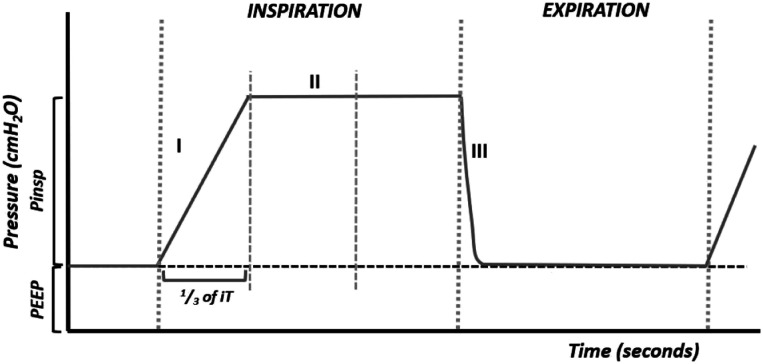
The flow marked on the ventilator will be adequate when it allows the desired pressure to be reached at the end of the first one-third of the inspiration (Figure 4). The slope of the ramp should last one-third of the inspiratory time.
Figure 4.
Adequate flow.
The area under the curve of a breathing cycle gives the mean pressure (Paw) (Figure 1). Oxygenation is a function of the mean pressure that can be increased by increasing the PEEP, the maximum inspiratory pressure, and the inspiratory time. Increasing any of these parameters increases the area under the curve (7-15).
Flow Curve
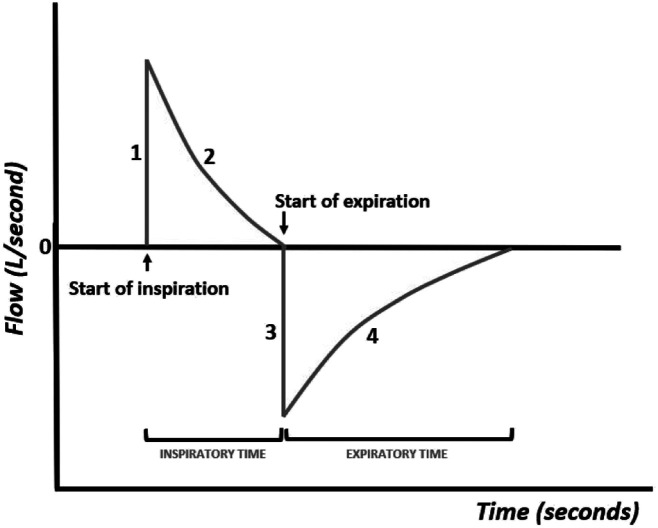
The flow curve, or flow–time curve (Figure 5), shows variations in airflow during inspiration and exhalation.
Figure 5.
Flow–time curve.
The inspiratory curve presents a first phase (phase I) that corresponds to the pressurization of the respiratory system carried out by the ventilator, followed by a phase that depends on the compliance and resistance of the respiratory system (phase II).
At the end of inspiration, the intra-alveolar pressure is the same as that of the airways, so no more air enters. Exhalation is passive and the flow takes on the opposite direction, so the curve is negative, which depends on the pulmonary elastic recoil forces (phase III), and approaches zero with the extension of the expiratory time (phase IV). It is possible to see by the color of the curve whether inspiration is initiated by the patient's breathing effort or whether it is triggered by the ventilator.
The complete entry and exit of air from the respiratory system depends on the marked inspiratory and expiratory times, so the observation of these curves is useful to help the clinician to adjust the inspiratory and expiratory times.
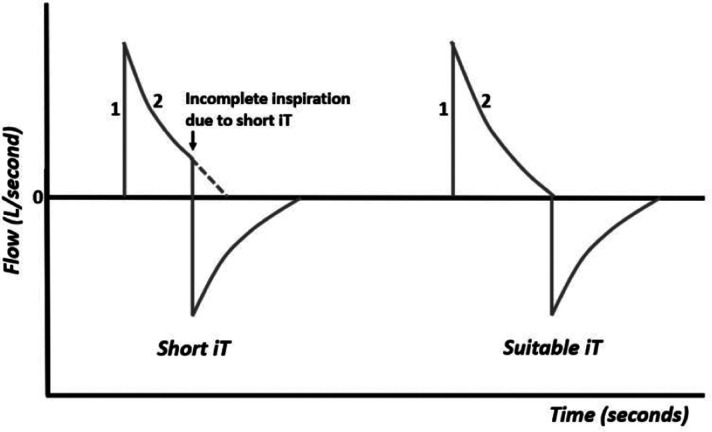
When the inspiratory time (iT) is too short, the air flow is not completely delivered to the lungs (Figure 6). In this case, increasing the inspiratory time allows for complete inspiration.
Figure 6.
Flow–time curve with short iT and suitable iT.
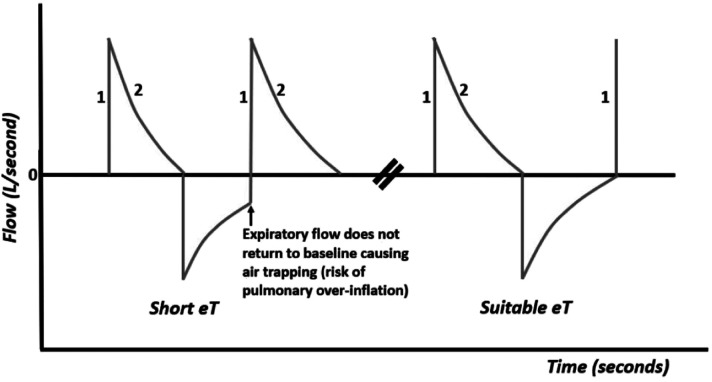
When the expiratory time (eT) is too short, the air flow is not completely expelled from the lungs (Figure 7), resulting in air trapping (air trapping or auto-Peep) with risk of pulmonary over-inflation, interstitial emphysema, pneumothorax, and circulatory impairment. In this case, increasing the expiratory time will allow the air flow to completely exit.
Figure 7.
Flow–time curve with a short eT and a suitable eT.
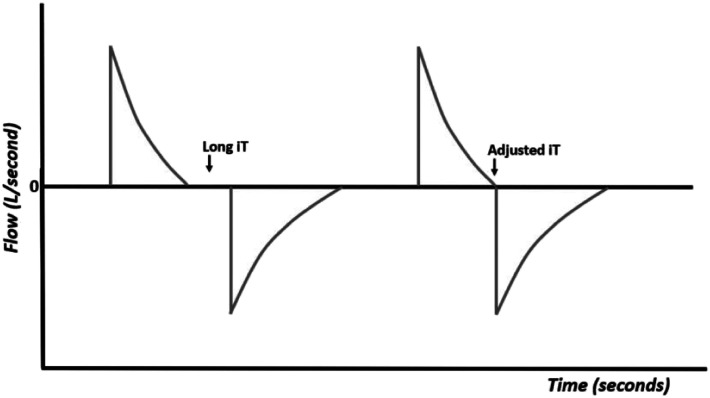
When the inspiratory time is too long (Figure 8), there is timing in the ventilatory cycle that is not used and that may be necessary to complete the expiration time, especially when using high ventilation frequencies. Long inspiratory times also favor the appearance of asynchrony between the patient and the ventilator. In this case, it is enough to decrease the inspiratory time, so that the expiration starts immediately after the end of the inspiration. 7-15
Figure 8.
Flow–time curves with long iT and adjusted iT.
Volume Curve
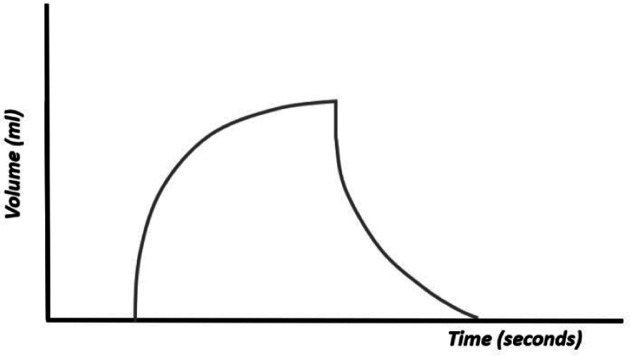
The volume curve, or volume–time curve (Figure 9), represents changes in volume during the respiratory cycle. The volume depends on the pressure programmed in the ventilator and the physical characteristics of the respiratory system (compliance and resistance). This curve summarizes the impact of pressure and flow. In SIMV mode, where both spontaneous and ventilator-generated breaths occur, the volume curve shows the comparative size of each type of breath. It allows the clinician to evaluate whether the patient is generating enough volumes.
Figure 9.
Volume–time curve.
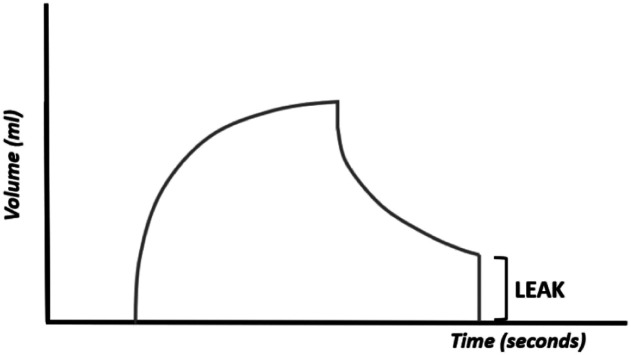
The existence of leakage (the volume of inspired air is not equal to that of exhaled air) is easily observed with these curves (Figure 10). The pressure curves are not altered and the flow curves are altered in the presence of large leaks (the expiratory flow is less than the inspiratory flow). The volume curve is useful for observing the existence of air leakage, particularly when the endotracheal tube is too small in size for the patient. 7-15
Figure 10.
Volume–time curve. The expiratory volume is less than the inspiratory volume.
Pressure–Volume Curve
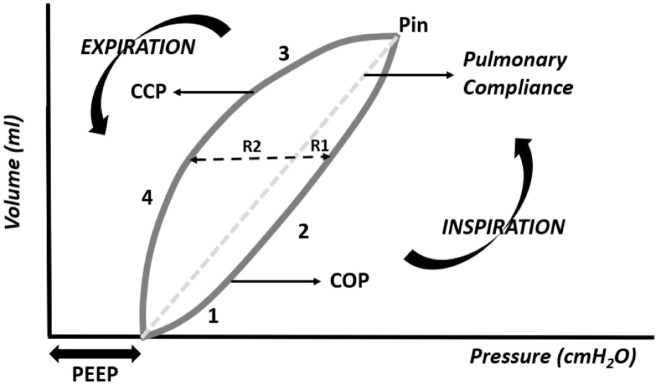
The pressure–volume curve is of great interest to assess pulmonary compliance. In the pressure–volume curve, pressure is represented on the abscissa axis (x-axis) and the volume is represented on the ordinate axis (y-axis) (Figure 11).
Figure 11.
Pressure–volume curve, phases I-IV (R1, resistance in inspiration; R2, resistance in expiration; R1 + R2, pulmonary hysteresis; COP, critical opening pressure; CCP, critical closing pressure; Pin, maximum inspiratory pressure).
Phase I of the curve represents the beginning of inspiration, above the PEEP, to the critical opening point (COP) of the small airways and alveoli, followed by phase II, in which a small pressure significantly increases the intrapulmonary volume. If the PEEP is high enough to exceed the COP, phase I of the curve will not appear on the graph.
At the end of phase II, maximum pressure is reached and the slope of the line that joins the beginning to the end of the curve represents pulmonary compliance (pressure/volume ratio). The greater the pressure required to inflate a given volume, the more inclined the curve will be, translating to less pulmonary compliance. This pressure–volume curve, which is useful in the assessment of pulmonary compliance, is called by several authors as the compliance curve.
In phase III of the curve, which represents expiration, after the critical closing pressure (PCE), the lung volume decreases abruptly until PEEP. Upon expiration, for identical pressure, lung volume is preserved as the pressure in the airways decreases, a mechanical phenomenon called hysteresis. Hysteresis results from less resistance to the air outlet on exhalation than to the air supply on inspiration. Part of this hysteresis results from the presence of pulmonary surfactant. In the absence of surfactant, the alveoli and small airways tend to collapse immediately on expiration, and the inspiratory and expiratory branches of the pressure–volume curve approach, reflecting a reduction in hysteresis.
With increased resistance in the airway, circuit, or both, the loop becomes more round in shape, indicating that a higher pressure is required to overcome the resistance and reach target volume. This should alert the clinician to check whether the endotracheal tube is kinked or obstructed, and whether suctioning or a bronchodilator is needed. If there is inadequate flow, the loop will assume the shape of an 8. This may also reflect the unstable chest wall of the neonate. This is corrected by increasing flow or the rising time. When the expiratory limb of the loop does not return to zero, a leak in the circuit is the problem. The percentage of the leak is displayed on the monitor of the ventilator.
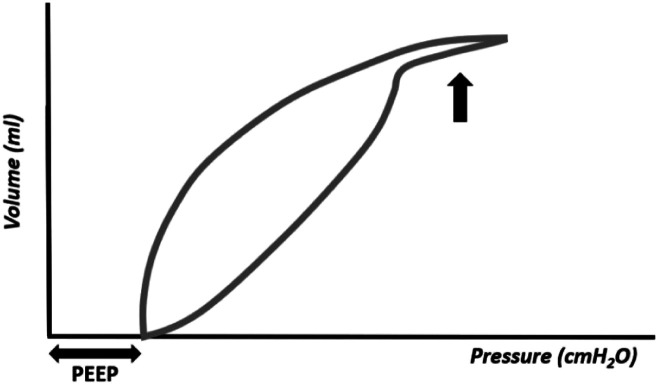
The pressure–volume curve has the advantage of showing the existence of pulmonary over distension (Figure 12). In this situation, the top of the inspiratory curve will show an inflection point followed by a terminal curve in the shape of a "spike." This area of the curve presents a very low compliance, that is, a great pressure is needed to inflate a small volume. In overdistension, the C20/C ratio (compliance in the last 20% of inspiration/total compliance) is < 1.0, and is usually calculated and displayed on the ventilator monitor. The C20/C value must not be < 1.
Figure 12.
Pressure–volume curve showing pulmonary overdistension (large arrow).
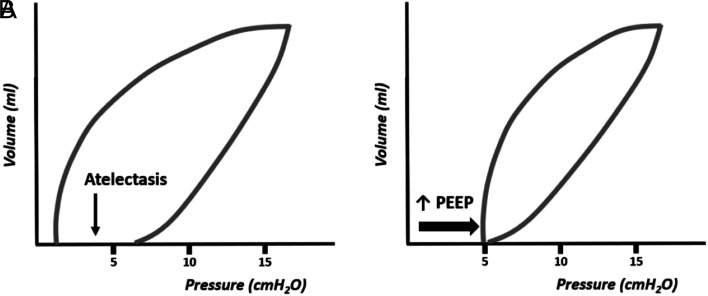
Figure 13 shows the graphical representation of the pressure–volume curve in an atelectatic lung, a situation that can be corrected by raising the PEEP. Increasing PEEP is the best way to increase mean pressure (Paw) and recruit the atelectatic lung, stabilizing the functional residual capacity. Note: it is necessary to take into account that when increasing PEEP without increasing inspiratory pressure (or without using a ventilation mode with a target volume, which keeps the tidal volume constant), although the lung volume and Paw increase, the tidal volume, as well as the minute volume decrease, with a consequent reduction in gas exchange. 7-19
Figure 13.
Pressure–volume curve revealing the presence of atelectasis (A) corrected with the increase in PEEP (B).
Flow–Volume Curve
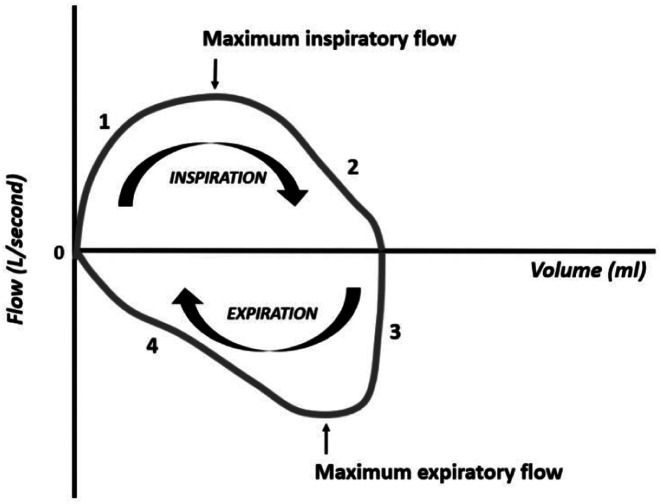
The flow–volume curve is useful in situations with increased resistance. The graphical presentation of the flow–volume curve differs between different ventilators, so the clinician must be familiar with the curves of your ventilator. This description presents one of the possibilities of graphical representation, in which the flow is represented on the ordinate axis (y-axis) and the volume is represented on the abscissa axis (x-axis), (Figure 14). The inspiratory flow is positive and the expiratory flow is negative. During inspiration, the flow ascends rapidly (phase I) followed by a slower phase (phase II) until the end of inspiration. After opening the expiratory valve, the (negative) expiratory flow drops rapidly (phase III), followed by a slower drop until the end of expiration (phase IV). The 4 phases follow each other in a clockwise direction, ending the curve at the point where it started.
Figure 14.
Flow–volume curve. The flow moves clockwise.
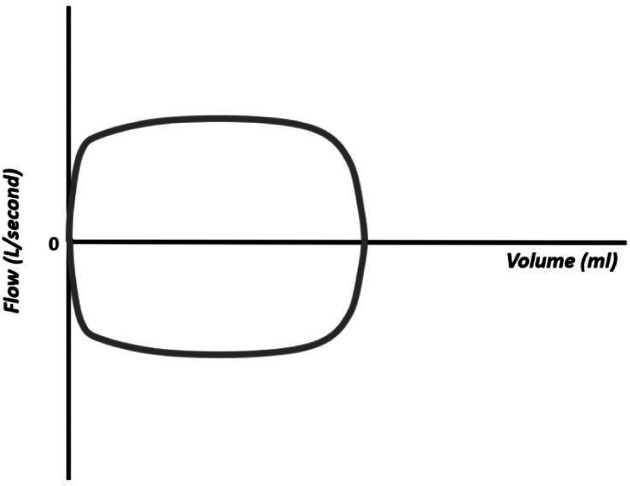
Flow–volume loops are particularly important in the assessment of excessive airway resistance and in alerting for the presence of copious airway secretions or circuit leaks. The shape of the curve varies with various conditions that alter the air flow, making it an important curve in situations of obstruction, that is, of increased resistance. The obstruction can be inspiratory and expiratory, making the morphology of the wave rectangular, as it limits both the inflow and outflow of air (e.g., endotracheal tube too small or subglottic stenosis, Figure 15).
Figure 15.
“Square” flow–volume curve resulting from extra thoracic, inspiratory, and expiratory obstruction (e.g., small endotracheal tube and subglottic stenosis).
When inspiratory obstruction occurs beyond the endotracheal tube, such as luminal obstruction near the cornea or due to compression of the trachea by an abnormal vessel, the morphology of the curve shows obstruction at the air inlet, but not at the air outlet (Figure 16). The obstruction can be an expiration, as seen in children with bronchopulmonary dysplasia (Figure 17).
Figure 16.
Flow–volume curve showing intrathoracic obstruction with limited inspiratory flow (obstruction near the Carina).
Figure 17.
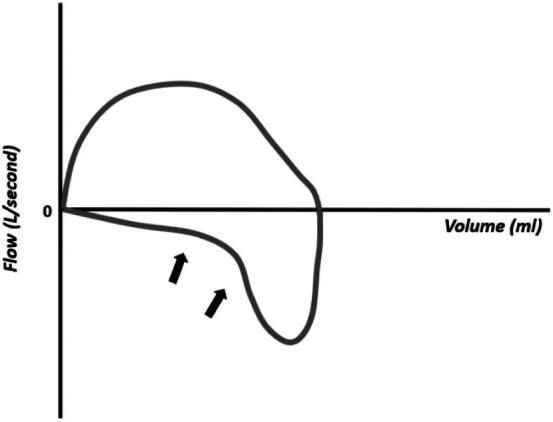
Flow–volume curve showing limited expiratory flow (e.g., in bronchopulmonary dysplasia).
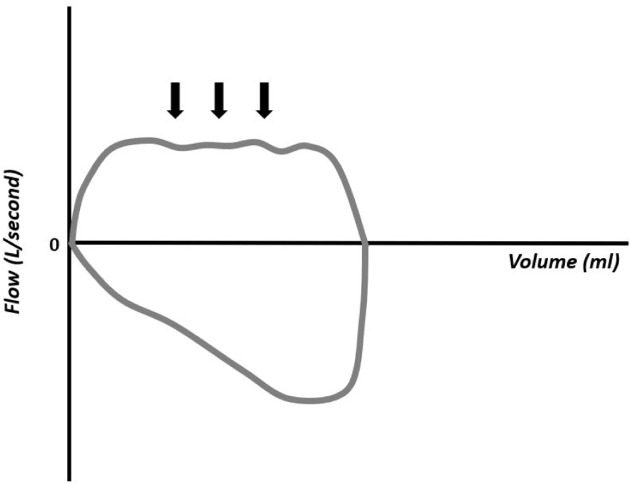
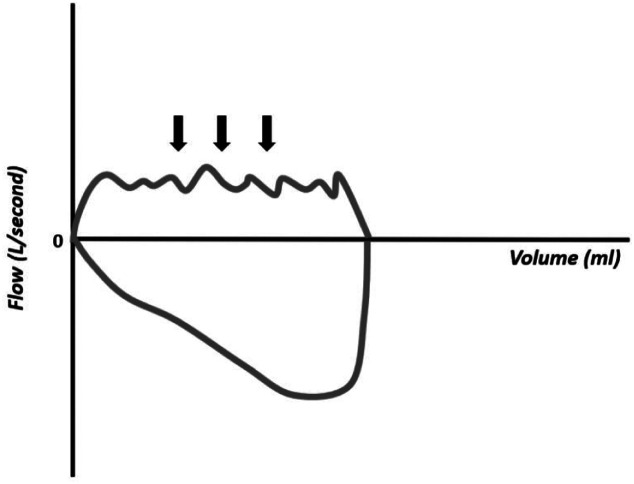
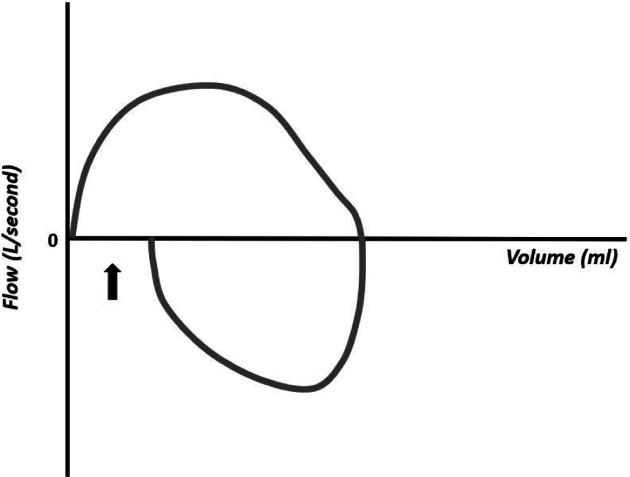
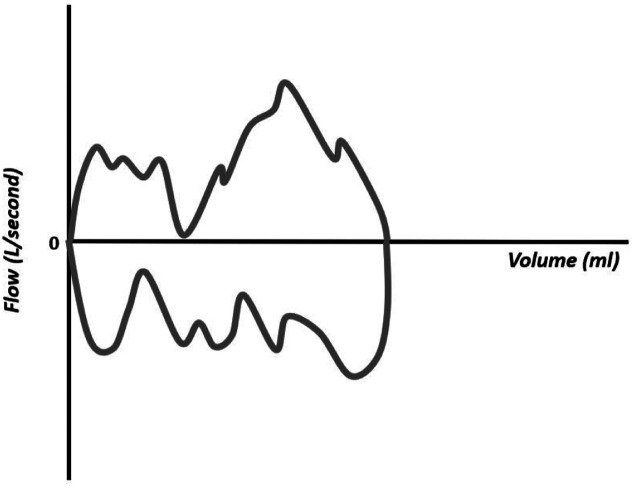
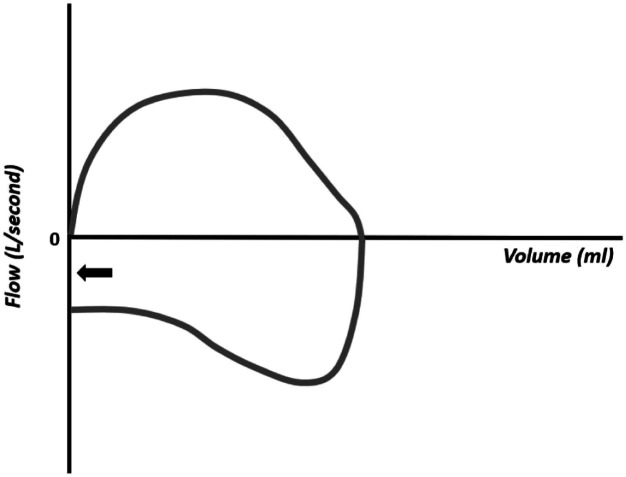
The flow–volume curves also show the accumulation of water in the respiratory circuit or the presence of secretions in the airways (Figure 18), presence of leakage (Figure 19), extubation (Figure 20), unstable airways as in tracheomalacia (Figure 21), and air retention (Figure 22). 7-15
Figure 18.
Flow–volume curve showing irregularity in the inspiratory component resulting from the accumulation of water in the circuit.
Figure 19.
Flow–volume curve showing leakage.
Figure 20.
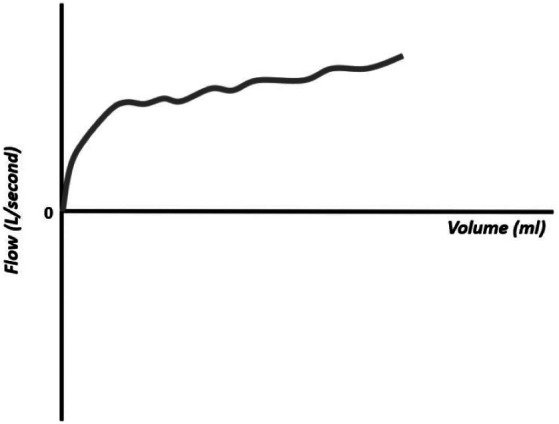
Flow–volume curve showing inspiratory flow that does not return to zero and absence of expiratory flow, compatible with extubation.
Figure 21.
Flow–volume curve showing an unstable airway (e.g., tracheomalacia).
Figure 22.
Flow–volume curve showing air retention: the expiratory flow does not reach zero before the beginning of the next respiratory cycle.
Asynchrony
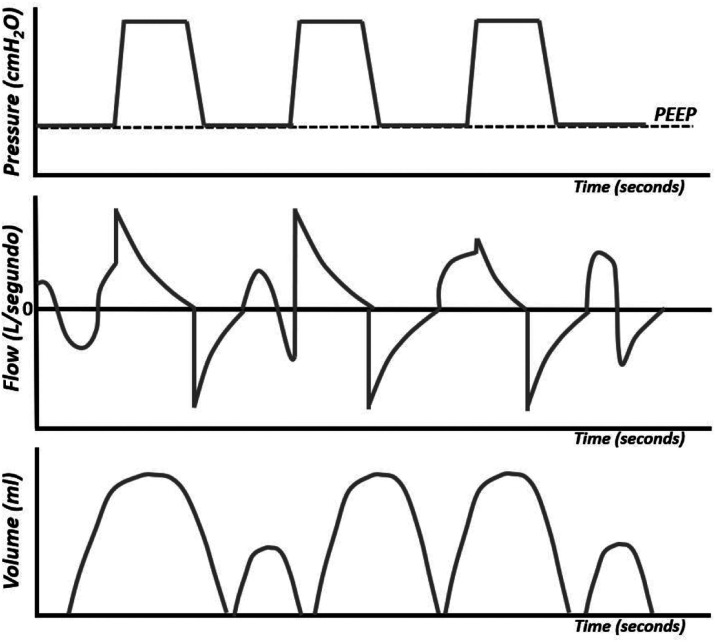
Currently, with the synchronization of conventional ventilation, variations in pressure and volume with each respiratory cycle are practically resolved. In specific situations, in which conventional non-synchronized ventilation (intermittent mandatory ventilation, IMV) is used, we find in the pressure, flow, and volume curves, isolated inspiratory movements of the patient, inspiratory movements of the patient that coincide with the inspiration of the ventilator, and inspiratory cycles of the ventilator that coincide with the patient's expiration (Figure 23).
Figure 23.
Pressure–time, flow–time, and volume–time curves.
In the IMV or IPPV ventilation mode, the pressure curves are maintained at regular intervals and may not correspond to the flow and volume curves caused by the patient's inspirations. When the ventilation insufflations coincide with the patient's inspiratory effort, there is a significant increase in the volume curve.
In the SIMV mode (synchronized intermittent mandatory ventilation), only a certain number of patient inspirations are supported by the ventilator, the other patient inspirations being only supported by the ventilator's PEEP, unless supported by pressure support (PS). With this mode synchronized, the large variations in pressure and volume found in the IMV mode disappear. In SIPPV (synchronized intermittent positive pressure ventilation) and PSV (pressure support ventilation) modes, all inspiratory efforts that reach the trigger threshold are supported by the ventilator. In these modalities, the variation in tidal volume with each inspiration is minimized (2).
Optimizing Settings
Optimizing PIP—For infants managed on pressure-limited ventilator, PIP can be adjusted by viewing tidal volume, with the goal of providing a volume of 5-6 mL/kg.
Optimizing PEEP—A favorable P–V relationship on the loops will help avoiding under distension and over distension; PEEP can be adjusted to provide adequate tidal volume.
Optimizing airflow—The rising time in pressure loop and the flow–volume loop may aid in adjusting flow. Excessive flow may lead to overdistension and excessive PEEP. Overdistension is observed in the P–V loops.
Optimizing inspiratory time—The flow curve will help in optimizing iT. High iT may lead to excessive pressures, decrease in expiratory time, and inadvertent PEEP.
Optimizing expiratory time—The flow curve, again, will help in optimizing eT. If the eT is too short, the expiratory flow will not reach the zero line, meaning there will be air trapping.
Optimizing synchrony—Using synchronized modes of ventilation, asynchrony may result from a flow sensor that needs calibration, water on the circuit, or secretions, pain or discomfort of the patient. You may need to correct any of these details.
Optimizing tidal volume—The shape of the P–V loop will reveal if there is under or over distension and adequate PEEP; if there is inadequate flow, the loop will assume the shape of an 8.
Summary
Continuous real-time ventilator graphics are a useful tool that can help clinicians in understanding the respiratory physiology of the ventilated patient and the complications that can occur during ventilation, reducing the number of blood gas analyses and radiographs, and reducing the costs of care along with an increase in the patient´s comfort.
Statement:
The figures in this article are original and were drawn by Dr. Paulo Soares.
Funding Statement
The authors declared that this study has received no financial support.
Footnotes
Ethical Committee Approval: N/A.
Informed Consent: N/A.
Peer-review: Externally peer-reviewed.
Author Contributions: Literature Review - G.R.; Writing - G.G.; Critical Review - P.S.
Conflict of Interest: The authors have no conflict of interest to declare.
References
- 1. Rocha G, Guimarães H, Soares P. Ventilation of the Newborn. 1st ed. Portugal: Edições LIDEL; 2021. [Google Scholar]
- 2. Mammel MC, Donn SM. Real-time pulmonary graphics. Semin Fetal Neonatal Med. 2015;20(3):181–1. 91. 10.1016/j.siny.2015.01.004) [DOI] [PubMed] [Google Scholar]
- 3. Donn SM, Nicks JJ, Becker MA. Flow-synchronized ventilation of preterm infants with respiratory distress syndrome. J Perinatol. 1994;14(2):90–9. 4. [PubMed] [Google Scholar]
- 4. Schena E, Massaroni C, Saccomandi P, Cecchini S. Flow measurement in mechanical ventilation: a review. Med Eng Phys. 2015;37(3):257–2. 64. 10.1016/j.medengphy.2015.01.010) [DOI] [PubMed] [Google Scholar]
- 5. Heulitt MJ, Holt SJ, Thurman TL. Accuracy of small tidal volume measurement comparing two ventilator airway sensors. J Pediatr Intensive Care. 2013;2(1):33–38.. 10.3233/PIC-13046) [DOI] [PMC free article] [PubMed] [Google Scholar]
- 6. Goldsmith JP, Karotkin EH, Keszler M, Suresh GK. Assisted Ventilation of the Neonate. An Evidence-Based Approach to Newborn Respiratory Care. 6th ed. Philadelphia: Elsevier, Inc; 2017. [Google Scholar]
- 7. Rajiv PK, Vidyasagar D, Lakshminrusimha S, Polin RA. Essentials of Neonatal Ventilation. India: Elsevier; 2019. [Google Scholar]
- 8. Azagra AM, Serrano A, Casado JC. Ventilación Mecánica en recién nacidos, lactantes e niños. 3. Madrid: Ergon; 2018. [Google Scholar]
- 9. Villanueva AM, Orive JP. Manual de Ventilación Mecánica Pediátrica e Neonatal, Grupo de Trabajo de Respiratorio. SECIP. Madrid: Ergon; 2015. [Google Scholar]
- 10. Schachter EN, Lehnert BE, Specht W. Pressure-time relationships of pressure-limited neonatal ventilators. Crit Care Med. 1983;11(3):177–1. 81. 10.1097/00003246-198303000-00006) [DOI] [PubMed] [Google Scholar]
- 11. Corona TM, Aumann M. Ventilator waveform interpretation in mechanically ventilated small animals. J Vet Emerg Crit Care (San Antonio). 2011;21(5):496–514.. 10.1111/j.1476-4431.2011.00673.x) [DOI] [PubMed] [Google Scholar]
- 12. Becker MA, Donn SM. Real-time pulmonary graphic monitoring. Clin Perinatol. 2007;34(1):1–17, v., v. 10.1016/j.clp.2006.12.002) [DOI] [PubMed] [Google Scholar]
- 13. Bhutani VK. Clinical applications of pulmonary function and graphics. Semin Neonatol. 2002;7(5):391–39. 9. 10.1053/siny.2002.0133) [DOI] [PubMed] [Google Scholar]
- 14. Bing D. Neonatal pulmonary function testing. Respir Care Clin N Am. 1997;3(2):333–3. 50. [PubMed] [Google Scholar]
- 15. Devlieger H, Bayet T, Lombet J, Naudé S, Eugène C. The flow-pressure plot: a new look on the patient-ventilator interaction in neonatal care. Semin Perinatol. 2002;26(6):425–4. 31. 10.1053/sper.2002.37316) [DOI] [PubMed] [Google Scholar]
- 16. Waugh JB, Deshpand VM, Harwood RJ. Pressure-Volume and Flow-Volume Loops. Rapid Interpretation of Ventilator Waveforms. New Jersey: Pearson education, Inc; 2007:23–52.. [Google Scholar]
- 17. Fisher JB, Mammel MC, Coleman JM, Bing DR, Boros SJ. Identifying lung overdistention during mechanical ventilation by using volume-pressure loops. Pediatr Pulmonol. 1988;5(1):10–1. 4. 10.1002/ppul.1950050104) [DOI] [PubMed] [Google Scholar]
- 18. Muscedere JG, Mullen JB, Gan K, Slutsky AS. Tidal ventilation at low airway pressures can augment lung injury. Am J Respir Crit Care Med. 1994;149(5):1327–13. 34. 10.1164/ajrccm.149.5.8173774) [DOI] [PubMed] [Google Scholar]
- 19. Dreyfuss D, Soler P, Basset G, Saumon G. High inflation pressure pulmonary edema. Respective effects of high airway pressure, high tidal volume, and positive end-expiratory pressure. Am Rev Respir Dis. 1988;137(5):1159–11. 64. 10.1164/ajrccm/137.5.1159) [DOI] [PubMed] [Google Scholar]


 Content of this journal is licensed under a