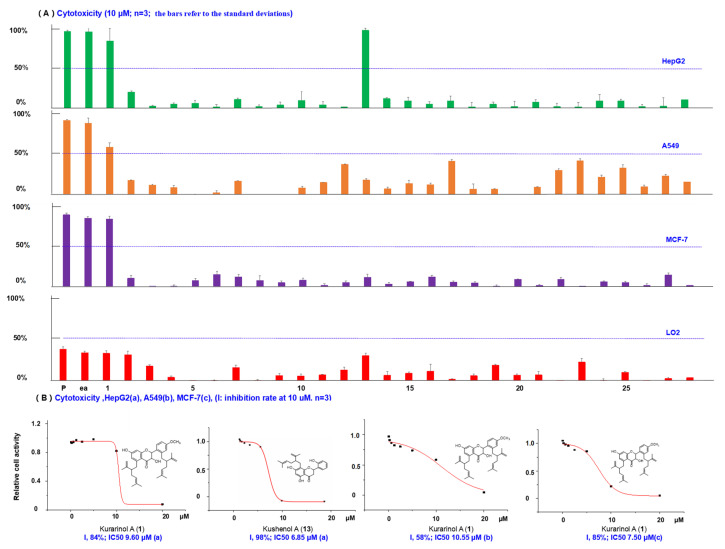
Figure 6.
(A) Bioactivity screening results for cytotoxic inhibition activities of compounds 1–28. (p, positive drug irinotecan, HepG2, 0.6 μM; A549, 1.0 μM; MCF-7, 0.9 μM; ea, EtOH crude extracts 25 μg/mL). (B) The dose–inhibition rate curves for active compounds and their IC50 values. (a: data of HepG2, b: data of A549, c: data of MCF-7).

