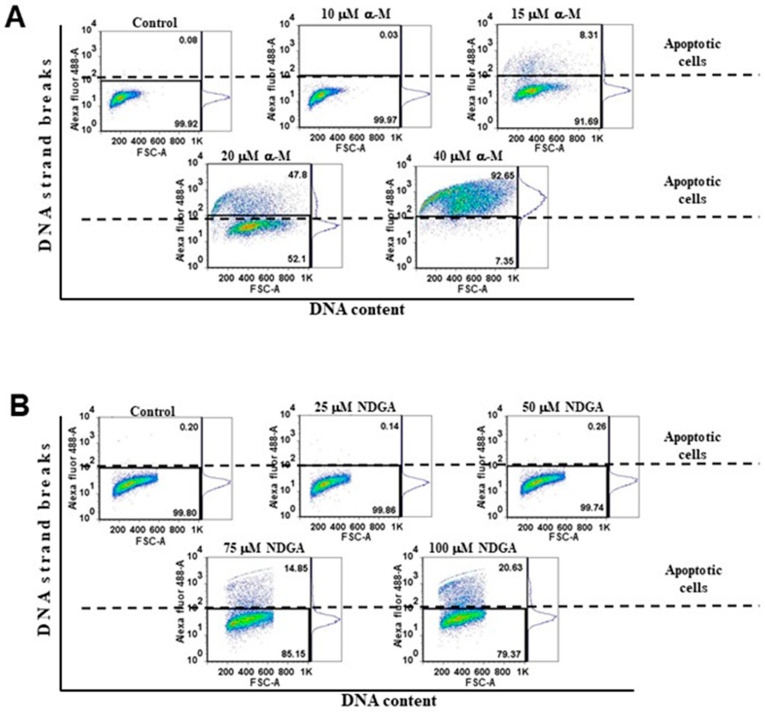
Figure 5.
TUNEL assay of the dose–response curves of α-mangostin and NDGA on Daoy cells. (A,B) Representative histograms (dot plots) are shown. The Q1 region in the dot plots represents TUNEL-positive staining cells with the APO-BrdUTM TUNEL Assay kit. Mean and SEM of at least three independent experiments were analyzed with one-way analysis of variance and Dunnett’s multiple comparison test.

