Abstract
Objective
The aim of the current study was, first, to assess the coronary artery calcium (CAC) scoring potential of spectral photon-counting CT (SPCCT) in comparison with computed tomography (CT) for routine clinical protocols. Second, improved CAC detection and quantification at reduced slice thickness were assessed.
Methods
Raw data was acquired and reconstructed with several combinations of reduced slice thickness and increasing strengths of iterative reconstruction (IR) for both CT systems with routine clinical CAC protocols for CT. Two CAC-containing cylindrical inserts, consisting of CAC of different densities and sizes, were placed in an anthropomorphic phantom. A specific CAC was detectable when 3 or more connected voxels exceeded the CAC scoring threshold of 130 Hounsfield units (HU). For all reconstructions, total CAC detectability was compared between both CT systems. Significant differences in CAC quantification (Agatston and volume scores) were assessed with Mann-Whitney U tests. Furthermore, volume scores were compared with the known CAC physical.
Results
CAC scores for routine clinical protocols were comparable between SPCCT and CT. SPCCT showed 34% and 4% higher detectability of CAC for the small and large phantom, respectively. At reduced slice thickness, CAC detection increased by 142% and 169% for CT and SPCCT, respectively. In comparison with CT, volume scores from SPCCT were more comparable with the physical volume of the CAC.
Conclusion
CAC scores using routine clinical protocols are comparable between conventional CT and SPCCT. The increased spatial resolution of SPCCT allows for increased detectability and more accurate CAC volume estimation.
Key Points
• Coronary artery calcium scores using routine clinical protocols are comparable between conventional CT and spectral photon-counting CT.
• In comparison with conventional CT, increased coronary artery calcium detectability was shown for spectral photon-counting CT due to increased spatial resolution.
• Volumes scores were more accurately determined with spectral photon-counting CT.
Supplementary Information
The online version contains supplementary material available at 10.1007/s00330-021-08152-w.
Keywords: X-ray computed tomography, Calcium, Coronary vessels, Imaging phantoms
Introduction
Spectral photon-counting computed tomography (SPCCT) is a novel emerging technology within the field of X-ray diagnostic radiology [1–7]. This technology employs energy discriminating photon-counting detectors (PCDs) to detect individual photons in more than 2 energy bins. Due to high photon flux in CT, small-pixel detectors are required to allow for individual photons to be counted without pulse pile-up effects [8–10]. In turn, the smaller PCD pixels result in superior spatial resolution in comparison with standard conventional energy integrating detector (EID) CT, which can be a major benefit for the assessment of coronary artery calcifications (CAC) [5, 11–14].
CAC is traditionally quantified on CT using the Agatston methodology (e.g., 120 peak kilovolt (kVp) acquisition; 3-mm slice thickness reconstruction) [15]. Quantification with Agatston scores is recommended by several guidelines to evaluate risk assessment for coronary artery disease [16–18]. The increased in-plane spatial resolution of SPCCT may result in reclassification of risk categories, as partial volume effects are decreased [19]. Especially small- and low-density coronary calcifications might not be resolved on the current EID CT system. This can potentially lead to the erroneous conclusion of a zero Agatston score, and correspondingly a misclassification to the lowest risk category. With the increased in-plane spatial resolution of SPCCT, the certainty of zero Agatston scores and Agatston score reproducibility can both potentially be increased. Through-plane increased spatial resolution will result in the same advantages, when data is reconstructed at small slice thickness. Furthermore, Agatston scores resulting from larger or higher density CAC can be impacted by this increased spatial resolution as well because of reduced blooming artefacts.
In addition to an increase in spatial resolution, SPCCT also decreases the impact of electronic noise. By setting the lowest energy bin threshold just above the electronic noise signal, the majority of noise can be successfully filtered out [1, 20]. This effect reduces the resulting total image noise [21–23]. This feature can potentially be used to acquire and reconstruct data at reduced slice thicknesses, so that both in-plane and through-plane CAC detection can be increased.
Because differences in Agatston scores between CT systems with EID or PCD elements are largely unknown the aim of the current study was twofold. First, the CAC scoring potential of SPCCT in comparison with conventional EID CT for routine clinical protocols was assessed. Second, the potential for improved CAC detection and quantification at reduced slice thickness will be assessed for SPCCT in comparison with EID CT.
Materials and methods
Phantom
An anthropomorphic (cardio) thoracic CT phantom (QRM Thorax, QRM GmbH) in combination with two different cardiac inserts was used. These inserts were a D100 insert and a cardiac calcification insert (CCI, QRM GmbH). Both inserts include cylindrical calcifications composed of hydroxyapatite (HA) powder. The D100 phantom contains 100 small calcifications of different sizes (ranged from 0.5 to 2.0 mm) and densities (ranged from 90 to 540 mgHAcm-3) and was used for the assessment of calcification detectability [24]. The CCI insert consists of nine calcifications with three different amounts of HA (200, 400, and 800 mgHAcm-3) and three different lengths and diameter (1.0, 3.0, and 5.0 mm) for each amount of HA. Additionally, to evaluate the effect of patient size, acquisitions were performed with and without a fat tissue-equivalent extension ring (QRM-Extension ring, QRM) simulating a small and large-sized patient, respectively [25].
Acquisition and reconstruction parameters
Data acquisition was performed on two CT systems from one manufacturer: a dual-layer CT (DLCT) (IQon Spectral CT, Philips Healthcare) and a clinical spectral photon-counting CT (SPCCT) prototype (SPCCT, Philips Healthcare). The DLCT system was equipped with EID, while the SPCCT system was equipped with novel PCD [26].
Both devices were equipped with the same X-ray source and had the same source-to-isocenter and source-to-detector distances. Apart from the X-ray detection technology, the size of the detector pixels at iso-center was different between both systems, with 0.625 × 0.625 mm for EID and 0.275 × 0.275 mm for PCD. Further technical details concerning the prototype system and its performances are provided in previous studies [27, 28].
For both aims of the current study, routine clinical CAC scoring protocols were used for data acquisition and reconstruction (Table 1). For SPCCT, acquisition and reconstruction parameters were based on DLCT protocols recommended by the manufacturer. For the second aim, raw data were reconstructed at several combinations of slice thicknesses and increments, to assess the potential of improved detectability and quantification for both CT systems (Table 1). To counteract increased image noise at reduced slice thickness, several iterative reconstruction (IR) levels (iDose4 algorithm, Philips Healthcare) were added. Each scan was repeated five times, with manual repositioning between each scan (2-mm translation, 2 degrees rotation).
Table 1.
Acquisition and reconstruction parameters for all used systems for the CAC scoring potential at routine clinical protocols
| Parameter | DLCT | SPCCT |
|---|---|---|
| CT system | IQon | SPCCT |
| Technique | Sequential | Sequential |
| Tube voltage [kVp] | 120 | 120 |
| Tube current time product [mAs] |
Small phantom: 40 Large phantom: 80 |
Small phantom: 40 Large phantom: 80 |
| Automatic exposure correction | Off | Off |
| Focal spot | Standard | Small1 |
| Collimation [mm] | 64 × 0.625 | 64 × 0.275 |
| Energy bin threshold [keV] | Not applicable | 30 (lower) / 120 (upper)1 |
| Field of view [mm] | 220 | 220 |
| Rotation time [s] | 0.27 | 0.33 |
| Slice thickness—increment [mm] |
- 0.67–0.67 1.0–0.5 1.0–1.0 3.0–1.5 3.0–3.0 |
0.67–0.335 0.67–0.67 1.0–0.5 1.0–1.0 3.0–1.5 3.0–3.0 |
| Reconstruction kernel | IQon-Std-B | SPCCT-Std-B2 |
| Reconstruction matrix [pixels] | 512 × 512 | 512 × 512 |
| Reconstruction [iDose level] | 0 / 3 / 5 | 0 / 3 / 5 3 |
| Repetitions | 5 | 5 |
SPCCT was operated in conventional imaging mode, with only 2 thresholds to either suppress electronic noise (lower threshold) or to suppress pile-up counts (upper threshold)Despite differences in detector element size, reconstruction kernel, and reconstruction algorithm for SPCCT, reconstruction parameters for SPCCT were optimized by the manufacturer to get comparable results as with DLCT
The small focal spot is the only available option for the current clinical SPCCT prototype
Analysis
General
Agatston scores were determined from the resulting reconstructed images using a previously validated, in-house developed Python script (Python version 3.7) [29]. To discriminate calcium-containing voxels from background material, a calcium scoring threshold of 130 HU was used. In addition, in line with the vendor-specific implementation for the Agatston score, a minimum connected area of 0.5 mm2 was used to include a group of voxels in the Agatston score of a specific calcification. For the used combination of field-of-view (220 mm) and reconstruction matrix (512 × 512), this results in a minimum of three connected voxels. In order to compare CAC quantification with physical volume, the volume score was also determined using the same in-house developed Python script [30].
In addition to the CAC scores, several image quality metrics were determined. First, mean HU values and noise levels (standard deviation (SD)) of the background material were calculated. Second, mean HU values of the largest calcifications of the CCI insert (5 mm diameter and length) were calculated and compared between both CT systems for the routine clinical protocol. Third, signal-to-noise ratios (SNR) were determined for these same calcifications and reconstructions. SNR was calculated as:
where CAC HU is the mean attenuation of the CAC, and Background HUSD is the SD of the mean attenuation of the background. Fourth, contrast-to-noise ratios (CNR) were also determined for these calcifications and reconstructions. CNR were calculated as:
with Background HUmean the mean of the attenuation of the background. And fifth, a background Agatston score (BAS) was evaluated for the D100 insert, whereby an Agatston score was calculated in the CAC containing slices with the CAC themselves automatically masked, resulting in a BAS score based on only noise [29]. CAC scores for slices with nonzero BAS were excluded, as it was unknown if actual CAC was measured, or if noise led to an Agatston score (Supplemental Figure 1).
Detectability (D100)
Detectability, assessed with the D100 insert, was defined as the ability to determine an Agatston score for a calcification for at least four out of the five repetitions. An Agatston was determined for a calcifications if at least three adjacent (horizontally or vertically) voxels were above the 130HU threshold. For the routine CAC protocol, detectability was assessed using previously described visibility curves [24]. The potential of CAC detection for both CT systems at reduced slice thickness was assessed with the number of detected calcifications.
Quantification (CCI)
For quantification of CAC, evaluated with the CCI insert, median CAC scores and range were calculated from the five repeated measurements. Because DLCT images could not be reconstructed at 0.67-/0.34-mm slice thickness/increment, comparison between SPCCT and DLCT scores was not possible for this slice thickness and increment. Comparisons with physical volume (98.2 mm3) were performed for the volume scores obtained with both CT systems.
Statistical analysis
Mean HU, SNR, and CNR were compared between DLCT and SPCCT using a Mann-Whitney U signed-rank test, with a significance level of p < 0.05. Routine CAC protocol agreement between DLCT and SPCCT for Agatston scores was assessed using the Bland-Altman plots [31]. Differences in CAC quantification potential between DLCT and SPCCT at reduced slice thickness were assessed on the largest calcifications (5 mm diameter and length). For each combination of slice thickness and increment, CAC scores were compared with the reference (DLCT, reconstructed IR level 0) using a Mann-Whitney U signed-rank test, with a significance level of p < 0.05.
All statistical analysis were performed with SPSS version 27 (IBM SPSS Statistics).
Results
Image quality
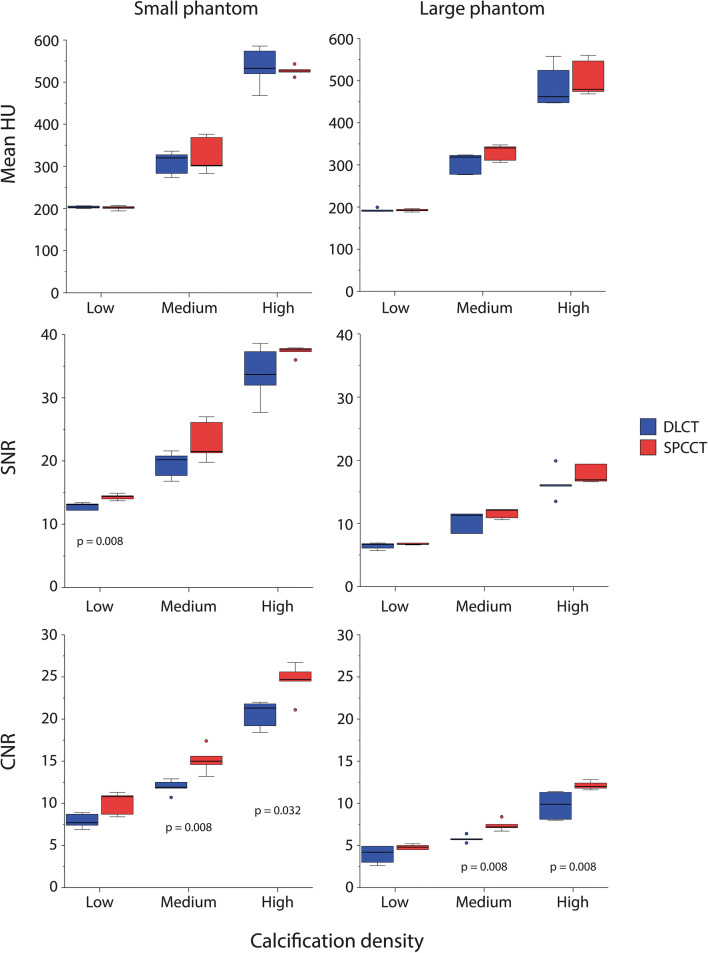
Background mean CT number and image noise for both phantoms sizes and CT systems is shown in Table 2 for routine clinical protocols (3/3 mm slice thickness/increment, iDose level 0). Mean image noise was lower for SPCCT in comparison with DLCT, and for the small phantom size in comparison with the large phantom. Mean HU values and SNR for the largest calcifications of the CCI insert were comparable (p > 0.05) between both CT systems (Fig. 1). Only low-density CAC resulted in significantly different (p = 0.008) SNR between both CT systems. A significant increase (p < 0.05) in CNR for SPCCT was shown for the medium and high-density CAC. SNR and CNR were, in general, higher for the small phantom size for both CT systems.
Table 2.
Background mean CT number (median (range)) and image noise (median (range)) for both phantom sizes and both CT systems for routine clinical protocols (3/3 mm slice thickness/increment, iDose level 0
| CT system | Phantom size | Mean | Noise |
|---|---|---|---|
| DLCT | Small | 35.9 (35.7–38.6) | 15.4 (15.2–16.9) |
| Large | 49.3 (40.7–82.8) | 28.8 (27.7–33.1) | |
| SPCCT | Small | 32.6 (32.3–33.0) | 14.1 (13.9–14.3) |
| Large | 27.9 (27.1–28.3) | 28.4 (28.1–28.8) |
Fig. 1.
Mean HU, SNR, and CNR for the small and large phantom for the large (5 mm diameter and length) calcifications in the CCI insert for both dual-layer CT (DLCT) and spectral photon-counting CT (SPCCT)
Detectability (D100)
Routine CAC protocols
For routine CAC protocols (3/3 mm slice thickness/increment, iDose level 0), representative images for the D100 insert and detectability curves are shown in Supplemental Figure 2 and Supplemental Figure 3, respectively. In comparison with DLCT, more CAC were detected with SPCCT for the small phantom. This effect decreased for increased phantom dimensions.
CAC potential at reduced slice thickness
The percentage of detected CAC, with a total of 500 calcifications (five repetitions of D100 insert) as the denominator, is presented in Table 3. In comparison with 3-mm slice thickness and increment, detection of CAC increased, as expected, with overlapping slices and reduced slice thickness for both DLCT and SPCCT. For DLCT, detection increased by 142% from 12.8 to a maximum of 31% detected calcifications for reconstructions with 1-mm slice thickness, 0.5-mm slice increment, and IR level 0. At these reconstruction settings, SPCCT CAC detection was even 39% higher. SPCCT CAC detection increased by 169% from 17 to a maximum of 46% detected calcifications for reconstructions with 0.67-mm slice thickness, 0.335-mm slice increment, and IR level 3.
Table 3.
Percentage of detected calcifications, with a total of 500 calcifications (five repetitions of D100 insert) as the denominator, for all combinations of slice thickness, slice increment, phantom size, and IR level, for both DLCT and SPCCT. Boldface entries indicate that a system has detected a higher number of calcifications compared to the other system for the same acquisition and reconstruction parameters. Italicized entries indicate that the number of detected calcifications is equal, while entries in bold italics indicate that less calcifications are detected by that system
| CT system | Phantom size | IR level | Slice thickness/slice increment [mm] | |||||
|---|---|---|---|---|---|---|---|---|
| 3/3 | 3/1.5 | 1/1 | 1/0.5 | 0.67/0.67 | 0.67/0.335 | |||
| DLCT | Small | 0 | 12.8% | 17.2% | 29.4% | 31.0% | 10.0% | n/a |
| 3 | 12.6% | 16.6% | 27.2% | 28.8% | 26.2% | n/a | ||
| 5 | 12.6% | 16.4% | 27.2% | 27.6% | 25.2% | n/a | ||
| Large | 0 | 14.8% | 15.6% | 0.0% | 0.0% | 0.0% | n/a | |
| 3 | 14.4% | 14.6% | 1.0% | 5.6% | 0.0% | n/a | ||
| 5 | 12.6% | 13.0% | 18.8% | 19.4% | 0.4% | n/a | ||
| SPCCT | Small | 0 | 17.2% | 21.4% | 40.6% | 43.0% | 45.4% | 43.8% |
| 3 | 17.0% | 20.8% | 38.4% | 39.4% | 44.4% | 46.2% | ||
| 5 | 16.6% | 20.2% | 36.2% | 37.2% | 41.8% | 44.2% | ||
| Large | 0 | 15.4% | 16.4% | 0.8% | 1.8% | 0.0% | 0.0% | |
| 3 | 13.8% | 14.4% | 32.4% | 19.0% | 2.2% | 0.0% | ||
| 5 | 12.8% | 13.6% | 28.0% | 23.0% | 27.2% | 25.2% | ||
Quantification (CCI)
Routine CAC protocols
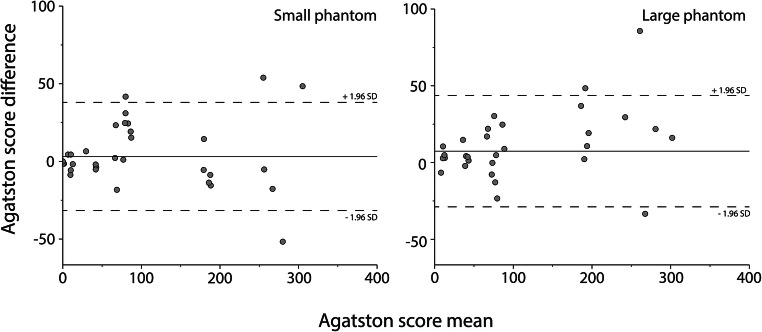
Agreement in CAC scores for the CCI insert between DLCT and SPCCT for routine CAC protocols is shown in Fig. 2. For the small phantom, the mean ± SD difference in Agatston score between both systems was very small at 3.2 ± 17.7. This difference in the Agatston score was slightly higher for the large phantom, at 7.4 ± 13.5. Differences increased with increasing Agatston scores.
Fig. 2.
Bland-Altman plots for routine CAC protocols for the small (left) and large (right) phantom, comparing dual-layer CT (DLCT), and spectral photon-counting CT (SPCCT) Agatston scores. A positive difference indicates a higher Agatston score for DLCT
CAC potential at reduced slice thickness
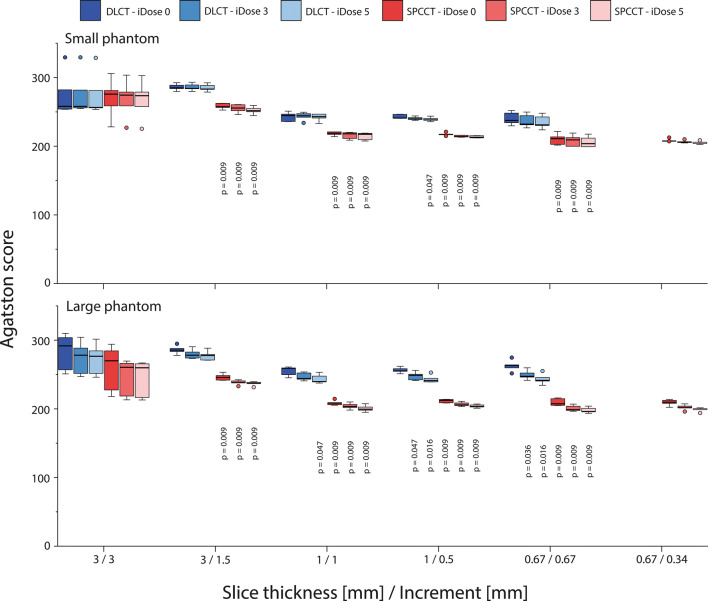
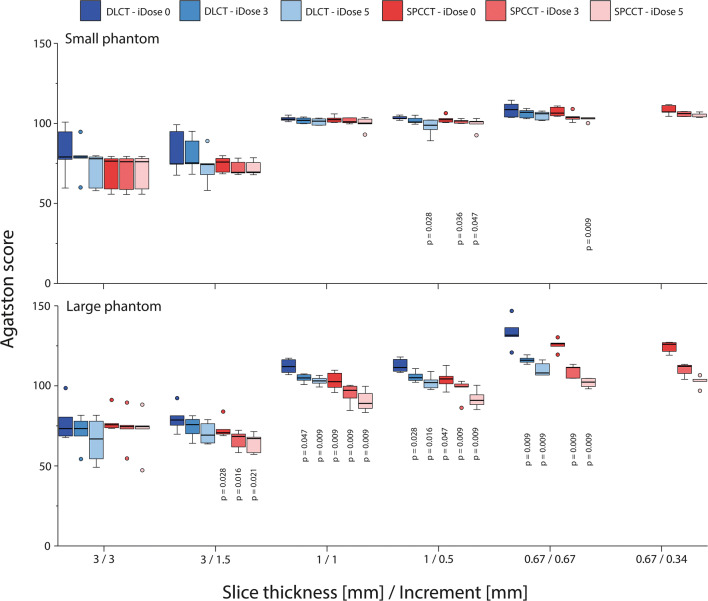
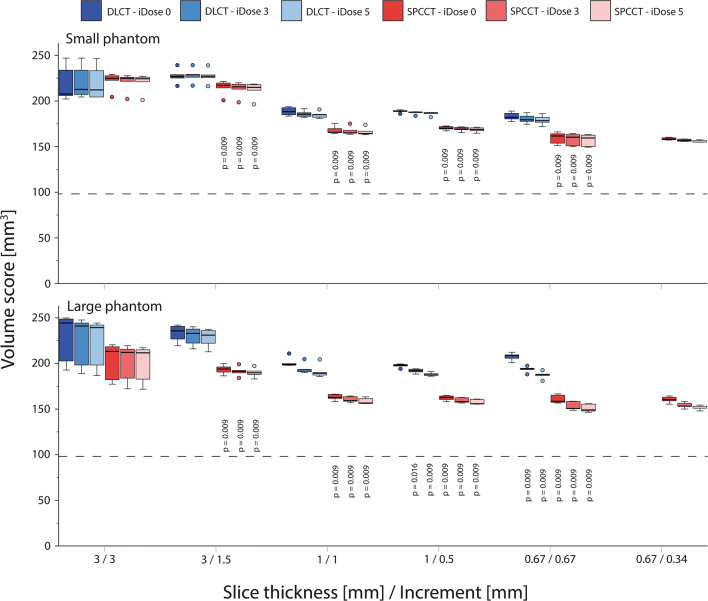
High-density CAC Agatston scores showed significant differences (p < 0.05) between DLCT and SPCCT for almost all combinations of slice thickness and increment, irrespective of applied IR level or patient size (Fig. 3). Low-density CAC Agatston scores for the large phantom again show significant differences (p < 0.05) between DLCT and SPCCT (Fig. 4). However, Agatston scores were comparable for the small phantom size, when appropriate IR levels were applied.
Fig. 3.
Agatston scores of the large calcification (5 mm diameter and length) with high density (800 mgHAcm-3), for acquisitions at different combinations of slice thickness and increment, reconstructed with different levels of IR, on both spectral photon-counting CT (SPCCT) and dual-layer CT (DLCT). Results are shown for the small (upper) and large (lower) phantom. For each combination of slice thickness and increment, p values from significant differences in comparison with the reference (DLCT and iDose 0) are indicated
Fig. 4.
Agatston scores of the large calcification (5 mm diameter and length) with low density (200 mgHAcm-3), for acquisitions at different combinations of slice thickness and increment, reconstructed with different levels of IR, on both spectral photon-counting CT (SPCCT) and dual-layer CT (DLCT). Results are shown for the small (upper) and large (lower) phantom. For each combination of slice thickness and increment, p values from significant differences in comparison with the reference (DLCT and iDose 0) are indicated
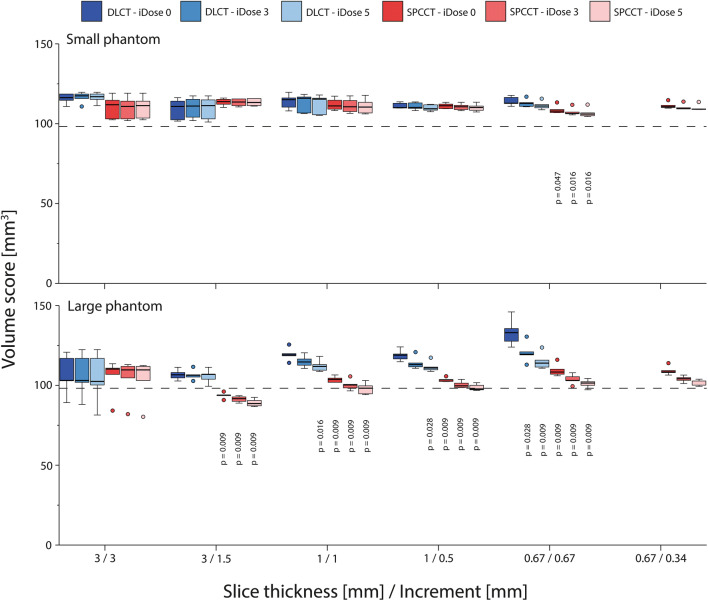
Volume scores showed similar trends as described above for the Agatston score (Figs. 5 and 6). When compared to the physical volume, high-density volume scores showed large overestimations (up to 150%) for all reconstructions. These overestimations decreased at smaller slice thicknesses because of reduced partial volume and blooming artefacts. For all reconstructions, overestimation of physical mass was smaller for SPCCT than for DLCT. Low-density volume scores showed better agreement with physical volume. For the large phantom, physical volume was overestimated by DLCT at reduced slice thickness due to noise effects.
Fig. 5.
Volume scores of the large calcification (5 mm diameter and length) with high density (800 mgHAcm-3), for acquisitions at different combinations of slice thickness and increment, reconstructed with different levels of IR, on both spectral photon-counting CT (SPCCT) and dual-layer CT (DLCT). Results are shown for the small (upper) and large (lower) phantom. For each combination of slice thickness and increment, p values from significant differences in comparison with the reference (DLCT and iDose 0) are indicated. The dashed line indicates the physical volume of the calcification (98.2 mm3)
Fig. 6.
Volume scores of the large calcification (5 mm diameter and length) with low density (200 mgHAcm-3), for acquisitions at different combinations of slice thickness and increment, reconstructed with different levels of IR, on both spectral photon-counting CT (SPCCT) and dual-layer CT (DLCT). Results are shown for the small (upper) and large (lower) phantom. For each combination of slice thickness and increment, p values from significant differences in comparison with the reference (DLCT and iDose 0) are indicated. The dashed line indicates the physical volume of the calcification (98.2 mm3)
Discussion
In the present study, we found that SPCCT Agatston scores are comparable with conventional DLCT Agatston scores for routine CAC protocols. Furthermore, we found SPCCT to be more sensitive for the detection of CAC at reduced slice thickness acquisitions. Finally, we demonstrated that CAC quantification with SPCCT at reduced slice thickness using volume scores was more accurate than DLCT when compared to the actual physical volume of CAC.
Agatston scores are inherently associated with calcification density, due to the maximum voxel-based weighting factor. In addition, blooming artefacts, including partial volume artefacts, further increase the apparent size of medium and high-density CAC [32]. Also, very small calcifications might potentially be missed due to partial volume effects. This is clinically important because small- or low-density CAC may be more vulnerable compared to large or high-density CAC [33]. One solution to reduce blooming and partial volume artefacts is to increase spatial resolution. In the current study, we have shown that the effect of this increased spatial resolution is only minor for clinical CAC protocols, where only the in-plane resolution was improved, while the slice thickness was still set at 3 mm. This resulted in comparable CAC scores for these protocols on both scanners. For reduced slice thickness and/or overlapping slices, however, significant differences between DLCT and SPCCT were shown. For low-density CAC, the blooming artefact is inherently small. However, for the high-density calcification, reduced blooming artefacts resulted in more accurate CAC scores because of smaller deviations between the volume score and physical CAC volume for SPCCT. Furthermore, increased spatial resolution of SPCCT resulted in increased detectability of small or low-density calcifications for SPCCT. Finally, CAC visualization, as determined with SNR and CNR, increased for SPCCT due to reduced image noise in comparison with DLCT. This may be also the effect of a more important energy weighting of the lower energy photons due to the energy-resolving capabilities of the PCDs compared to the EIDs [1]. Altogether, our results are in line with a recent study by Symons et al, who also showed improved CAC CNR for a different SPCCT system, in comparison with conventional EID CT [23].
The strength of our study is that we systematically evaluated CAC scoring potential of SPCCT for routine and reduced slice thickness and slice increment, which provides a basis for future research and potential clinical application. In combination with the key findings of previous studies using SPCCT in the cardiovascular field, this modality is an exciting and promising tool for coronary artery disease with potential great expectations for patient management [6, 12, 34, 35]. Our study also has some limitations. First, we used a non-commercial SPCCT system for our evaluation. Second, we used a static anthropomorphic phantom. Despite the fact that the linear attenuation coefficients of the phantoms were in line with human materials at the used tube potential (120 kVp), a phantom does not completely simulate an actual human, with all internal organs. Also, coronary motion was not taken into account. Third, increased noise levels for reduced slice thickness or increased phantom size resulted in BAS > 0. With this, the possibility to assess CAC detectability was reduced, as it was unclear if a group of voxels above the CAC threshold contained CAC or noise. CAC detectability could therefore potentially be further increased, at the cost of increased radiation dose. Finally, current volume grid parameters were limited to the specifications of the used DLCT. Future studies can assess further improvements for SPCCT, such as other field-of-view and reconstruction matrix combinations, or increased IR strengths as recently reported [27].
In conclusion, CAC scores using routine clinical protocols are comparable between conventional CT and SPCCT. The increased spatial resolution of SPCCT allows for increased detectability and more accurate CAC volume estimation at reduced slice thickness.
Supplementary Information
(DOCX 753 kb)
Abbreviations
- BAS
Background Agatston score
- CAC
Coronary artery calcification
- CNR
Contrast-to-noise ratio
- DLCT
Dual-layer CT
- EID
Energy integrating detector
- HA
Hydroxyapatite
- IR
Iterative reconstruction
- PCD
Photon counting detector
- SD
Standard deviation
- SNR
Signal-to-noise ratio
- SPCCT
Spectral photon-counting CT
Funding
The authors state that this work has not received any funding.
Declarations
Guarantor
The scientific guarantor of this publication is Philippe Douek.
Conflict of Interest
The authors of this manuscript declare no relationships with any companies whose products or services may be related to the subject matter of the article.
Statistics and biometry
No complex statistical methods were necessary for this paper.
Informed consent
Not applicable.
Ethical approval
Institutional Review Board approval was not required because this is a phantom-only study.
Methodology
• prospective
• experimental
• performed at one institution
Footnotes
Publisher’s note
Springer Nature remains neutral with regard to jurisdictional claims in published maps and institutional affiliations.
Niels R. van der Werf and S. Si-Mohamed contributed equally to this work.
References
- 1.Willemink MJ, Persson M, Pourmorteza A, et al. Photon-counting CT: technical principles and clinical prospects. Radiology. 2018;289:293–312. doi: 10.1148/radiol.2018172656. [DOI] [PubMed] [Google Scholar]
- 2.Leng S, Bruesewitz M, Tao S, et al. Photon-counting detector CT: system design and clinical applications of an emerging technology. Radiographics. 2019;39:729–743. doi: 10.1148/rg.2019180115. [DOI] [PMC free article] [PubMed] [Google Scholar]
- 3.Si-Mohamed S, Bar-Ness D, Sigovan M, et al. Review of an initial experience with an experimental spectral photon-counting computed tomography system. Nucl Instruments Methods Phys Res Sect A Accel Spectrometers, Detect Assoc Equip. 2017;873:27–35. doi: 10.1016/j.nima.2017.04.014. [DOI] [Google Scholar]
- 4.Si-Mohamed S, Bar-Ness D, Sigovan M et al (2018) Multicolour imaging with spectral photon-counting CT: a phantom study. Eur Radiol Exp 2. 10.1186/s41747-018-0063-4 [DOI] [PMC free article] [PubMed]
- 5.Taguchi K, Iwanczyk JS. Vision 20/20: Single photon counting x-ray detectors in medical imaging. Med Phys. 2013;40:100901. doi: 10.1118/1.4820371. [DOI] [PMC free article] [PubMed] [Google Scholar]
- 6.Sandfort V, Persson M, Pourmorteza A et al (2020) Spectral photon-counting CT in cardiovascular imaging. J Cardiovasc Comput Tomogr. 10.1016/j.jcct.2020.12.005 [DOI] [PubMed]
- 7.Greffier J, Frandon J. Spectral photon-counting CT system: toward improved image quality performance in conventional and spectral CT imaging. Diagn Interv Imaging. 2021;102(5):271–272. doi: 10.1016/j.diii.2021.02.003. [DOI] [PubMed] [Google Scholar]
- 8.Roessl E, Daerr H, Engel KJ, et al (2011) Combined effects of pulse pile-up and energy response in energy-resolved, photon-counting computed tomography. In: 2011 IEEE Nuclear Science Symposium Conference Record. pp 2309–2313
- 9.Taguchi K, Frey EC, Wang X, et al. An analytical model of the effects of pulse pileup on the energy spectrum recorded by energy resolved photon counting x-ray detectors. Med Phys. 2010;37:3957–3969. doi: 10.1118/1.3429056. [DOI] [PMC free article] [PubMed] [Google Scholar]
- 10.Wang AS, Harrison D, Lobastov V, Tkaczyk JE. Pulse pileup statistics for energy discriminating photon counting x-ray detectors. Med Phys. 2011;38:4265–4275. doi: 10.1118/1.3592932. [DOI] [PubMed] [Google Scholar]
- 11.Leng S, Gutjahr R, Ferrero A et al (2017) Ultra-high spatial resolution, multi-energy CT using photon counting detector technology. Proc SPIE Int Soc Opt Eng 139–148. 10.1016/j.physbeh.2017.03.040 [DOI] [PMC free article] [PubMed]
- 12.Mannil M, Hickethier T, Von Spiczak J, et al. Photon-counting CT: high-resolution imaging of coronary stents. Invest Radiol. 2018;53:143–149. doi: 10.1097/RLI.0000000000000420. [DOI] [PubMed] [Google Scholar]
- 13.Kopp FK, Daerr H, Si-Mohamed S, et al. Evaluation of a preclinical photon-counting CT prototype for pulmonary imaging. Sci Rep. 2018;8:1–9. doi: 10.1038/s41598-018-35888-1. [DOI] [PMC free article] [PubMed] [Google Scholar]
- 14.Sigovan M, Si-Mohamed S, Bar-Ness D, et al. Feasibility of improving vascular imaging in the presence of metallic stents using spectral photon counting CT and K-edge imaging. Sci Rep. 2019;9:1–9. doi: 10.1038/s41598-019-56427-6. [DOI] [PMC free article] [PubMed] [Google Scholar]
- 15.Agatston AS, Janowitz WR, Hildner FJ, et al. Quantification of coronary artery calcium using ultrafast computed tomography. J Am Coll Cardiol. 1990;15:827–832. doi: 10.1016/0735-1097(90)90282-T. [DOI] [PubMed] [Google Scholar]
- 16.Goff DC, Lloyd-Jones DM, Bennett G, et al. 2013 ACC/AHA guideline on the assessment of cardiovascular risk: a report of the American college of cardiology/American heart association task force on practice guidelines. Circulation. 2014;129:49–76. doi: 10.1161/01.cir.0000437741.48606.98. [DOI] [PubMed] [Google Scholar]
- 17.Greenland P, Alpert JS, Beller GA, et al. 2010 ACCF/AHA guideline for assessment of cardiovascular risk in asymptomatic adults: executive summary: a report of the American College of cardiology foundation/American Heart association task force on practice guidelines. Circulation. 2010;122:2748–2764. doi: 10.1161/CIR.0b013e3182051bab. [DOI] [PubMed] [Google Scholar]
- 18.Hecht H, Blaha MJ, Berman DS, et al. Clinical indications for coronary artery calcium scoring in asymptomatic patients: expert consensus statement from the Society of Cardiovascular Computed Tomography. J Cardiovasc Comput Tomogr. 2017;11:157–168. doi: 10.1016/j.jcct.2017.02.010. [DOI] [PubMed] [Google Scholar]
- 19.Blaha MJ, Cainzos-Achirica M, Greenland P, et al. Role of coronary artery calcium score of zero and other negative risk markers for cardiovascular disease: the multi-ethnic study of atherosclerosis (MESA) Circulation. 2016;133:849–858. doi: 10.1161/CIRCULATIONAHA.115.018524. [DOI] [PMC free article] [PubMed] [Google Scholar]
- 20.Hsieh SS (2020) Design considerations for photon-counting detectors: connecting detectors characteristics to system performances. In: Spectral, Photon Counting Computed Tomography: Technology and Applications. p 326 41
- 21.Leng S, Yu Z, Halaweish A, et al. Dose-efficient ultrahigh-resolution scan mode using a photon counting detector computed tomography system. J Med Imaging. 2016;3:043504. doi: 10.1117/1.jmi.3.4.043504. [DOI] [PMC free article] [PubMed] [Google Scholar]
- 22.Pourmorteza A, Symons R, Henning A, et al. Dose efficiency of quarter-millimeter photon-counting computed tomography: first-in-human results. Invest Radiol. 2018;53:365–372. doi: 10.1097/RLI.0000000000000463. [DOI] [PubMed] [Google Scholar]
- 23.Symons R, Sandfort V, Mallek M, et al. Coronary artery calcium scoring with photon-counting CT: first in vivo human experience. Int J Cardiovasc Imaging. 2019;35:733–739. doi: 10.1007/s10554-018-1499-6. [DOI] [PubMed] [Google Scholar]
- 24.Groen JM, Kofoed KF, Zacho M, et al. Calcium score of small coronary calcifications on multidetector computed tomography: results from a static phantom study. Eur J Radiol. 2013;82:e58–e63. doi: 10.1016/j.ejrad.2012.09.018. [DOI] [PubMed] [Google Scholar]
- 25.McCollough CH, Ulzheimer S, Halliburton SS, et al. Coronary artery calcium: a multi-institutional, multimanufacturer international standard for quantification at cardiac CT. Radiology. 2007;243:527–538. doi: 10.1148/radiol.2432050808. [DOI] [PubMed] [Google Scholar]
- 26.Steadman R, Herrmann C, Livne A. ChromAIX2: a large area, high count-rate energy-resolving photon counting ASIC for a spectral CT prototype. Nucl Instruments Methods Phys Res Sect A Accel Spectrometers, Detect Assoc Equip. 2017;862:18–24. doi: 10.1016/j.nima.2017.05.010. [DOI] [Google Scholar]
- 27.Si-Mohamed S, Boccalini S, Rodesch P-A et al (2021) Feasibility of lung imaging with a large field-of-view spectral photon-counting CT system. Diagn Interv Imaging. 10.1016/j.diii.2021.01.001 [DOI] [PubMed]
- 28.Boccalini S, Si-Mohamed S, Dessouky R, Sigovan M, Boussel L, Douek P. Feasibility of human vascular imaging of the neck with a large field-of-view spectral photon-counting CT system. Diagn Interv Imaging. 2021;102(5):329–332. doi: 10.1016/j.diii.2020.12.004. [DOI] [PubMed] [Google Scholar]
- 29.Booij R, van der Werf NR, Budde RPJ, et al. Dose reduction for CT coronary calcium scoring with a calcium-aware image reconstruction technique: a phantom study. Eur Radiol. 2020;30:3346–3355. doi: 10.1007/s00330-020-06709-9. [DOI] [PMC free article] [PubMed] [Google Scholar]
- 30.Callister TQ, Cooil B, Raya SP, et al. Coronary artery disease: improved reproducibility of calcium scoring with an electron-beam CT volumetric method. Radiology. 1998;208:807–814. doi: 10.1148/radiology.208.3.9722864. [DOI] [PubMed] [Google Scholar]
- 31.Bland MJ, Altman DG. Measuring agreement in method comparison studies. Stat Methods Med Res. 1999;8:135–160. doi: 10.1177/096228029900800204. [DOI] [PubMed] [Google Scholar]
- 32.Hoffmann U, Ferencik M, Cury RC, Pena AJ. Coronary CT angiography. J Nucl Med. 2006;57:797–806. doi: 10.1016/j.crvasa.2015.09.008. [DOI] [PubMed] [Google Scholar]
- 33.Alluri K, Joshi PH, Henry TS, et al. Scoring of coronary artery calcium scans: History, assumptions, current limitations, and future directions. Atherosclerosis. 2015;239:109–117. doi: 10.1016/j.atherosclerosis.2014.12.040. [DOI] [PubMed] [Google Scholar]
- 34.Dweck MR, Maurovich-Horvat P, Leiner T, et al. Contemporary rationale for non-invasive imaging of adverse coronary plaque features to identify the vulnerable patient: a position paper from the European Society of Cardiology Working Group on Atherosclerosis and Vascular Biology and the European Associ. Eur Heart J Cardiovasc Imaging. 2020;21:1177–1183. doi: 10.1093/ehjci/jeaa201. [DOI] [PubMed] [Google Scholar]
- 35.Halttunen N, Lerouge F, Chaput F, et al. Hybrid Nano-GdF3 contrast media allows pre-clinical in vivo element-specific K-edge imaging and quantification. Sci Rep. 2019;9:1–8. doi: 10.1038/s41598-019-48641-z. [DOI] [PMC free article] [PubMed] [Google Scholar]
Associated Data
This section collects any data citations, data availability statements, or supplementary materials included in this article.
Supplementary Materials
(DOCX 753 kb)


