

Abstract
Background
SARS‐CoV‐2 outbreaks in nursing homes (NHs) have been devastating and have led to the creation of coronavirus disease 2019 (COVID‐19) units within NHs to care for affected patients. Frequency and persistence of SARS‐CoV‐2 environmental contamination in these units have not been studied.
Methods
A prospective cohort study was conducted between October 2020 and January 2021 in four Michigan NHs. Swabs from high‐touch surfaces in COVID‐19‐infected patient rooms were obtained at enrollment and follow‐up. Demographic and clinical data were collected from clinical records. Primary outcome of interest was the probability of SARS‐CoV‐2 RNA detection from specific environmental surfaces in COVID‐19 patient rooms. We used multivariable logistic regression to assess patient risk factors for SARS‐CoV‐2 contamination. Pairwise Phi coefficients were calculated to measure correlation of site‐specific environmental detection upon enrollment and during follow‐up.
Results
One hundred and four patients with COVID‐19 were enrolled (61.5% >80 years; 67.3% female; 89.4% non‐Hispanic White; 51% short stay) and followed up for 241 visits. The study population had significant disabilities in activities of daily living (ADL; 81.7% dependent in four or more ADLs) and comorbidities, including dementia (55.8%), diabetes (40.4%), and heart failure (32.7%). Over the 3‐month study period, 2087 swab specimens were collected (1896 COVID‐19 patient rooms, 191 common areas). SARS‐CoV‐2 positivity was 28.4% (538/1896 swabs) on patient room surfaces and 3.7% (7/191 swabs) on common area surfaces. Nearly 90% (93/104) of patients had SARS‐CoV‐2 contamination in their room at least once. Environmental contamination upon enrollment correlated with contamination of the same site during follow‐up. Functional independence increased the odds of proximate contamination.
Conclusions
Environmental detection of viral RNA from surfaces in the rooms of COVID‐19 patients is nearly universal and persistent; more investigation is needed to determine the implications of this for infectiousness. Patients with greater independence are more likely than fully dependent patients to contaminate their immediate environment.
Keywords: COVID‐19, nursing homes, SARS‐CoV‐2
Key points
The coronavirus disease 2019 (COVID‐19) patients shed virus into their surrounding environment frequently and persistently.
Independent patients are more likely to contaminate their immediate environment.
Contamination of common areas within and near COVID‐19 units occurred infrequently.
Why does this paper matter?
While detection of SARS‐CoV‐2 viral RNA does not indicate infectiousness, this detection can be used to determine where in the nursing home setting virus is most likely to be present. Infection control policies should thoughtfully incorporate environmental cleaning, education, and diligent use of personal protective equipment by frontline staff.
INTRODUCTION
The coronavirus disease 2019 (COVID‐19) pandemic has disproportionately affected patients in nursing homes (NHs) and long‐term care facilities, 1 , 2 accounting for 5% of all cases and 32% of all COVID‐19 deaths nationwide. 3 , 4 NHs have responded by rapidly creating COVID‐19 units, thus caring for their patients within the NHs and reducing hospital transfers. Advancing our understanding of environmental contamination with the causative virus of COVID‐19, SARS‐CoV‐2, within these units deserves further investigation.
Researchers have found that within acute care hospitals, SARS‐CoV‐2 is transmitted more readily to surfaces in COVID‐19 patient rooms than to surfaces in common areas 5 , 6 , 7 , 8 ; however, the role of environmental contamination on transmission, the stability of the virus in the environment, factors that affect virus survival or persistence on inanimate surfaces, and patient characteristics affecting environmental contamination remain understudied. 5 , 9 , 10 , 11 Evidence from NHs are lacking. Compared with hospitals, NHs are designed as more congregate living spaces, which house patients more vulnerable to infection. Moreover, the very disabilities that confine patients to the NH and require physical assistance from others also preclude his or her ability to fully isolate for the entire duration of COVID‐19 illness.
In this prospective cohort study, we characterize the epidemiology of SARS‐CoV‐2 across the patient care blueprint of COVID‐19 units within four NHs, from inside COVID‐19 patients' rooms to common use areas. Our main objectives were to: (1) characterize the extent of contamination of patient room surfaces and NH common areas with SARS‐CoV‐2 viral RNA; (2) ascertain whether this contamination was persistent over time; and (3) evaluate the impact of functional status, disease severity, and comorbidity on environmental contamination.
METHODS
Study population and design
This study was conducted between October 2020 and January 2021 in COVID‐19 units within four NHs in Southeast Michigan. Any patient diagnosed with recent (≤14 days) COVID‐19 infection was enrolled in this prospective cohort study to evaluate environmental contamination. Trained research clinicians collected swab specimens from specific room surfaces of patients infected with COVID‐19 within the past 14 days. Swab specimens were collected for a total of three times over the course of 1 week, with visits occurring 1–4 days apart. Likewise, once per week, swab specimens were collected from specific common area surfaces at all participating facilities. The study was approved by the University of Michigan Institutional Review Board and Human Research Activation Committee (to ensure safety during the COVID‐19 pandemic), including a waiver of informed consent to collect environmental samples and deidentified clinical data.
Infection control policies at study sites
All four NHs had comprehensive infection prevention programs, including a COVID‐19 response team consisting of several leadership and frontline staff. Characteristics of participating NH COVID‐19 units, as well as policies for personal protective equipment (PPE) use, audit frequencies, and environmental cleaning procedures, are included in Table S1.
Swab specimen collection and transport
To assess COVID‐19 patient room contamination with SARS‐CoV‐2 viral RNA, swab specimens were collected from the following high‐touch, representative environmental surfaces at each study visit: bed controls, call button, bedside tabletop, TV remote, privacy curtain, windowsill, toilet seat, doorknob, and air vent (if within reach). The common area specimens collected weekly included the following, in or nearest to the facility's designated COVID‐19 unit: sitting area tabletop, sitting area chair or arm rest, dining room tabletop, nurses' station tabletop, nurses' station computer keyboard, and elevator buttons. For all flat surfaces, an area of approximately 5 × 20 cm was swabbed. For smaller objects, the entire surface was swabbed. Flocked swabs (Copan 502CS01 or Puritan 25‐3306U) were used and placed into 3 ml viral transport media (Labscoop VR2020) following collection. 12 , 13 All environmental specimens were placed on ice and transported within 2 h of collection to a BSL‐2 University of Michigan research laboratory. Samples were aliquoted into two 1.5 ml vials and stored at −80°C until testing.
Clinical data collection
Research personnel reviewed COVID‐19 patient medical records to collect demographic and clinical data. Baseline demographic data were obtained from patient's admission documentation, Minimum Data Set (MDS) assessments, or NH provider notes, and included: age; sex; race; ethnicity; short‐ or long‐stay patient designation (≤90 days, short stay; >90 days, long stay); admitting and discharge locations; advanced directives; MDS Brief Interview for Mental Status (BIMS) score, 14 a performance‐based cognitive screener for NH patients; Charlson comorbidity score 15 ; and independence in activities of daily living (ADL) score (i.e., bathing, dressing, toileting, transferring, continence, and feeding). 16 , 17 ADL independence was further defined categorically as: dependent in all six activities, independent in one or two activities, and independent in three or more activities. Clinical data were collected for any of the following events from 30 days prior to the study start through the end of the study period: hospitalization, antibiotic and antiviral use, device use, and presence of an open wound. COVID‐19 data collected included: COVID‐19 test collection and results in the past 30 days, vital signs on the date of the first positive COVID‐19 test, vital signs at study discharge, and signs and symptoms present at the onset of COVID‐19 infection. Signs and symptoms included the following (as per CDC guidelines 18 ) documented in the 2 weeks following the first positive COVID‐19 test: fever or chills, cough, shortness of breath or difficulty breathing, fatigue, muscle or body aches, headache, new loss of taste or smell, sore throat, congestion or runny nose, nausea or vomiting, diarrhea, hypoxia (blood O2 < 95%), hypotension (blood pressure < 90/60), tachypnea (abnormally rapid breathing or respiration > 24), tachycardia (pulse > 120), poor appetite/poor oral intake, change in mental status, and worsening functional status. All COVID‐19 data were abstracted directly from the NH provider notes and/or the hospital provider notes (if the patient was at the hospital in the 2 weeks following COVID‐19 diagnosis). If a symptom was not documented, it was recorded as “absent.” At least two trained research clinicians reviewed every patient chart to ensure completeness.
Laboratory methods
RNA was extracted using the KingFisher automated extraction and purification system, where 200 μl of a thawed specimen aliquot was extracted and then eluted into 50 μl of an elution buffer, following instructions within the Emergency Use Authorization (EUA) protocol for TaqPath COVID‐19 SARS‐CoV‐2 Combo Kit (ThermoFisher). For samples collected between November 4, 2020 and November 18, 2020, RNA was extracted using a QIAamp Viral RNA Mini Kit (Qiagen 52906) as an alternative method, where 140 μl of the original specimen was extracted and eluted into 100 μl of water.
Extracted specimens were tested for the presence of SARS‐CoV‐2 RNA using the Centers for Disease Control and Prevention (CDC) 2019‐nCoV real‐time reverse transcription‐polymerase chain reaction (RT‐PCR) EUA Protocol. 13 Samples with amplification for both targets (N1 and N2) with Ct value <40 were considered positive, and samples with no signal for either target were considered negative. When fluorescence was detected for only one of the two targets, RNA was re‐extracted from the originally thawed aliquot and tested using the TaqPath COVID‐19 Combo Kit for confirmation. 19 For the TaqPath COVID‐19 Combo Kit assay, specimens were considered positive if two of the three targets—S gene, N gene, and ORF1ab gene—amplified with Ct ≤ 37. Specimens with partial amplification for both the CDC‐based and TaqPath‐based assays were classified as positive in analyses, as further described in Figure S1.
Sample size
Our sample included four NHs with an average bed size of 125 beds (range: 40–215) (Table S1). Power calculations were based on the predicted probabilities of SARS‐CoV‐2 viral RNA detection. Based on limited existing research from NH settings and using functional disability as our primary risk factor, we predicted 50% of all patient rooms would have one or more environmental site contaminated before cleaning. We based our sample size on the conservative assumption that the odds of colonization among those with functional disability would be 1.65 times higher than among patients without disability. Thus, a sample size of 100 was needed to detect this prespecified difference between groups with 80% power and alpha = 0.05.
Statistical analysis
As short‐stay populations differ significantly from long‐stay populations in their length of stay, cognition, and function, we were interested in understanding and curating risk factors for each. We compared baseline characteristics between short‐stay and long‐stay patients using Fisher's exact test to assess significance in categorical descriptors and Wilcoxon rank‐sum test to evaluate significance between continuous descriptors. The main outcome of interest was the presence of SARS‐CoV‐2 viral RNA on environmental objects in the rooms of COVID‐19‐positive NH patients. To accomplish aim 1, we present SARS‐CoV‐2 positivity at a swab, visit, and patient level, and further consider proximate contamination (defined as SARS‐CoV‐2 detected at any site within 1 meter (~3 feet) of the patient's bed) versus distant contamination (SARS‐CoV‐2 detected greater than 1 meter (~3 feet) from the patient's bed) at enrollment, within the patient room only (common area swabs excluded). At least three proximate cultures (median 4 cultures, IQR: 3–4) and at least two distant cultures (median 4 cultures, IQR: 4–5) were collected during each visit.
To accomplish aim 2, we examined the site‐specific prevalence of SARS‐CoV‐2 isolated from environmental surfaces in the rooms of infected patients on enrollment and during follow‐up. In this analysis, persistence was defined as contamination at one or more room sites at enrollment and at least one follow‐up visit (visit 2 or 3). To test for persistence of contamination at each specific type of environmental site, we used the Phi coefficient, a measure of association between two binary variables, to assess for correlation between contamination (vs. non‐contamination) at baseline versus follow‐up. 20
To accomplish aim 3, we used logistic regression models with random effect, a type of generalized mixed effect model, to consider all visits in evaluating the association between functional independence (predictor) and SARS‐CoV‐2 transmission to the patient environment (primary outcomes of proximate, distant, and any contamination), adjusting for comorbidities, demographics, and disease severity. Data were analyzed using Stata 15 (StataCorp LLC, College Station, TX).
RESULTS
Patient characteristics
A total of 104 patients at the four NHs were screened within 14 days of their first positive COVID‐19 test and enrolled in the study between October 2020 and January 2021 (100% of COVID‐19 patients screened were enrolled). Baseline demographics of the patients are shown in Table 1. More than half (62%) of the study population was 80 years of age or older, 67% were female, and 89% were non‐Hispanic White. Patients had a median Charlson comorbidity score of 2. More than three quarters (82%) were dependent in four or more ADLs. In the 30 days preceding the study period, 24% had been hospitalized, 15% had an indwelling device, 13% had an open wound, and 5% had antiviral use. The discharge location for patients following study completion (as of February 2021) included: 35% still residing at the NH, 31% discharged to the community, 20% to acute care hospital, 14% deceased, and 1% transferred to another NH.
TABLE 1.
Clinical and demographic characteristics of the study population including short‐ and long‐stay patients
| Characteristic | Total population (N = 104) | Short‐stay patients (N = 53) | Long‐stay patients (N = 51) | p‐value |
|---|---|---|---|---|
| Age | ||||
| 45–69 | 12 (11.5) | 9 (17.0) | 3 (5.9) | 0.116 a |
| 70–79 | 28 (26.9) | 17 (32.1) | 11 (21.6) | |
| 80–89 | 36 (34.6) | 16 (30.2) | 20 (39.2) | |
| >89 | 28 (26.9) | 11 (20.8) | 17 (33.3) | |
| Sex | ||||
| Male | 34 (32.7) | 21 (39.6) | 13 (25.5) | 0.147 a |
| Female | 70 (67.3) | 32 (60.4) | 38 (74.5) | |
| Race | ||||
| Non‐Hispanic White | 93 (89.4) | 50 (94.3) | 43 (84.3) | 0.119 a |
| Non‐White or unknown | 11 (10.6) | 3 (5.7) | 8 (15.7) | |
| BIMS score, mean (SD) b | 10.6 (4.8) | 10.2 (4.8) | 11.2 (4.8) | 0.280 c |
| Activities of daily living d | ||||
| Dependent in all 6 ADLs | 29 (27.9) | 8 (15.1) | 21 (41.2) | 0.012 a |
| Independent in 1–2 ADLs | 56 (53.4) | 34 (64.2) | 22 (43.1) | |
| Independent in ≥3 ADLs | 19 (18.3) | 11 (20.8) | 8 (15.7) | |
| Charlson Comorbidity Index score, median (IQR) | 2 (1–3.5) | 2 (1–4) | 2 (1–3) | 0.756 c |
| Comorbidities | ||||
| Dementia | 58 (55.8) | 21 (39.6) | 37 (72.6) | 0.001 a |
| Diabetes | 42 (40.4) | 24 (45.3) | 18 (35.3) | 0.324 a |
| CHF | 34 (32.7) | 19 (35.9) | 15 (29.4) | 0.535 a |
| COPD | 18 (17.3) | 10 (18.9) | 8 (15.7) | 0.797 a |
| In 30 days prior to the study period | ||||
|
Hospitalization N = 103; 1 patient missing data |
25 (24.3) | 23/52 (44.2) | 2/51 (3.9) | <0.001 a |
| Antibiotic use | 31 (29.8) | 25 (47.2) | 6 (11.8) | <0.001 a |
| Antiviral use | 5 (4.8) | 5 (9.4) | 0 (−) | 0.057 a |
|
Indwelling device N = 93; 11 patients missing data |
14 (15.1) | 11/42 (26.2) | 3/51 (5.9) | 0.008 a |
|
Open wound N = 94; 10 patients missing data |
12 (12.8) | 7/44 (15.9) | 5/50 (10.0) | 0.538 a |
| Days from the first positive test to enrollment, mean (SD) | 6.3 (4.3) | 4.2 (3.9) | 8.5 (3.7) | <0.001 c |
| Discharge status | ||||
| Still resides at facility | 36 (34.6) | 3 (5.7) | 33 (64.7) | <0.001 a |
| Community | 32 (30.8) | 32 (60.4) | 0 (−) | |
| Acute care hospital | 21 (20.2) | 12 (22.6) | 9 (17.7) | |
| Deceased | 14 (13.5) | 5 (9.4) | 9 (17.7) | |
| Another NH | 1 (1.0) | 1 (1.9) | 0 (−) | |
| Room contamination on enrollment | ||||
| SARS‐CoV‐2 detected <1 m (~3 ft) from the patient's bed | 58 (55.8) | 34 (64.2) | 24 (47.1) | 0.114 a |
| SARS‐CoV‐2 detected >1 m (~3 ft) from the patient's bed | 65 (62.5) | 32 (60.4) | 33 (64.7) | 0.689 a |
Abbreviations: BIMS, Brief Interview for Mental Status; CHF, congestive heart failure; COPD, chronic obstructive pulmonary disease; NH, nursing home.
Significance evaluated using the Fisher's exact test.
BIMS score evaluates cognitive impairment on a scale of 0–15: 0–7 indicates severe cognitive impairment, 8–12 indicates moderate impairment, and 13–15 indicates intact cognitive response. The BIMS score was not collected for 27 (26.2%) study participants (five short‐stay and 22 long‐stay) due to nonverbal or severe impairment.
Significance evaluated using Wilcoxon rank‐sum test.
Activities considered to assess independence: toileting, feeding, dressing, transferring, continence, and bathing.
Of the 104 patients, 51 were long‐stay patients (in the NH for more than 90 days) and 53 were short‐stay patients (90 days or less). Dementia was more prevalent among long‐stay compared with short‐stay patients (72.6% vs. 39.6%, p = 0.001). In the 30 days prior to study enrollment, short‐stay patients were more likely to have been hospitalized (44.2% compared with 3.9% among long‐stay patients, p < 0.001), to have received antibiotics (47.2% compared with 11.8%, p < 0.001), and to have had an indwelling device (26.2% compared with 5.9%, p = 0.008).
SARS‐CoV‐2 contamination in patient rooms and common areas
A total of 2087 swab specimens were collected: 1896 from the rooms of 104 COVID‐19 patients (with 241 visits), and 191 from NH common areas in and around the COVID‐19 unit. In total, positivity rates included 28.4% of 1896 swabs, 79.7% of 241 visits (with at least one positive environmental site), and 89.4% of 104 patients (with at least one positive environmental site). Figure 1 shows the patient‐, visit‐, and swab‐level distribution across all four units.
FIGURE 1.
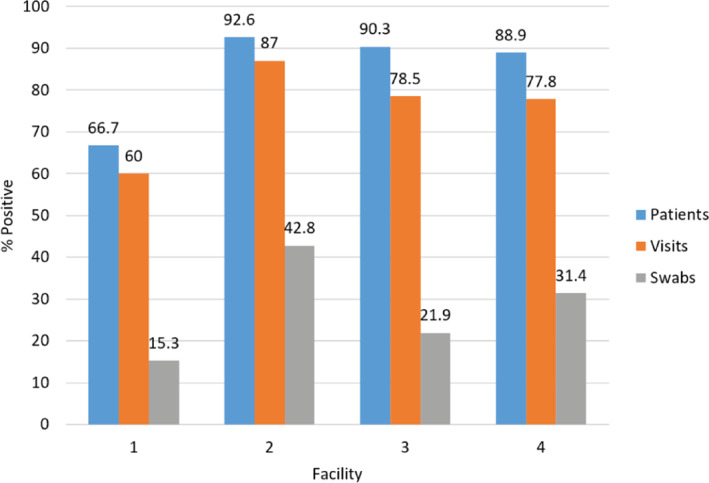
SARS‐CoV‐2 on swab specimens collected—patient level, visit level, and swab level. Among all patients enrolled (n = 104), the percent of patients with at least one environmental surface positive for SARS‐CoV‐2 on at least one visit ranged from 66.7% to 92.6% across the four participating nursing home (NH) facilities. Among all visits conducted (n = 241), the percent of visits with at least one environmental surface positive for SARS‐CoV‐2 ranged from 60.0% to 87.0% across the four NHs. Among all swab specimens collected from COVID‐19 patient room surfaces (n = 1896), positivity ranged from 15.3% to 42.8% across the four NHs
On enrollment (an average of 6.33 days after first positive test, SD: 4.3, range: 0–16), at least one proximate site (located within 1 m (~3 ft) of the patient's bed) was contaminated in 55.8% of patient rooms and at least one distant site (>1 m (~3 ft)) was contaminated in 62.5% of patient rooms. Of 55 rooms with a TV remote, 24 (43.6%) were contaminated on enrollment. Of all 104 rooms, 40 (38.5%) call buttons, 25 (24.0%) bedside tables, and 24 (23.1%) bed controls were contaminated (Figure 2). Among distant sites, 38.8% (40/103) of windowsills, 27.1% (23/85) of air vents, 16.7% (17/102) of toilet seats, 8.7% (9/104) of doorknobs, and 5.5% (3/55) of privacy curtains were contaminated. Common areas were infrequently contaminated; sitting area chairs were the most frequently contaminated with SARS‐CoV‐2 detected on four of 33 (12.1%) visits. Dining room tables (6.3%, 2/32) and sitting area tables (3.0%, 1/33) were also contaminated; elevator buttons and nurse station tables and keyboards were not contaminated at any point.
FIGURE 2.
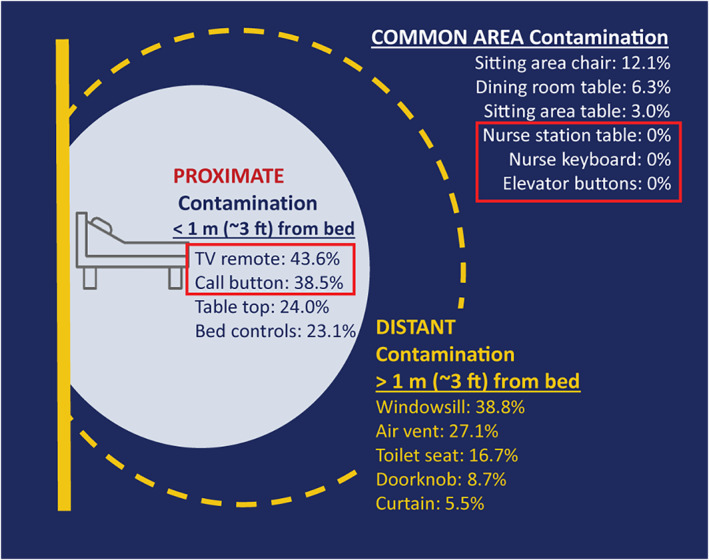
Contamination of environmental surfaces at study enrollment. On enrollment, environmental sites proximate to the patient bed (within 1 m (~3 feet)) were contaminated at rates ranging from 23.1% (bed controls) to 43.6% (TV remotes). Contamination rates of distant sites (greater than 1 m (~3 ft) from the patient's bed) on enrollment ranged from 5.5% (curtains) to 38.8% (windows). SARS‐CoV‐2 was detected on three of six common area sites sampled, at rates ranging from 3.0% (sitting area table) to 12.1% (sitting area chair)
Persistence of SARS‐CoV‐2 contamination
Eighty‐eight (84.6%) patients had at least one follow‐up visit allowing for evaluation of persistence. TV remotes were most likely to be contaminated, with 68.1% (32/47 patients with follow‐up and a remote in the room) contaminated at any point during the study. TV remote contamination was most persistent, often detected on both enrollment and during follow‐up (34%; 16/47). Windowsills were persistently contaminated in a third (29/88) of rooms and contaminated at any point in 59.1% (52/88); call buttons were persistently contaminated in 28.4% (25/88) of rooms and contaminated at any point in 58.0% (51/88) (Figure 3).
FIGURE 3.
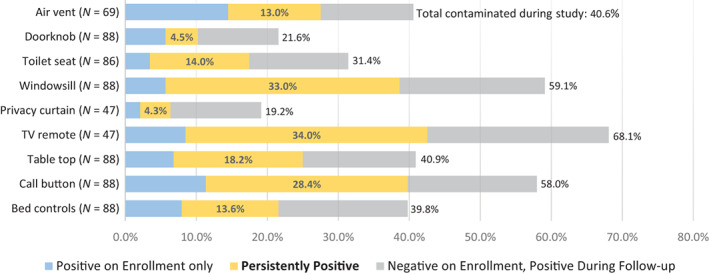
Environmental contamination during baseline and follow‐up visits. Among 88 patient rooms with at least one follow‐up visit, persistence of contamination at each environmental sampling site is assessed. In 47 rooms with TV remotes, SARS‐CoV‐2 was detected at any point (on enrollment and/or during follow‐up) in 68.1%; the virus was detected on enrollment and during follow‐up (persistently) in 34.0%. Windowsills and call buttons were sampled in all 88 rooms, with the virus detected at any point in 59.1% and 58.0%, respectively. SARS‐CoV‐2 was detected persistently in 33.0% of windowsills and 28.4% of call buttons. All other sites were contaminated in less than 50% of rooms and persistently so in less than 25%
Pairwise correlation between environmental sites on enrollment and during follow‐up is shown in Figure S2. All sites show very strong (Phi coefficient > 0.25) internal correlation between contamination on enrollment and during follow‐up. Additionally, pairwise correlations of contamination among all proximate sites (bed controls, call buttons, bedside tabletops, and TV remotes) from enrollment to follow‐up range from strong (0.1673 Phi coefficient of correlation between enrollment call button contamination and follow‐up TV remote contamination; N = 52 rooms) to very strong (Phi = 0.4996 correlation between tabletop contamination on enrollment and follow‐up TV remote contamination; N = 52 rooms).
Risk factors for SARS‐CoV‐2 room contamination
After adjusting for time from first positive test to enrollment, patient characteristics, and disease severity, increased functional independence was found to be significantly associated with greater odds of proximate contamination (Table 2). Compared with the reference group of fully dependent patients (dependent in all six assessed ADLs), those who were independent in one to two ADLs (odds ratio [OR], 5.74; 95% confidence interval [CI], 1.49–22.21) and those who were independent in at least three ADLs (OR, 8.63; 95% CI, 1.45–51.43) are significantly more likely to have proximate room contamination. Higher Charlson comorbidity score was significantly associated with proximate contamination (OR, 1.59; 95% CI, 1.10–2.30) as well as with overall room contamination (OR, 1.48; 95% CI, 1.02–2.16). Longer time (>3 days) from the first positive COVID‐19 test to study enrollment was associated with 75% less contamination in the proximate area (OR, 0.25; 95% CI, 0.07–0.86). Functional independence and other covariates were not found to be significantly associated with distant contamination nor overall contamination.
TABLE 2.
Risk factors for SARS‐CoV‐2 contamination in patient room
| Risk factor | Adjusted odds ratios (95% confidence interval) | ||
|---|---|---|---|
| Contamination outcome | |||
| Proximate (<1 m (~3 ft) from bed), 141 events | Distant (>1 m (~3 ft) from bed), 150 events | Any (any site in patient room), 192 events | |
| Study timeline | |||
| Enrolled >3 days from diagnosis | 0.25 (0.07–0.86)** | 0.94 (0.34–2.63) | 0.66 (0.20–2.16) |
| Patient characteristics | |||
| Age ≥ 80 | 0.63 (0.20–1.95) | 0.98 (0.37–2.59) | 0.58 (0.18–1.84) |
| Sex (male) | 0.96 (0.29–3.16) | 0.51 (0.18–1.44) | 0.31 (0.09–1.04)* |
| Charlson comorbidity score | 1.59 (1.10–2.30)** | 1.25 (0.92–1.69) | 1.48 (1.02–2.16)** |
| Functional independence | |||
| Dependent in all 6 ADLs | Reference group | Reference group | Reference group |
| Independent in 1–2 ADLs | 5.74 (1.49–22.21)** | 1.50 (0.49–4.55) | 1.58 (0.46–5.41) |
| Independent in ≥3 ADLs | 8.63 (1.45–51.43)** | 1.45 (0.35–6.06) | 2.40 (0.44–13.00) |
| Disease severity | |||
| Required supplemental oxygen | 0.94 (0.31–2.79) | 0.73 (0.28–1.88) | 0.47 (0.15–1.40) |
Note: Mixed‐effect multivariable logistic regression; 104 patients, 241 observations (average 2.3 per patient).
Abbreviation: ADLs, activities of daily living.
p < 0.10;
p < 0.05.
DISCUSSION
Our study shows that SARS‐CoV‐2 frequently contaminates high‐touch surfaces within patient rooms in NH COVID‐19 units. In contrast, it is reassuring that the frequency of contamination in non‐patient care areas of these units is very low. These results demonstrate the extent and patterns of environmental contamination within these units and will inform effective cleaning practices to provide safe care of COVID‐19 patients within these units.
Studies of environmental contamination from intensive care units (ICUs), emergency departments, and hospital isolation wards show the prevalence of SARS‐CoV‐2 in the environment is variable and ranges from 0% to 70% of samples. 21 , 22 , 23 , 24 , 25 , 26 , 27 , 28 , 29 , 30 , 31 , 32 , 33 , 34 , 35 , 36 , 37 , 38 , 39 , 40 , 41 , 42 Ong et al. 22 tested 10 surfaces in 20 patient rooms within a single ICU and found 14 (70%) had at least one positive site, with an overall contamination rate of 14% (28/200 samples). The most contaminated objects were the bedrail and floor (30%), followed by the air outlet vent (25%) and infusion pumps (20%). Within the NH setting, a small study from Canada examined air samples and no‐touch surfaces of 31 COVID‐19‐positive patients' rooms from seven long‐term care facilities. 43 No SARS‐CoV‐2 was detected in any air samples, but 20 of 62 swabs (32%) from 16 of 31 rooms were positive for SARS‐CoV‐2 RNA by RT‐qPCR. 43
Our study shows that environmental contamination with SARS‐CoV‐2 within COVID‐19 units in NHs is ubiquitous and persistent. The persistence of COVID‐19 has not been studied in NHs and other settings. Santarpia et al. 6 obtained several surface samples from the rooms of 13 COVID‐19‐infected patients from two hospitals and nine National Quarantine Unit isolation rooms, finding 81.0% of toilet seat samples, 77.8% of cell phones, 72.7% of window ledges, 70.8% of bedside tables and bedrails, and 55.6% of TV remote controls to be positive for SARS‐CoV‐2 RNA. Wan et al. 23 also conducted environmental culturing of similar sites in COVID‐19‐infected patient rooms, finding the electrocardiograph fingertip piece to be the most contaminated object (72.7% positive rate), and deeming the bedrail to be the “sentinel” site—the most correlated with additional sites being also positive (10 times). In the study by Yang et al., 24 the toilet seat was the most contaminated site (30%), and no differences between samples of symptomatic versus asymptomatic patients were found. These studies all underscore that COVID‐19 patients frequently contaminate their environment with SARS‐CoV‐2 and within NHs this contamination is persistent, suggesting continuous shedding.
Prior studies in the acute care setting showed that contamination of general ward areas outside patient rooms is consistently low (not exceeding 3%). 8 , 25 , 26 This may have implications on guidance for visitors and visitation policies in NHs. Prior studies have not shown any specific predictors of environmental contamination. 27 , 28 We found that functional disability was not associated with increased odds of environmental contamination; on the contrary, after adjusting for clinical risk factors, increased patient independence was significantly associated with greater odds of environmental transmission within 1 m (~3 ft) of the patient's bed.
While the CDC notes that the risk of transmission via environmental contamination of SARS‐CoV‐2 is generally low, 44 there are several factors which may increase this risk that are especially relevant in an NH setting. NHs may have very high prevalence rates during outbreaks (28.4% of environmental cultures observed in our study); mask wearing and hand hygiene may be inconsistent among NH patients with active infection; and the acuity of infections among NH patients may lead to increased viral shedding over what may be seen in the broader community. 45 For this reason, effective infection prevention and cleaning in NHs remain a priority during the times of SARS‐CoV‐2 circulation, particularly since wearing masks for prolonged periods of time may not be feasible for this population. 46
Our study has several limitations. While we show that the NH patient room environment is frequently contaminated with SARS‐CoV‐2, we do not have evidence of whether the virus detected is viable or able to be transmitted to others. Ben‐Shmuel et al. 29 showed, in laboratory‐controlled conditions, SARS‐CoV‐2 lost its infectivity completely by day 4 at ambient temperature, although the virus likely persists much longer in the environment (Zhou et al. 47 found it in the environment 28 days after patient discharge). While transmissibility of virus from contaminated objects is still unknown, we conclude that thorough disinfection in COVID‐19 units is vital. Another limitation of our study is that COVID‐19 signs and symptoms were collected based on chart documentation in the 2 weeks following a positive COVID‐19 test. Clinical documentation at each site varied. However, our rates of signs and symptoms were quite high for many patients (Table S2), suggesting comprehensive charting at all four sites. Our study has several strengths. We were able to conduct in‐depth environmental study in these settings in the midst of an outbreak and when research staff were not allowed access by rapidly training and engaging our frontline clinicians. It is also one of the first studies to investigate patient‐level risk factors impacting environmental contamination of SARS‐CoV‐2 in these settings.
Our data indicate significant environmental contamination in rooms where NH patients infected with COVID‐19 are housed and cared for. NH infection control policies and procedures should consider the environment as a potential medium of transmission, with a need for strict adherence to environmental cleaning, developing technology‐based environmental cleaning solutions, and diligent use of PPE by frontline staff.
CONFLICT OF INTEREST
All authors report no conflicts of interest relevant to this article.
AUTHOR CONTRIBUTIONS
All authors were involved in the study concept and design, analysis and interpretation of the data, and preparation of manuscript. Kristen E. Gibson, Liza Bautista, Ana Montoya, and Karen Neeb were involved in the acquisition of subjects and/or data.
SPONSOR'S ROLE
The authors' funding sources did not participate in the planning, collection, analysis, or interpretation of data or in the decision to submit for publication. The investigators had full access to the data and were responsible for the study protocol, progress of the study, analysis, reporting of the study, and the decision to publish.
Supporting information
Table S1. Facility characteristics and infection prevention and control policies.
Table S2. Study population COVID‐19 signs and symptoms, as per the medical chart documentation.
Figure S1. PCR results algorithm for CDC and multiplex assays. Samples with amplification for both targets (N1 and N2) with Ct value <40 were considered positive, and samples with no signal for either target were considered negative. Specimens were considered positive if two of the three targets—S gene, N gene, and ORF lab gene—amplified with Ct ≤ 37.
Figure S2. Pairwise correlation of environmental contamination on enrollment and during follow‐up. Phi coefficient (measure of pairwise correlation) is indicated in each pairwise square. Number of observations for each pair is indicated in the bottom right corner of each pairwise square. Strength of pairwise correlations is indicated by colors, as per the figure legend.
ACKNOWLEDGMENTS
We thank all NH patients and healthcare workers who participated in this research study.
Mody L, Gibson KE, Mantey J, et al. Environmental contamination with SARS‐CoV‐2 in nursing homes. J Am Geriatr Soc. 2022;70(1):29‐39. doi: 10.1111/jgs.17531
Funding informationThis study was supported by the National Institutes of Health (RO1 AG041780, K24 AG050685, and Supplement Award to P30 AG024824 [Claude D. Pepper Older Americans Independence Center]).
REFERENCES
- 1. McMichael TM, Clark S, Pogosjans S, et al. COVID‐19 in a long‐term care facility – King County, Washington, February 27‐March 9, 2020. MMWR Morb Mortal Wkly Rep. 2020;69:339‐342. [DOI] [PMC free article] [PubMed] [Google Scholar]
- 2. CDC COVID‐19 Response Team . Severe outcomes among patients with coronavirus disease 2019 (COVID‐19) – United States, February 12‐March 16, 2020. MMWR Morb Mortal Wkly Rep. 2020;69:343‐346. [DOI] [PMC free article] [PubMed] [Google Scholar]
- 3. Kaiser Family Foundation . Metrics in Long‐term Care Facilities. Accessed April 20, 2021. https://www.kff.org/coronavirus-covid-19/issue-brief/state-covid-19-data-and-policy-actions/#longtermcare
- 4. Hochman D. Four Months that Left 54,000 Dead from COVID in Long‐Term Care. Accessed May 14, 2021. https://www.aarp.org/caregiving/health/info-2020/covid-19-nursing-homes-an-american-tragedy.html
- 5. Ong SWX, Tan YK, Chia PY, et al. Air, surface environmental, and personal protective equipment contamination by severe acute respiratory syndrome coronavirus 2 (SARS‐CoV‐2) from a symptomatic patient. JAMA. 2020;323:1610‐1612. [DOI] [PMC free article] [PubMed] [Google Scholar]
- 6. Santarpia JL, Rivera DN, Herrera VL, et al. Aerosol and surface contamination of SARS‐CoV‐2 observed in quarantine and isolation care. Sci Rep. 2020;10:12732. [DOI] [PMC free article] [PubMed] [Google Scholar]
- 7. Chia PY, Coleman KK, Tan YK, et al. Detection of air and surface contamination by SARS‐CoV‐2 in hospital rooms of infected patients. Nat Commun. 2020;11:2800. [DOI] [PMC free article] [PubMed] [Google Scholar]
- 8. Jerry J, O'Regan E, O'Sullivan O, Lynch M, Brady D. Do established infection prevention and control measures prevent spread of SARS‐CoV‐2 to the hospital environment beyond the patient room? J Hosp Infect. 2020;105:589‐592. [DOI] [PMC free article] [PubMed] [Google Scholar]
- 9. Kanamori H, Weber DJ, Rutala WA. Role of the healthcare surface environment in severe acute respiratory syndrome coronavirus 2 (SARS‐CoV‐2) transmission and potential control measures. Clin Infect Dis. 2020;72:2052‐2061. [DOI] [PMC free article] [PubMed] [Google Scholar]
- 10. Bedrosian N, Mitchell E, Rohm E, et al. A systematic review of surface contamination, stability, and disinfection data on SARS‐CoV‐2 (through July 10, 2020). Environ Sci Technol. 2021;55:4162‐4173. [DOI] [PubMed] [Google Scholar]
- 11. Marques M, Domingo JL. Contamination of inert surfaces by SARS‐CoV‐2: persistence, stability and infectivity. A review. Environ Res. 2020;193:110559. [DOI] [PMC free article] [PubMed] [Google Scholar]
- 12. Centers for Disease Control and Prevention . Interim Guidelines for Collecting and Handling of Clinical Specimens for COVID‐19 Testing. Accessed June 9, 2021. https://www.cdc.gov/coronavirus/2019-nCoV/lab/guidelines-clinical-specimens.html#respiratory
- 13. Centers for Disease Control and Prevention . CDC 2019‐Novel Coronavirus (2019‐nCoV) Real‐Time RT‐PCR Diagnostic Panel. Accessed May 14, 2021. https://www.fda.gov/media/134922/download
- 14. Thomas KS, Dosa D, Wysocki A, Mor V. The Minimum Data Set 3.0 cognitive function scale. Med Care. 2017;55:e68‐e72. [DOI] [PMC free article] [PubMed] [Google Scholar]
- 15. Charlson ME, Pompei P, Ales KL, MacKenzie CR. A new method of classifying prognostic comorbidity in longitudinal studies: development and validation. J Chronic Dis. 1987;40:373‐383. [DOI] [PubMed] [Google Scholar]
- 16. Katz S, Down TD, Cash HR, Grotz RC. Progress in the development of the index of ADL. Gerontologist. 1970;10:20‐30. [DOI] [PubMed] [Google Scholar]
- 17. Katz S. Assessing self‐maintenance: activities of daily living, mobility ad instrumental activities of daily living. J Am Geriatr Soc. 1983;31:721‐727. [DOI] [PubMed] [Google Scholar]
- 18. Centers for Disease Control and Prevention . Symptoms of COVID‐19. Accessed May 14, 2021. https://www.cdc.gov/coronavirus/2019-ncov/symptoms-testing/symptoms.html
- 19. Applied Biosystems . TaqPath COVID‐19 Combo Kit and TaqPath COVID‐19 Combit Kit Advanced. Accessed May 14, 2021. https://www.fda.gov/media/136112/download
- 20. Akoglu H. User's guide to correlation coefficients. Turk J Emerg Med. 2018;18:91‐93. [DOI] [PMC free article] [PubMed] [Google Scholar]
- 21. Lomont A, Boubaya M, Khamis W, et al. Environmental contamination related to SARS‐CoV‐2 in ICU patients. ERJ Open Res. 2020;6:00595‐2020. [DOI] [PMC free article] [PubMed] [Google Scholar]
- 22. Ong SWX, Lee PH, Tan YK, et al. Environmental contamination in a coronavirus disease 2019 (COVID‐19) intensive care unit – what is the risk? Infect Control Hosp Epidemiol. 2021;42:669‐677. [DOI] [PMC free article] [PubMed] [Google Scholar]
- 23. Wan B, Zhang X, Luo D, et al. On‐site analysis of COVID‐19 on the surfaces in wards. Sci Total Environ. 2021;753:141758. [DOI] [PMC free article] [PubMed] [Google Scholar]
- 24. Yang M, Li L, Huang T, et al. SARS‐CoV‐2 detected on environmental fomites for both asymptomatic and symptomatic COVID‐19 patients. Am J Respir Crit Care Med. 2021;203:374‐378. [DOI] [PMC free article] [PubMed] [Google Scholar]
- 25. Redmond SN, Dousa KM, Jones LD, et al. Severe acute respiratory syndrome coronavirus 2 (SARS‐CoV‐2) nucleic acid contamination of surfaces on a coronavirus disease 2019 (COVID‐19) ward and intensive care unit. Infect Control Hosp Epidemiol. 2021;42:215‐217. [DOI] [PMC free article] [PubMed] [Google Scholar]
- 26. Ryu BH, Cho Y, Cho OH, Hong SI, Kim SK, Lee S. Environmental contamination of SARS‐CoV‐2 during the COVID‐19 outbreak in South Korea. Am J Infect Control. 2020;48:875‐879. [DOI] [PMC free article] [PubMed] [Google Scholar]
- 27. Zhou J, Otter JA, Price JR, et al. Investigating SARS‐CoV‐2 surface and air contamination in an acute healthcare setting during the peak of the COVID‐19 pandemic in London. Clin Infect Dis. 2021;73:e1870‐e1877. [DOI] [PMC free article] [PubMed] [Google Scholar]
- 28. Tan L, Ma B, Lai X, et al. Air and surface contamination by SARS‐CoV‐2 virus in a tertiary hospital in Wuhan, China. Int J Infect Dis. 2020;99:3‐7. [DOI] [PMC free article] [PubMed] [Google Scholar]
- 29. Ben‐Shmuel A, Brosh‐Nissimov T, Glinert I, et al. Detection and infectivity potential of severe acute respiratory syndrome coronavirus 2 (SARS‐CoV‐2) environmental contamination in isolation units and quarantine facilities. Clin Microbiol Infect. 2020;26:1658‐1662. [DOI] [PMC free article] [PubMed] [Google Scholar]
- 30. Escudero D, Boga JA, Fernandez J, et al. SARS‐CoV‐2 analysis on environmental surfaces collected in an intensive care unit: keeping Ernest Shackleton's spirit. Intensive Care Med Exp. 2020;8:68. [DOI] [PMC free article] [PubMed] [Google Scholar]
- 31. Shin KS, Park HS, Lee J, Lee JK. Environmental surface testing for severe acute respiratory syndrome coronavirus 2 (SARS‐CoV‐2) during prolonged isolation of an asymptomatic carrier. Infect Control Hosp Epidemiol. 2020;41:1328‐1330. [DOI] [PMC free article] [PubMed] [Google Scholar]
- 32. Li YH, Fan YZ, Jiang L, Wang HB. Aerosol and environmental surface monitoring for SARS‐CoV‐2 RNA in a designated hospital for severe COVID‐19 patients. Epidemiol Infect. 2020;148:e154. [DOI] [PMC free article] [PubMed] [Google Scholar]
- 33. Wei L, Huang W, Lu X, et al. Contamination of SARS‐CoV‐2 in patient surroundings and on personal protective equipment in a non‐ICU isolation ward for COVID‐19 patients with prolonged PCR positive status. Antimicrob Resist Infect Control. 2020;9:167. [DOI] [PMC free article] [PubMed] [Google Scholar]
- 34. Lei H, Ye F, Liu X, et al. SARS‐CoV‐2 environmental contamination associated with persistently infected COVID‐19 patients. Influenza Other Respir Viruses. 2020;14:688‐699. [DOI] [PMC free article] [PubMed] [Google Scholar]
- 35. Cheng VCC, Wong SC, Chan VWM, et al. Air and environmental sampling for SAR‐CoV‐2 around hospitalized patients with coronavirus disease 2019 (COVID‐19). Infect Control Hosp Epidemiol. 2020;41:1258‐1265. [DOI] [PMC free article] [PubMed] [Google Scholar]
- 36. Peyrony O, Ellouze S, Fontaine JP. Surfaces and equipment contamination by severe acute respiratory syndrome coronavirus 2 (SARS‐CoV‐2) in the emergency department at a university hospital. Int J Hyg Environ Health. 2020;230:113600. [DOI] [PMC free article] [PubMed] [Google Scholar]
- 37. Moore G, Rickard H, Stevenson D, et al. Detection of SARS‐CoV‐2 within the healthcare environment: a multicenter study conducted during the first wave of the COVID‐19 outbreak in England. J Hosp Infect. 2021;108:189‐196. [DOI] [PMC free article] [PubMed] [Google Scholar]
- 38. D'Accolti M, Soffritti I, Passaro A. SARS‐CoV‐2 RNA contamination on surfaces of a COVID‐19 ward in a hospital of Northern Italy: what risk of transmission? Eur Rev Med Pharmacol Sci. 2020;24:9202‐9207. [DOI] [PubMed] [Google Scholar]
- 39. Ye G, Lin H, Chen S, et al. Environmental contamination of SARS‐CoV‐2 in healthcare premises. J Infect. 2020;81:e1‐e5. [DOI] [PMC free article] [PubMed] [Google Scholar]
- 40. Razzini K, Castrica M, Menchetti L. SARS‐CoV‐2 RNA detection in the air and on surfaces in the COVID‐19 ward of a hospital in Milan, Italy. Sci Total Environ. 2020;742:140540. [DOI] [PMC free article] [PubMed] [Google Scholar]
- 41. Wu S, Wang Y, Jin X, Tian J, Liu J, Mao Y. Environmental contamination by SARS‐CoV‐2 in a designated hospital for coronavirus disease 2019. Am J Infect Control. 2020;48:910‐914. [DOI] [PMC free article] [PubMed] [Google Scholar]
- 42. Wei L, Lin J, Duan X. Asymptomatic COVID‐19 patients can contaminate their surroundings: an environmental sampling study. mSphere. 2020;5:e00442‐20. [DOI] [PMC free article] [PubMed] [Google Scholar]
- 43. Dumont‐Leblond N, Veillette M, Bherer L, et al. Positive no‐touch surfaces and undetectable SARS‐CoV‐2 aerosols in long‐term care facilities: an attempt to understand the contributing factors and the importance of timing in air sampling campaigns. Am J Infect Control. 2021;49:701‐706. [DOI] [PMC free article] [PubMed] [Google Scholar]
- 44. Centers for Disease Control and Prevention . Science Brief: SARS‐CoV‐2 and Surface (Fomite) Transmission for Indoor Community Environments. Accessed May 14, 2021. https://www.cdc.gov/coronavirus/2019-ncov/more/science-and-research/surface-transmission.html [PubMed]
- 45. Pitol AK, Julian TR. Community transmission of SARS‐CoV‐2 by surfaces: risks and risk reduction strategies. Environ Sci Technol Lett. 2021;8:263‐269. [DOI] [PubMed] [Google Scholar]
- 46. Wang Y, Tian H, Zhang L, et al. Reduction of secondary transmission of SARS‐CoV‐2 in households by face mask use, disinfection and social distancing: a cohort study in Beijing, China. BMJ Glob Health. 2020;5:e002794. [DOI] [PMC free article] [PubMed] [Google Scholar]
- 47. Zhou Y, Zeng Y, Chen C. Presence of SARS‐CoV‐2 RNA in isolation ward environment 28 days after exposure. Int J Infect Dis. 2020;97:258‐259. [DOI] [PMC free article] [PubMed] [Google Scholar]
Associated Data
This section collects any data citations, data availability statements, or supplementary materials included in this article.
Supplementary Materials
Table S1. Facility characteristics and infection prevention and control policies.
Table S2. Study population COVID‐19 signs and symptoms, as per the medical chart documentation.
Figure S1. PCR results algorithm for CDC and multiplex assays. Samples with amplification for both targets (N1 and N2) with Ct value <40 were considered positive, and samples with no signal for either target were considered negative. Specimens were considered positive if two of the three targets—S gene, N gene, and ORF lab gene—amplified with Ct ≤ 37.
Figure S2. Pairwise correlation of environmental contamination on enrollment and during follow‐up. Phi coefficient (measure of pairwise correlation) is indicated in each pairwise square. Number of observations for each pair is indicated in the bottom right corner of each pairwise square. Strength of pairwise correlations is indicated by colors, as per the figure legend.