

Abstract
Objectives
Safety precautions limit the clinical assessment of hospitalized Coronavirus disease 2019 (COVID‐19) patients. The minimal exposure required to perform lung ultrasound (LUS) paired with its high accuracy, reproducibility, and availability make it an attractive solution for initial assessment of COVID‐19 patients. We aim to evaluate whether the association between sonographic findings and clinical outcomes among COVID 19 patients is comparable between the validated 12‐zone protocol and a shorter, 8‐zone protocol, in which the posterior lung regions are omitted.
Methods
One hundred and one COVID‐19 patients hospitalized in a dedicated COVID‐19 ward in a tertiary referral hospital were examined upon admission and scored by 2 LUS protocols. The association between the scores and a composite outcome consisting of death, transfer to the intensive care unit (ICU) or initiation of invasive or noninvasive mechanical ventilation was estimated and compared.
Results
LUS scores in both the 8‐ and the 12‐zone protocols were associated with the composite outcome during hospitalization (hazard ratio [HR] 1.21 [1.03–1.42, P = .022] and HR 1.13 [1.01–1.27, P = .037], respectively). The observed difference in the discriminatory ROC‐AUC values for the 8‐ and 12‐zone scores was not significant (0.767 and 0.754 [P = .647], respectively).
Conclusion
A short 8‐zone LUS protocol is as accurate as the previously validated, 12‐zone protocol for prognostication of clinical deterioration in nonventilated COVID‐19 patients.
Keywords: COVID‐19, lung ultrasound, lung ultrasound protocols, pneumonia
Abbreviations
- ALT
alanine transaminase
- AST
aspartate transaminase
- AUC
areas under the curve
- BLUE
bedside lung ultrasound in emergency
- CIs
confidence intervals
- COVID‐19
coronavirus disease 2019
- CRP
C‐reactive protein
- CT
computer tomography
- CXR
chest X rays
- HR
hazard ratio
- ICU
intensive care unit
- IQR
inter‐quantile range
- LDH
lactate dehydrogenase
- LUS
lung ultrasound
- POCUS
point‐of‐care ultrasound
- ROC
receiver operating curves
- SARS
severe acute respiratory syndrome
As of May 2021, more than 160 million people were diagnosed with Coronavirus disease 2019 (COVID‐19) and more than 3 million have died. When treating COVID‐19 patients, healthcare professionals are at risk for contagion, 1 , 2 , 3 leading to treatment protocols focused on medical staff safety, including minimization of exposure to suspected or confirmed cases. Measures include a short, focused physical exam, the use of portable machines for chest X rays (CXRs) resulting in less accurate radiographic results, and minimization of computer tomography (CT) scans and other procedures that expose the hospital population to these patients. 4 In the last decade, lung ultrasound (LUS) has become an essential tool in diagnosis and follow‐up of hospitalized patients with various respiratory disorders, ranging from critical care patients with respiratory failure and expanding into various other medical disorders, including pneumonia, pneumothorax, and pulmonary congestion. 5 , 6 , 7 The minimal staff and equipment exposure required to perform LUS paired with its high accuracy, reproducibility, and availability as a bedside tool make it an attractive tool for initial assessment, risk‐stratification and monitoring of COVID‐19 patients. 8 , 9 , 10 , 11
Various LUS protocols requiring between eight and 18 zone of assessment have been used for the assessment of COVID‐19 patients. 12 , 13 , 14 , 15 , 16 , 17 , 18 , 19 The commonly used bedside lung ultrasound in emergency (BLUE) protocol, consisting of 12‐zone assessment comprising the anterior, lateral, and posterior lung regions, has shown strong association between LUS findings and patient outcomes in myriad clinical conditions. 20 , 21 However, whether more time and effort consuming protocols provide more robust assessments of patient outcome is unknown.
In this study, we aimed to evaluate whether the association between sonographic findings and clinical outcomes among COVID 19 patients is comparable between the validated BLUE protocol and a shorter, 8‐zone protocol, in which the posterior lung regions are omitted.
Materials and Methods
Ethics Committee Approval
Ethical approval for this study was obtained from Tel Aviv Sourasky Medical Center Helsinki Committee (approval number 0712‐20‐TLV), no need for written informed consent was required.
Study Cohort
The study cohort included consecutive COVID‐19 patients hospitalized in a dedicated COVID‐19 ward in a tertiary university affiliated referral hospital between July, 2020 and October, 2020. All patients had a positive molecular test for COVID‐19 infection upon admission. Patients who required mechanical ventilatory support prior to admission were excluded. COVID‐19 disease severity of the included patients according to the National Institute of Health classification (mild, moderate, serve, critical) (https://www.covid19treatmentguidelines.nih.gov/overview/clinical‐spectrum/).
The composite outcome was defined as either death, transfer to the intensive care unit (ICU) or initiation of invasive or noninvasive mechanical ventilation during the index hospitalization.
Sonographic Data Collection
LUS was performed on all admitted patients. A dedicated General Electric Venue Go ultrasonic device was used. The frequency was 1 to 5 MHz for the convex array probe and 5 to 20 MHz for the linear probe. Film and 70% alcohol were used to protect and disinfect the probe and scanner after each examination. All evaluations were performed by an experienced physician certified in general point‐of‐care ultrasound (POCUS training program, Soroka Medical Center, Israel), with more than 5 years experience in both practicing and teaching POCUS at the Tel Aviv Sourasky Medical Center. Protective equipment was used for all scans.
Sonographic assessments were performed with the patient being in the semirecumbent position. We performed a 12‐zone LUS examination, assessing each hemithorax systematically at the anterior, lateral, and posterior lung zone (Figure 1). We used the R1‐6 and L1‐6 labeling method. The right (R) zones were divided to: R1—right upper anterior; R2—right lower anterior; R3—right upper lateral; R4—right lower lateral; R5—right upper posterior; R6—right lower posterior. The left (L) zones were divided similarly. When assessing the R5/6 and L5/6 zone, the patient was sitting in an erect position, and the physician assessed these lung zone from behind, avoiding leaning across the patient, in order to minimize exposure to the patient and by that reduce the risk of transmission.
Figure 1.
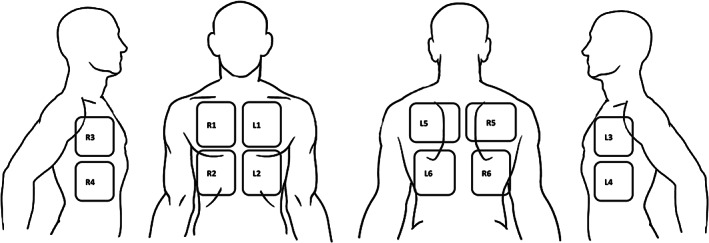
Twelve lung zone scanning protocol surface anatomy. The chest is divided by the parasternal margin to 2 hemithorax. Each hemithorax is divided into 6 lung zones. The anterior zones (R1, R2, L1, L2) are located between the parasternal margin and the anterior axillary line. The lateral zones (R3, R4, L3, L4) are located between the anterior and posterior axillary line. The upper and lower zones of these regions are separated by the nipple line. The posterior zones (R5, R6, L5, L6) are located medially to the scapula and divided to upper and lower zone at the height of the tip of the scapula.
The eight‐zone LUS protocol was defined as assessment of the anterior and lateral zone, omitting the posterior zones. On each examination, assessment included the presence of A‐lines, pleural line morphology including pleural irregularities, thickening, or sub pleural consolidations. Presence of B‐lines and their maximum number\coalescence was documented. B‐lines were defined as coalescent when they merge or numerous. The presence of lung consolidations or pleural effusion was noted as well. Each zone was scored on a scale of 0 to 3 according to the worst finding visualized, according to the following method: Normal (A‐lines or less than 3 B‐lines per rib space) = 0; well separated B‐lines (≥3 per rib space), = 1; coalescent B‐lines = 2 and consolidation = 3. 16 Summing the results of each lung zone yielded the total LUS ranging from 0 to 36 for the 12‐zone BLUE protocol and 0 to 24 for the shorter investigational 8‐zone protocol. Due to patient‐related limitations, including physical disability, patient's cooperation and mental status, the posterior regions were not examined in some of the patients and the 12‐zone US score was calculated for 75 (74.2%) patients. The 8‐zone US score was calculated for all patients.
Clinical and Laboratory Data Collection
Clinical information collected consisted of age and gender, and the presence of comorbidities including: Smoking status, hypertension, obesity, diabetes, ischemic heart disease, congestive heart failure, chronic kidney disease, chronic obstructive pulmonary disease, dyslipidemia, and dementia. Collected signs and symptoms upon admission including: Fever, dyspnea, cough, sore throat, myalgia, diarrhea, anosmia, and an abnormal CXR. Laboratory values upon admission included: Complete blood count, creatinine, sodium, potassium, alanine transaminase (ALT), aspartate transaminase (AST), bilirubin, lactate dehydrogenase (LDH), C‐reactive protein (CRP), troponin, ferritin, and blood gases including lactate.
Statistical Analysis
Patient characteristics were compared using the chi‐square test or Fisher's exact test for categorical variables and the Mann–Whitney U test for continuous variables. Scores were compared between patients with and without the composite outcome using the Mann–Whitney U test. The Bonferroni test was used for multiple hypothesis testing. Spearman correlation was used to assess the relationship between the US scores in the anterior and lateral lung zone to those in the posterior region. Hazard ratios (HRs) and corresponding 95% confidence intervals (CIs) for the association between both 8‐zone and 12‐zone US scores and the risk for the composite outcome were estimated using a Cox‐proportional‐hazards model. The model included the following potential confounders: Age, gender, the number of medical comorbidities (including congestive heart failure, hypertension, chronic kidney disease, diabetes mellitus chronic obstructive pulmonary disease, dementia, ischemic heart disease, and/or dyslipidemia) and disease severity at admission. Data were censored either at discharge or at the end of the study period (November 1st, 2020). When a patient was either discharged or had one of the events comprising the composite outcome on the same day the US exam was performed, the time variable was rounded up to 1 day. Cox models were compared by implementing the likelihood‐ratio test for comparing non‐nested Cox regression models as proposed by Fine. 22 Kaplan Meier survival curves were compared using the log‐rank test. Receiver operating curves (ROC) were used to evaluate the discriminatory value of each score, and the areas under the curve (AUC) were compared using the method proposed by DeLong et al. 23 Only patients with both 8‐zone and 12‐zone scores recorded were included in the Cox regression and ROC analyses. Score thresholds were chosen by maximizing specificity while maintaining sensitivity values above 85%. An 8‐zone score ≥9 and a 12‐zone score ≥13 were considered to be high. All statistical analyses were performed using R Statistical Software (version 3.6.3; R Foundation for Statistical Computing, Vienna, Austria).
Results
Patient Characteristics
The initial study cohort included 111 patients, and 101 remained after excluding patients already on mechanical ventilation upon admission. Sixty‐seven (66.3%) were males. The mean age was 65.2 ± 16.8 years. Thirty‐six (35.6%) patients had mild disease severity on admission, 14 (13.9%) moderate, 49 (48.5%) severe and 2 (2.0%) critical disease.
LUS Assessment
Most patients (n = 99, 98%) had abnormal LUS findings and 4 (3.9%) had pleural effusions. A total of 77 (76.2%), 91 (90.1%) and 67 (66.3%) patients had anterior, lateral, and posterior lung involvement respectively (Table 1). Of the 101 patients assessed by the 8‐zone LUS protocol, 44 (44%) had a high (≥9) score and 57 (56%) had a low score. Clinical presentation upon admission and background comorbidities were comparable between both groups (Table 2). Most patients with a high score (39/44, 93%) had an abnormal CXR, compared to 54% (29/57) of those with low scores (P < .001). Lab values also differed between patient groups, with significantly higher levels of C‐reactive protein (P = .008), ferritin (P = .044), LDH (P < .001) and troponin (P = .044) and lower lymphocyte count (0.01) in the high score group.
Table 1.
Abnormal Lung Ultrasound (LUS) Findings Among 101 Patients
| Abnormal LUS | 99/101 (98.0) |
| B‐lines | 99/101 (98.0) |
| Consolidation | 19/101 (18.8) |
| Anterior involvement | 77/101 (76.2) |
| Lateral involvement | 91/101 (90.1) |
| Posterior involvement | 67/101 (66.3) |
Table 2.
Clinical Presentation and Background Comorbidities
| Level | 8‐Zone Score <9 | 8‐Zone Score ≥9 | |
|---|---|---|---|
| n | 57 | 44 | |
| Age (median [IQR]) | 67.16 [53.41, 74.70] | 69.35 [54.65, 83.72] | |
| Sex (%) | M | 18 (31.6) | 16 (36.4) |
| F | 39 (68.4) | 28 (63.6) | |
| Smoking (%) | 0 | 53 (93.0) | 40 (90.9) |
| 1 | 4 (7.0) | 4 (9.1) | |
| Fever upon admission (%) | 0 | 29 (50.9) | 19 (43.2) |
| 1 | 28 (49.1) | 25 (56.8) | |
| Dyspnea (%) | 0 | 34 (59.6) | 21 (47.7) |
| 1 | 23 (40.4) | 23 (52.3) | |
| Cough (%) | 0 | 27 (47.4) | 19 (43.2) |
| 1 | 30 (52.6) | 25 (56.8) | |
| Sore throat (%) | 0 | 52 (91.2) | 38 (86.4) |
| 1 | 5 (8.8) | 6 (13.6) | |
| Myalgia (%) | 0 | 52 (91.2) | 36 (83.7) |
| 1 | 5 (8.8) | 7 (16.3) | |
| Diarrhea (%) | 0 | 45 (78.9) | 39 (88.6) |
| 1 | 12 (21.1) | 5 (11.4) | |
| Anosmia (%) | 0 | 46 (80.7) | 36 (81.8) |
| 1 | 11 (19.3) | 8 (18.2) | |
| Hemoglobin (median [IQR]) | 13.20 [12.30, 14.50] | 13.30 [12.40, 14.10] | |
| Wbc (median [IQR]) | 5.80 [4.00, 7.85] | 6.50 [4.75, 9.02] | |
| Lymphocyte count (median [IQR]) | 1.00 [0.70, 1.40] | 0.80 [0.50, 1.00] | |
| Platelet (median [IQR]) | 206.00 [156.00, 259.50] | 212.50 [141.25, 262.00] | |
| Creatinine (median [IQR]) | 0.91 [0.73, 1.23] | 0.81 [0.66, 1.05] | |
| Sodium (median [IQR]) | 136.00 [135.00, 138.75] | 137.00 [134.00, 139.00] | |
| Potassium (median [IQR]) | 4.10 [3.74, 4.49] | 4.18 [3.86, 4.52] | |
| ALT (median [IQR]) | 20.50 [17.00, 27.75] | 28.50 [18.25, 48.25] | |
| AST (median [IQR]) | 29.00 [21.00, 34.00] | 39.00 [29.00, 50.00] | |
| Bilirubin (median [IQR]) | 0.45 [0.33, 0.60] | 0.48 [0.38, 0.59] | |
| LDH (median [IQR]) | 461.50 [388.50, 553.00] | 739.00 [517.50, 831.00] | |
| CRP (median [IQR]) | 53.00 [13.00, 141.00] | 126.50 [42.00, 176.75] | |
| Troponin (median [IQR]) | 7.00 [3.00, 13.00] | 10.00 [4.00, 58.00] | |
| Ferritin (median [IQR]) | 396.50 [167.50, 1115.00] | 659.00 [368.00, 1502.00] | |
| Ph (median [IQR]) | 7.38 [7.36, 7.42] | 7.40 [7.37, 7.44] | |
| PCO2 (median [IQR]) | 40.50 [36.55, 45.50] | 41.00 [37.00, 46.00] | |
| HCO3 (median [IQR]) | 24.00 [21.00, 26.00] | 25.00 [23.00, 27.50] | |
| Lactate (median [IQR]) | 1.55 [1.38, 1.81] | 1.66 [1.39, 2.00] | |
| CXR anomalies (%) | 0 | 25 (46.3) | 3 (7.1) |
| 1 | 29 (53.7) | 39 (92.9) | |
| HTN (%) | 0 | 23 (40.4) | 20 (45.5) |
| 1 | 34 (59.6) | 24 (54.5) | |
| Obesity (%) | 0 | 47 (82.5) | 36 (81.8) |
| 1 | 10 (17.5) | 8 (18.2) | |
| Diabetes (%) | 0 | 31 (54.4) | 27 (61.4) |
| 1 | 26 (45.6) | 17 (38.6) | |
| IHD (%) | 0 | 42 (73.7) | 35 (79.5) |
| 1 | 15 (26.3) | 9 (20.5) | |
| CHF (%) | 0 | 51 (89.5) | 38 (86.4) |
| 1 | 6 (10.5) | 6 (13.6) | |
| CKD (%) | 0 | 48 (84.2) | 37 (84.1) |
| 1 | 9 (15.8) | 7 (15.9) | |
| COPD (%) | 0 | 53 (93.0) | 41 (93.2) |
| 1 | 4 (7.0) | 3 (6.8) | |
| Dyslipidemia (%) | 0 | 26 (45.6) | 23 (52.3) |
| 1 | 31 (54.4) | 21 (47.7) | |
| Dementia (%) | 0 | 44 (77.2) | 36 (81.8) |
| 1 | 13 (22.8) | 8 (18.2) | |
| Comorbidities score (median [IQR]) | 3.00 [0.00, 4.00] | 2.00 [0.00, 3.25] | |
| Vapotherm cat (%) | 0 | 55 (96.5) | 37 (84.1) |
| 1 | 2 (3.5) | 7 (15.9) | |
| Composite (%) | No | 55 (96.5) | 32 (72.7) |
| Yes | 2 (3.5) | 12 (27.3) | |
| Death (%) | No | 55 (96.5) | 33 (75.0) |
| Yes | 2 (3.5) | 11 (25.0) | |
| ICU transfer (%) | No | 57 (100.0) | 41 (93.2) |
| Yes | 0 (0.0) | 3 (6.8) | |
| Mechanical ventilation (%) | No | 57 (100.0) | 40 (90.9) |
| Yes | 0 (0.0) | 4 (9.1) |
Prognostic Value of LUS
The composite outcome event occurred in 14 (13.9%) patients, with 3 (3.0%) transferred to the ICU, 9 (8.9%) requiring noninvasive mechanical ventilation, 4 (4.0%) requiring mechanical ventilation and 13 (12.9%) deaths. Among patients with a high 8‐zone score, the composite outcome occurred in 12/44 (27.2%) patients versus 2/57 (3.51%) patients in the low 8‐zone score (P = .002). Among the patients with a high (≥13) 12‐zone US score, the composite outcome occurred in 10/38 (26.32%) versus 1/37 (2.7%) in the low 12‐zone score (P = .01). High 8‐zone LUS at presentation was associated with overall worse maximal disease severity throughout hospitalization (P < .001). The association between the composite outcome and LUS scores was strongest for findings in the lateral regions, (P = .003), followed by the anterior and posterior regions (P = .056 and P = .202, respectively (Figure 2). Comparing the rate of composite outcome between patients with the full 12‐zone US exam and those that were evaluated with only the 8‐zone score, the composite outcome occurred in 11/75 (15%) and 3/26 (12%) patients, respectively (P > .9).
Figure 2.
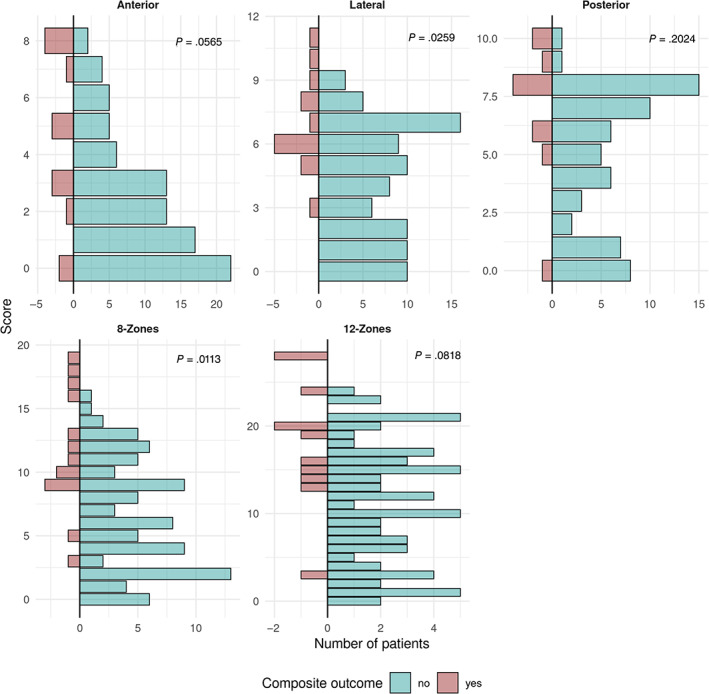
Score distribution in patients with and without the composite outcome. Scores are summed up to compose the region (ie, anterior, lateral, and posterior) and the regions are summed to calculate the 8‐zone (anterior and lateral regions) and 12‐zone (anterior, lateral, and posterior regions) scores.
Multivariable Prognostic Modeling
The association between each score and the composite outcome was estimated using a multivariate Cox‐proportional hazards model. A model was constructed for each score with the addition of the following confounders: Age, gender, obesity, disease severity upon admission, and the number of comorbidities (Table 3). Both the 8‐zone and the 12‐zone scores upon admission were associated with a higher risk for the composite outcome during hospitalization (HR 1.21 [1.03–1.42, P = .022] and HR 1.13 [1.01–1.27, P = .037], respectively).
Table 3.
Multivariate Cox‐Proportional Hazards Model
| Levels | 8‐Zone Protocol | 12‐Zone Protocol | |
|---|---|---|---|
| Age | 1.03 (0.97–1.09, P = .286) | 1.03 (0.97–1.09, P = .305) | |
| Gender | M | — | — |
| F | 4.66 (0.80–27.03, P = .087) | 3.78 (0.71–20.20, P = .120) | |
| Number of comorbidities | 1.34 (0.82–2.18, P = .243) | 1.31 (0.80–2.14, P = .286) | |
| Obesity | 0 | — | — |
| 1 | 11.13 (2.12–58.27, P = .004) | 10.69 (2.08–54.89, P = .005) | |
| Disease severity upon admission | Mild | — | — |
| Moderate_to_critical | 3.15 (0.30–32.84, P = .338) | 3.47 (0.35–33.98, P = .285) | |
| 8‐Zone score | 1.21 (1.03–1.42, P = .022) | — | |
| 12‐Zone score | — | 1.13 (1.01–1.27, P = .037) |
In order to estimate whether performing a short 8‐zone US protocol improves the prognostic value compared to the full 12‐zone protocol, several tests were performed. First the aforementioned Cox regression models were compared and no model demonstrated a significantly better fit compared to the other (P = .38).
Second, the correlation between the sum of regions comprising the 8‐zone protocol (eg, the score in the anterior and lateral regions) and the scores in the posterior region (which are added to complete the 12‐zone protocol) was calculated (Figure 3). The anterior region was less correlated with the posterior region than the lateral region (R = 0.62, P < .001 and R = 0.71, P < .001, respectively). The sum of both regions (ie, the 8‐zone protocol) demonstrated better correlation with the posterior score (R = 0.77, P < .001).
Figure 3.
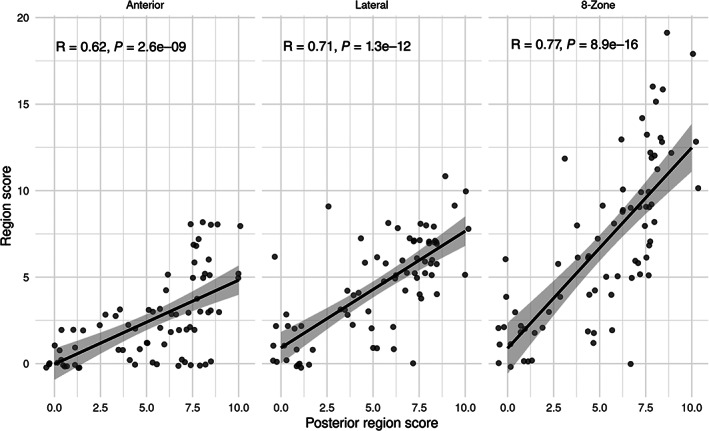
Correlation between the different regions comprising the 8‐zone score (anterior and lateral) (y‐axis) and the posterior region score (x‐axis). The score in the lateral region demonstrated a slightly stronger correlation with the posterior region compared to the anterior region. Summing the scores in both the anterior and lateral regions (the 8‐zone score) resulted in the strongest correlation with the posterior region score.
Finally, the discriminatory value of each protocol was evaluated by calculating the ROC‐AUC, which were 0.767 and 0.754 for the 8‐ and 12‐zone scores, respectively (Figure 4). Comparing these values, there was no significant difference between protocols (P = .647).
Figure 4.
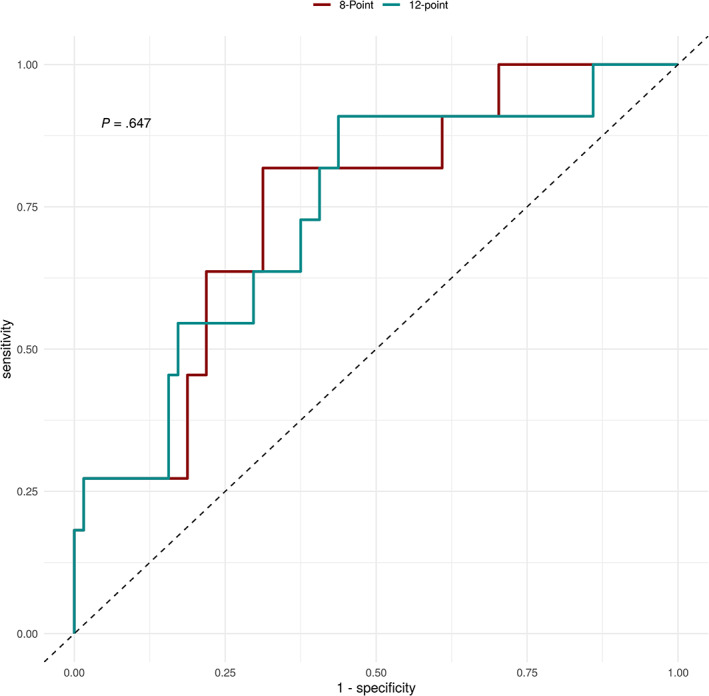
Receiver operating curves describing the performance of the 8‐ and 12‐zone scores in predicting the composite outcome during hospitalization. Areas under the curves were 0.767 and 0.754, respectively. Comparing these values, there was no significant difference between scores.
Discussion
POCUS is a well‐established and pivotal tool in assessing severe COVID‐19 patients. Previously validated, 12‐zone LUS exams have been shown to improve COVID‐19 patient assessment. However, these protocols are challenging when assessing immobile or uncooperative patients. Our study demonstrates that when assessing hospitalized COVID‐19 patients, a short 8‐zone LUS protocol, comprising only the anterior and lateral regions, is comparable in sensitivity and specificity to the longer 12‐zone protocol, which includes the posterior regions (Figure 4).
The sonographic findings in COVID‐19 pneumonia are well established, including increased number of B‐lines (discrete or confluent, multifocal and usually bilateral), thickening of pleura with pleural line irregularities, subpleural small consolidations, and parenchymal consolidations. 13 , 24 , 25 While the LUS findings are well described, currently mainly 12‐zone LUS protocols have been shown to predict patient outcomes. 14 , 24 , 26 , 27 , 28 , 29 , 30
The unique needs of COVID‐19 patients mandate safe, accurate, and focused assessment, while minimizing physician exposure time. Our study demonstrates that omitting the posterior lung regions from the protocol might shorten evaluation duration without compromising its prognostic value (Table 3).
While the 8‐zone protocol was performed on the entire cohort, only 74% of patients were examined with the full 12‐zone protocol. Proper assessment of posterior lung zones requires patient cooperation, which may be reduced among dyspneic\ventilated patients or patients with delirium. Patients with COVID‐19, especially elderly patients, often suffer from severe weakness, hospitalization‐related deconditioning, 31 , 32 and severe dyspnea. This might make the minimal effort of leaning forward challenging even for short time spans, hindering the physician's ability to perform the full 12‐zone sonographic assessment for sick, frail patients. Achieving proper assessment of the posterior lung zones for these patients might require the assistance of additional medical staff members for proper positioning and patient support. These maneuvers prolong the scanning time and increase patient inconvenience and medical staff exposure. Additional staff members might not be available in medical centers overwhelmed by large numbers of critically ill COVID‐19 patients, further limiting the real‐world usability of the 12‐zone LUS protocol. Scanning time was on average 50% shorter for the 12‐zone protocol compared to the 8‐zone protocol.
Sonographic abnormalities in the lateral lung regions have the highest sensitivity for the composite study outcome, with high negative predictive value. The involvement of the lateral and anterior regions and its relation to the composite outcome was demonstrated in previous studies, which used 12‐ and 8‐zone scans. 14 , 33 This finding might be explained by the tendency of SARS‐COV2 to infect mainly the lateral lung segments. 34 , 35 , 36 , 37 Thus, the utility of the 8‐zone scan is supported by these findings that mainly the anterior and lateral lung zones are associated with patient outcomes. Furthermore, our results demonstrate that findings in the 8‐zone protocol are highly correlated with those in the posterior region, and therefore minimal information is lost when omitting this region. Future studies might focus on selected zones as targets for even shorter LUS assessments of COVID‐19 patients, potentially providing a rapid, effective, and safe triage method for early identification of patients at risk for clinical deterioration who should be placed under closer surveillance.
Our study has several limitations. First, it is a retrospective study, prone to weaknesses stemming from this design. Results and suggested score cutoffs should be validated in a larger, prospective cohort. Second, sonographic findings are practitioner dependent and might be interpreted differently when done by different practitioners. While the examinations in the study were performed by a single certified and experienced practitioner, reducing inter‐practitioner variability and improving score differentiation between protocols, this may reduce generalizability of our findings. Third, longer, more elaborate LUS protocols that might provide additional prognostic value were not included in the study. 17 , 18 Fourth, due to patient‐related limitations and the fact that only a single operator was present during the exam, 25% of the patients were not examined with the full 12‐zone protocol. It is possible that in this patient group, the full protocol would have demonstrated better discriminatory performance than the shorter protocol. To address this limitation, we show that the rate of composite outcome was not significantly different in this patient group compared to patients that were examined by both protocols.
Conclusion
Our study demonstrates that an 8‐zone LUS protocol is as accurate as the previously validated, 12‐zone protocol for prognostication of clinical deterioration in nonventilated COVID‐19 patients. Advantages include obviating the need for assistance from staff members other than the operator, shorter scan time, less requirement for patient cooperation, and increased physician safety. Our results support the use of a shorter 8‐zone LUS protocol as a reliable surrogate for the full 12‐zone protocol for the assessment of the severity of lung disease in COVID‐19 patients.
This work was partially supported by the Kahn foundation. There was no additional financial compensation.
The authors declare that they have no competing interests.
References
- 1. Chang D, Xu H, Rebaza A, Sharma L, Cruz CS. Protecting health‐care workers from subclinical coronavirus infection. Lancet Respir Med 2020; 8:e13. 10.1016/S2213-2600(20)30066-7. [DOI] [PMC free article] [PubMed] [Google Scholar]
- 2. Ong SWX, Tan YK, Chia PY, et al. Air, surface environmental, and personal protective equipment contamination by severe acute respiratory syndrome coronavirus 2 (SARS‐CoV‐2) from a symptomatic patient. JAMA 2020; 323:1610. 10.1001/jama.2020.3227. [DOI] [PMC free article] [PubMed] [Google Scholar]
- 3. Cheung JC‐H, Ho LT, Cheng JV, Cham EY, Lam KN. Staff safety during emergency airway management for COVID‐19 in Hong Kong. Lancet Respir Med 2020; 8:e19. 10.1016/S2213-2600(20)30084-9. [DOI] [PMC free article] [PubMed] [Google Scholar]
- 4. Osterwalder J. COVID‐19 ‐ more lung pocus and sparing use of stethoscope, chest X‐ray and lung CT. Praxis 2020; 109:583–591. 10.1024/1661-8157/a003512. [DOI] [PubMed] [Google Scholar]
- 5. Moore CL, Copel JA. Point‐of‐care ultrasonography. N Engl J Med 2011; 364:749–757. 10.1056/NEJMra0909487. [DOI] [PubMed] [Google Scholar]
- 6. Lichtenstein DA. Lung ultrasound in the critically ill. Ann Intensive Care 2014; 4:1. 10.1186/2110-5820-4-1. [DOI] [PMC free article] [PubMed] [Google Scholar]
- 7. Bouhemad B, Mongodi S, Via G, Rouquette I. Ultrasound for “lung monitoring” of ventilated patients. Anesthesiology 2015; 122:437–447. 10.1097/ALN.0000000000000558. [DOI] [PubMed] [Google Scholar]
- 8. Huanh Y, Wang S, Liu Y, Zhang Y, Zheng Ch ZY. A preliminary study on the ultrasonic manifestations of peripulmonary lesions of non‐critical novel coronavirus pneumonia (COVID‐19). BMC Med 2020. 10.21203/rs.2.24369/v1. [DOI] [Google Scholar]
- 9. Lomoro P, Verde F, Zerboni F, et al. COVID‐19 pneumonia manifestations at the admission on chest ultrasound, radiographs, and CT: single‐center study and comprehensive radiologic literature review. Eur J Radiol Open 2020; 7:100231. 10.1016/j.ejro.2020.100231. [DOI] [PMC free article] [PubMed] [Google Scholar]
- 10. Buda N, Segura‐Grau E, Cylwik J, Wełnicki M. Lung ultrasound in the diagnosis of COVID‐19 infection ‐ a case series and review of the literature. Adv Med Sci 2020; 65:378–385. 10.1016/j.advms.2020.06.005. [DOI] [PMC free article] [PubMed] [Google Scholar]
- 11. Peng Q‐Y, Wang X‐T, Zhang L‐N, Chinese Critical Care Ultrasound Study Group (CCUSG) . Findings of lung ultrasonography of novel corona virus pneumonia during the 2019‐2020 epidemic. Intensive Care Med 2020; 46:849–850. 10.1007/s00134-020-05996-6. [DOI] [PMC free article] [PubMed] [Google Scholar]
- 12. Duggan NM, Shokoohi H, Liteplo AS, Huang C, Goldsmith AJ. Best practice recommendations for point‐of‐care lung ultrasound in patients with suspected COVID‐19. J Emerg Med 2020; 59:515–520. 10.1016/j.jemermed.2020.06.033. [DOI] [PMC free article] [PubMed] [Google Scholar]
- 13. Fox S, Dugar S. Point‐of‐care ultrasound and COVID‐19. Cleve Clin J Med. 2020. 10.3949/ccjm.87a.ccc019. [DOI] [PubMed] [Google Scholar]
- 14. Lichter Y, Topilsky Y, Taieb P, et al. Lung ultrasound predicts clinical course and outcomes in COVID‐19 patients. Intensive Care Med 2020; 46:1–11. 10.1007/s00134-020-06212-1. [DOI] [PMC free article] [PubMed] [Google Scholar]
- 15. Moore S, Gardiner E. Point of care and intensive care lung ultrasound: a reference guide for practitioners during COVID‐19. Radiography 2020; 26:e297–e302. 10.1016/j.radi.2020.04.005. [DOI] [PMC free article] [PubMed] [Google Scholar]
- 16. Smith MJ, Hayward SA, Innes SM, Miller ASC. Point‐of‐care lung ultrasound in patients with COVID‐19 – a narrative review. Anaesthesia 2020; 75:1096–1104. 10.1111/anae.15082. [DOI] [PMC free article] [PubMed] [Google Scholar]
- 17. Soldati G, Smargiassi A, Inchingolo R, et al. Proposal for international standardization of the use of lung ultrasound for patients with COVID‐19. J Ultrasound Med 2020; 39:1413–1419. 10.1002/jum.15285. [DOI] [PMC free article] [PubMed] [Google Scholar]
- 18. Vassalou EE, Karantanas AH, Antoniou KM. Proposed lung ultrasound protocol during the COVID‐19 outbreak. J Ultrasound Med. 2020; 40:397–399. 10.1002/jum.15402. [DOI] [PMC free article] [PubMed] [Google Scholar]
- 19. Volpicelli G, Elbarbary M, Blaivas M, et al. International evidence‐based recommendations for point‐of‐care lung ultrasound. Intensive Care Med 2012; 38:577–591. 10.1007/s00134-012-2513-4. [DOI] [PubMed] [Google Scholar]
- 20. Lichtenstein DA, Mezière GA. Relevance of lung ultrasound in the diagnosis of acute respiratory failure: the BLUE protocol. Chest 2008; 134:117–125. 10.1378/chest.07-2800. [DOI] [PMC free article] [PubMed] [Google Scholar]
- 21. Lichtenstein DA. BLUE‐protocol and FALLS‐protocol: two applications of lung ultrasound in the critically ill. Chest 2015; 147:1659–1670. 10.1378/chest.14-1313. [DOI] [PubMed] [Google Scholar]
- 22. Fine JP. Comparing nonnested cox models. Biometrika 2002; 89:635–647. [Google Scholar]
- 23. DeLong ER, DeLong DM, Clarke‐Pearson DL. Comparing the areas under two or more correlated receiver operating characteristic curves: a nonparametric approach. Biometrics 1988; 44:837–845. [PubMed] [Google Scholar]
- 24. Bonadia N, Carnicelli A, Piano A, et al. Lung ultrasound findings are associated with mortality and need for intensive care admission in COVID‐19 patients evaluated in the emergency department. Ultrasound Med Biol 2020; 46:2927–2937. 10.1016/j.ultrasmedbio.2020.07.005. [DOI] [PMC free article] [PubMed] [Google Scholar]
- 25. Manivel V, Lesnewski A, Shamim S, Carbonatto G, Govindan T. CLUE: COVID‐19 lung ultrasound in emergency department. Emerg Med Australas 2020; 32:694–696. 10.1111/1742-6723.13546. [DOI] [PMC free article] [PubMed] [Google Scholar]
- 26. Brahier T, Meuwly J‐Y, Pantet O, et al. Lung ultrasonography for risk stratification in patients with COVID‐19: a prospective observational cohort study. Clin Infect Dis 2020; 46:2927–2937. 10.1093/cid/ciaa1408. [DOI] [PMC free article] [PubMed] [Google Scholar]
- 27. Ji L, Cao C, Gao Y, et al. Prognostic value of bedside lung ultrasound score in patients with COVID‐19. Crit Care 2020; 24:700. 10.1186/s13054-020-03416-1. [DOI] [PMC free article] [PubMed] [Google Scholar]
- 28. Castelao J, Graziani D, Soriano JB, Izquierdo JL. Findings and prognostic value of lung ultrasound in COVID‐19 pneumonia. J Ultrasound Med 2021; 40:1315–1324. 10.1002/jum.15508. [DOI] [PubMed] [Google Scholar]
- 29. Yasukawa K, Minami T, Boulware DR, Shimada A, Fischer EA. Point‐of‐care lung ultrasound for COVID‐19: findings and prognostic implications from 105 consecutive patients. J Intensive Care Med 2021; 36:334–342. 10.1177/0885066620988831. [DOI] [PMC free article] [PubMed] [Google Scholar]
- 30. Ravetti CG, Vassallo PF, de Barros GM, et al. Lung ultrasound can predict the clinical course and severity of COVID‐19 disease. Ultrasound Med Biol 2021; 47:2090–2096. 10.1016/j.ultrasmedbio.2021.04.026. [DOI] [PMC free article] [PubMed] [Google Scholar]
- 31. Covinsky KE, Pierluissi E, Johnston CB. Hospitalization‐associated disability: “she was probably able to ambulate, but I'm not sure.”. JAMA 2011; 306:1782–1793. 10.1001/jama.2011.1556. [DOI] [PubMed] [Google Scholar]
- 32. Felten‐Barentsz KM, van Oorsouw R, Klooster E, et al. Recommendations for hospital‐based physical therapists managing patients with COVID‐19. Phys Ther 2020; 100:1444–1457. 10.1093/ptj/pzaa114. [DOI] [PMC free article] [PubMed] [Google Scholar]
- 33. Kumar A, Weng Y, Duanmu Y, et al. Lung ultrasound findings in patients hospitalized with COVID‐19. J Ultrasound Med. 2021; 41:89–96. [DOI] [PMC free article] [PubMed] [Google Scholar]
- 34. Shi H, Han X, Jiang N, et al. Radiological findings from 81 patients with COVID‐19 pneumonia in Wuhan, China: a descriptive study. Lancet Infect Dis 2020; 20:425–434. 10.1016/S1473-3099(20)30086-4. [DOI] [PMC free article] [PubMed] [Google Scholar]
- 35. Zhao W, Zhong Z, Xie X, Yu Q, Liu J. Relation between chest CT findings and clinical conditions of coronavirus disease (COVID‐19) pneumonia: a multicenter study. AJR Am J Roentgenol 2020; 214:1072–1077. 10.2214/AJR.20.22976. [DOI] [PubMed] [Google Scholar]
- 36. Wan S, Li M, Ye Z, et al. CT manifestations and clinical characteristics of 1115 patients with coronavirus disease 2019 (COVID‐19): a systematic review and meta‐analysis. Acad Radiol 2020; 27:910–921. 10.1016/j.acra.2020.04.033. [DOI] [PMC free article] [PubMed] [Google Scholar]
- 37. Yoon SH, Lee KH, Kim JY, et al. Chest radiographic and CT findings of the 2019 novel coronavirus disease (COVID‐19): analysis of nine patients treated in Korea. Korean J Radiol 2020; 21:494–500. 10.3348/kjr.2020.0132. [DOI] [PMC free article] [PubMed] [Google Scholar]