

Abstract
To evaluate the effects of Caspase‐3 (CASP3) gene expression and serum levels on preventing severe acute respiratory syndrome coronavirus 2 (SARS‐CoV‐2) infection. A total of 41 individuals (male: 21; female: 20) with SARS‐CoV‐2 infection were included in the current study. Hemograms were examined from patient blood samples, and CASP3 gene expression levels were detected. Also, human CASP3 levels were determined from the serum samples of patients. The mean age of patients was 56.220 ± 18.937 years. Significant differences were detected among all groups for CASP3 (p = 0.014) and CASP3 concentration (p = 0.024). The relationship between CASP3 levels and hemoglobin (p = 0.023), between CASP3 levels and C‐reactive protein (CRP) (p = 0.001), between CASP3 levels and ferritin (p = 0.003), between CASP3 levels and lactate dehydrogenase (p = 0.001), and between CASP3 levels and SpO2 (p = 0.006) were statistically significant. Also, the relationship between CASP3 concentration levels and SpO2 was statistically significant (p < 0.046). The CASP3 gene and/or its products have an important function to prevent injury caused by SARS‐CoV‐2 infection. They play crucial roles in maintaining cellular homeostasis and viability. Perhaps CASP3 levels may provide information about the severity of the disease.
Keywords: CASP3 gene, cellular homeostasis, SARS‐CoV‐2
Highlights
Newly developed methods for pathogenesis; will guide the control of the epidemic in the future.
The CASP3 gene and/or its products have an important function to prevent injury caused by SARS‐CoV‐2 infection.
CASP3 gene can be a prognostic marker for the severity of COVID‐19 disease.
1. INTRODUCTION
Coronavirus disease 2019 (COVID‐19) is an infectious disease that primarily affects the lungs caused by a novel betacoronavirus, severe acute respiratory syndrome coronavirus 2 (SARS‐CoV‐2). It was first described in December 2019 in China and was later declared the cause of the pandemic. The novel virus was named SARS‐CoV‐2 by World Health Organization (WHO). SARS‐CoV‐2 is more than 79% homologous with SARS‐CoV. Despite the genetic sequencing similarity of the novel coronavirus with the SARS virus, managing this unknown disease with its nonspecific manifestations remains challenging for physicians. 1 , 2
The cysteinyl aspartate‐specific proteinase‐3 (CASP3) gene, located at chromosomal 4q35.1 region and including nine exons, is a common key enzyme in the apoptosis and pyroptosis pathways. This enzyme belongs to the caspase (from cysteine‐aspartate protease) family, one of the six protease families with essential functions in normal cellular development. 3 , 4
Initiation of apoptosis occurs both intrinsic or extrinsic pathway. As initiator caspases, caspases‐8 and −10 are activated and they can then directly cleave and activate effector caspases, such as CASP3. As a result, apoptosis occurs. 5 It was reported that compared with the control group, lipopolysaccharide‐induced oxidation and apoptosis cause active CASP3 overexpression and cell viability inhibition. 6 As a result, apoptosis increases due to the increase in CASP3 level. We planned the current study with the thought that to eliminate potentially harmful cells damaged by SARS‐CoV‐2 infection for the organism in patients with different disease severity classification, the rate of apoptosis will increase depending on the elevation of both caspase 3 mRNA and CASP3 serum levels, so the virulence and severity of the disease will decrease by the elimination of virus‐infected cells.
Both past and present studies about the relationship between the CASP3 gene and various viral infections, such as Enterovirus 71 (EV71), 7 , 8 , 9 parvovirus H1, 10 human cytomegalovirus, 11 hepatitis C virus, 12 H5N1 Cambodia PA virus, 13 Caprine parainfluenza virus type 3, 14 and others have been performed. However, to the best of our knowledge, no studies have been conducted about the expression levels and functions of nucleolin on CASP3 gene expression in patients with different degrees of cellular injury caused by SARS‐CoV‐2 infection who had mild illness and healed from the disease and those with mild disease, moderate, severe, and critical illness. Thus, we performed the current study to evaluate the effects of CASP3 gene expression and serum levels on preventing SARS‐CoV‐2 infection. The current study provides the initial insights into the putative role of the CASP3 in SARS‐CoV‐2 infection.
2. MATERIALS AND METHODS
2.1. Patients and groups
Totally 41 individuals (male: 21; female: 20) with SARS‐CoV2 infection were included in the current study. The study was approved by both the Ministry of Health and Local Ethics Committee (Duzce University Local Ethic Committee's approval document dated 11.05.2020 and numbered 90). The patients were divided into four main groups such as mild (both patients with mild illness and healed from the disease [n = 8], and patients with mild disease [n = 8]), moderate (n = 8), severe (n = 9), and critical (n = 8). Under 18 age and pregnant women were excluded. Patients were classified according to the https://www.covid19treatmentguidelines.nih.gov/overview/clinical-spectrum/.
Mild Illness: Individuals who have any of the various signs and symptoms of COVID‐19 (e.g., fever, cough, sore throat, malaise, headache, muscle pain, nausea, vomiting, diarrhea, loss of taste, and smell) but who do not have shortness of breath, dyspnea, or abnormal chest imaging.
Moderate illness: Individuals who show evidence of lower respiratory disease during clinical assessment or imaging and who have an oxygen saturation (SpO2) ≥94% on room air at sea level.
Severe illness: Individuals who have SpO2 < 94% on room air at sea level, a ratio of arterial partial pressure of oxygen to fraction of inspired oxygen (PaO2/FiO2) <300 mmHg, respiratory frequency >30 breaths/min, or lung infiltrates >50%.
Critical illness: Individuals who have respiratory failure, septic shock, and/or multiple organ dysfunction.
Patients with mild disease and a duration of disease at least 1 month were defined as “healed.”
2.1.1. Detection of blood parameters
The blood samples of hemogram parameter (hemoglobin [HB], platelet [PLT], lymphocyte) values were analyzed in the Beckman Coulter LH 780 Analyser. C‐reactive protein (CRP) values measurements were performed by using original commercial kits in the Roche Cobas İntegra 400 plus auto analyzer. d‐Dimer levels were analyzed by analyzer of Cobas Roche t511. Serum lactate dehydrogenase (LDH), ferritin levels were analyzed by auto‐analyzer of Roche Cobas 702.
Polymerase chain reactions were performed in Real‐Time PCR analyzer (Anatolia Geneworks) and SARS‐CoV‐2 RTqPCR Detection Kit (Bioeksen) was used for these analyzes.
2.1.2. Blood collection
The blood samples from the patients were taken. Hemogram was examined from the blood samples of patients and also CASP3 gene expressions levels were detected. Additionally, Human Caspase 3 level was determined from the serum samples obtained from the blood of the patients.
2.1.3. Detection of human Caspase 3 concentration via enzyme‐linked immunosorbent assay (ELISA)
Human Caspase 3 level was determined from human serum using the Human Caspase 3 kit (Bioassay Technology) (Catalog No: E4804Hu) via ELISA method based on biotin double antibody sandwich technology. Bio‐Tek Instrumens ELX 50 Strip Washer was used as microplate washer. Determination of the optical density (OD value) of each well was performed immediately using a microplate reader (Bio‐Tek Instrumens ELX 800 Absorbance Microplare Reader) at 450 nm wavelength. The results of the samples were obtained by replacing the absorbance values taken from the device in the calibration graph.
2.1.4. RNA isolation and complementary DNA (cDNA) synthesis
Whole blood samples of patients were obtained in RNase and DNase free tubes containing ethylenediaminetetraacetic acid for RNA isolation. Then RNA was isolated from the whole blood samples of the patients using QIAamp RNA Blood Mini isolation kits (Catalog No: 52304) according to the manufacturer's instructions. Measurements were made in a spectrophotometer to evaluate the suitability of the RNA quality for the study. The isolated RNA was stored at –20°C in RNase‐free water until the study time. Using the QuantiTect® Reverse Transcription cDNA synthesis kit (Catalog No: 205311), cDNA was obtained from isolated RNA.
2.1.5. Relative gene expressions of CASP3 Gene by real‐time qPCR
For each cDNA sample, the expression levels of CASP3 and the reference gene (ACTB) were analyzed using the Applied Biosystems 7500 and ViiA7 Real‐Time PCR Systems. Polymerase chain reactions (PCRs) were in a final volume of 20 µl: 4 µl cDNA, 3 µl RNase‐Free Distilled Water, 10 µl 2x QuantiNova SYBR Green PCR Master Mix (Catolog No: 208052), 1 µl QN ROX Reference Dye (Applied Biosystems cycler only) and 2 µl primer–probe set (Oligomer). Cycle conditions of the Real‐Time qPCR were initial denaturation at 95°C for 120 s, 40 cycles of denaturation at 95°C for 5 s, and 40 cycles of annealing at 60°C for 10 s. ACTB transcript is used as reference for quantitation of mRNA expressions and normalized according to the control group. Calculation of fold change had been made by processing ΔΔCt values as .
2.2. Statistical analysis
The data were evaluated using the Statistical Package for Social Sciences (IBM Corp.) for Windows 23.0. The Shapiro–Wilk test was used to detect the distribution of data. As the data were not normally distributed (p < 0.05), nonparametric tests were used for statistical analysis. In addition to descriptive statistic (number, mean, standard deviation [SD]) for each variable, Kruskal–Wallis test was used for the comparison of all groups, also polynominal regression test was performed. The p value lower than 0.05 (p < 0.05) was accepted as statistically significant.
3. RESULTS
Totally 41 individuals (male: 21; female:20) with SARS‐CoV2 infection were included in the current study. The mean age of patients were 56.220 ± 18.937. Statistically significant differences were detected among all groups for age of patients (χ 2 = 20.210, p < 0001). The ages of the individuals included in the study were critical (71.875 ± 12.264), severe (70.375 ± 12.247), moderate (58.222 ± 11.355), and mild (40.188 ± 15.272) from the oldest to the youngest, respectively (Table 1).
Table 1.
The Hemogram values, CASP3 and CASP3 concentration levels of each group
| Groups | ||||||
|---|---|---|---|---|---|---|
| Mild (n = 16) | Moderate (n = 9) | Severe (n = 8) | Critical (n = 8) | Χ 2/p | ||
| Age (years) | 40.188 ± 15.272 | 58.222 ± 11.355 | 70.375 ± 12.247 | 71.875 ± 12.264 | 20.210/0.000* | |
| HB | 12.588 ± 1.767 | 12.756 ± 2.094 | 13.213 ± 2.389 | 12.813 ± 1.132 | 1.183/0.757 | |
| PLT | 203.750 ± 54.176 | 281.667 ± 140.000 | 314.000 ± 102.271 | 230.375 ± 134.430 | 5.587/0.134 | |
| Lymphocyte | 671.250 ± 166.342 | 652.222 ± 326.488 | 596.250 ± 226.838 | 573.750 ± 254.948 | 0.991/0.803 | |
| CRP | 2.824 ± 2.707 | 7.076 ± 5.490 | 7.249 ± 9.464 | 7.933 ± 6.678 | 4.322/0.229 | |
| Ferritin | 206.400 ± 136.862 | 549.111 ± 246.763 | 569.250 ± 420.320 | 1145.625 ± 502.592 | 13.459/0.004* | |
| d‐dimer | 0.391 ± 0.185 | 0.762 ± 0.575 | 1.133 ± 1.249 | 6.153 ± 7.582 | 11.588/0.009* | |
| LDH | 315.125 ± 152.031 | 305.111 ± 92.669 | 349.250 ± 103.989 | 716.250 ± 235.635 | 16.421/0.001* | |
| SpO2 | 95.563 ± 1.153 | 90.444 ± 3.046 | 82.125 ± 5.817 | 68.625 ± 7.873 | 35.260/0.000* | |
|
CASP3
|
4.923 ± 4.098 | 3.153 ± 1.429 | 2.576 ± 2.244 | 0.955 ± 1.044 | 10.609/0.014* | |
| CASP3 conc. | 2.225 ± 3.747 | 0.467 ± 0.423 | 0.394 ± 0.509 | 0.415 ± 0.654 | 9.427/0.024* | |
Abbreviations: CASP3, Caspase 3; Conc, concentration; CRP, C‐reactive protein; HB, hemoglobin; LDH, lactate dehydrogenase; PLT, platelet; SpO2, oxygen saturation level in the blood.
Statistically significant.
The mean CASP3 and CASP3 concentration values of each group are given in the Table 1. When the all groups were considered, statistically significant differences were detected among all groups for CASP3 (χ 2 = 10.609; p = 0.014) (Table 1) (Figure 1A) and CASP3 concentration (χ 2 = 9.427; p = 0.024) (Table 1) (Figure 1C). To understand which groups causes these differences, double comparison of the groups was performed. When the two groups were compared in terms of CASP3 values, there were statistically significant differences between mild and critical groups (χ 2 = 8.825, p = 0.003) and between moderate and critical groups (χ 2 = 6.750, p = 0.009) (Table 2). When the two groups were compared in terms of CASP3 concentration values, there were statistically significant differences between mild and severel groups (χ 2 = 4.730, p = 0.030) and between mild and critical groups (χ 2 = 6.334, p = 0.012) (Table 2).
Figure 1.

Experimental demonstration of SARS‐CoV‐2 infection. The patients were divided into four main groups such as mild (patients with mild illness and healed from the disease, and patients with mild disease), moderate, severe, and critical. Both CASP3 levels and CASP3 concentration levels of patients were detected. SARS‐CoV‐2 infection caused cellular damage and a response occurs in the nucleus of cells. CASP3 gene is transcribed CASP3 mRNA and CASP3 proteins are translated from mature CASP3 mRNA. Statistically significant differences were detected among all groups for both CASP3 levels (A and B) and CASP3 concentration levels of patients (C and D). CASP3, Caspase‐3; SARS‐CoV‐2, severe acute respiratory syndrome coronavirus 2
Table 2.
Binary comparison of the groups for CASP3 , CASP3 concentration, and blood parameters
| Grps | Mild | Moderate | Severe | Critical | |||||
|---|---|---|---|---|---|---|---|---|---|
| χ 2 | p | χ 2 | p | χ 2 | p | χ 2 | P | ||
| CASP3 | |||||||||
| Mild | – | – | 0.821 | 0.365 | 1.577 | 0.209 | 8.825 | 0.003* | |
| Moderate | 0.821 | 0.365 | – | – | 0.037 | 0.847 | 6.750 | 0.009* | |
| Severe | 1.577 | 0.209 | 0.037 | 0.847 | – | – | 2.824 | 0.093 | |
| Critical | 8.825 | 0.003* | 6.750 | 0.009* | 2.824 | 0.093 | – | – | |
| CASP3 Conc | Mild | – | – | 3.492 | 0.062 | 4.730 | 0.030* | 6.334 | 0.012* |
| Moderate | 3.492 | 0.062 | – | – | 0.280 | 0.596 | 0.949 | 0.330 | |
| Severe | 4.730 | 0.030* | 0.280 | 0.596 | – | – | 0.557 | 0.456 | |
| Critical | 6.334 | 0.012* | 0.949 | 0.330 | 0.557 | 0.456 | – | – | |
| Ferritin | Mild | – | – | 5.444 | 0.020* | 3.086 | 0.079 | 8.571 | 0.003* |
| Moderate | 5.444 | 0.020* | – | – | 0.083 | 0.773 | 6.510 | 0.011* | |
| Severe | 3.086 | 0.079 | 0.083 | 0.773 | – | – | 3.982 | 0.046* | |
| Critical | 8.571 | 0.003* | 6.510 | 0.011* | 3.982 | 0.046* | – | – | |
| D‐dimer | Mild | – | – | 1.129 | 0.288 | 6.904 | 0.009* | 9.303 | 0.002* |
| Moderate | 1.129 | 0.288 | – | – | 0.455 | 0.500 | 3.717 | 0.054* | |
| Severe | 6.904 | 0.009* | 0.455 | 0.500 | – | – | 1.867 | 0.172 | |
| Critical | 9.303 | 0.002* | 3.717 | 0.054* | 1.867 | 0.172 | – | – | |
| LDH | Mild | – | – | 0.333 | 0.564 | 0.397 | 0.529 | 9.276 | 0.002* |
| Moderate | 0.333 | 0.564 | – | – | 0.750 | 0.386 | 12.000 | 0.001* | |
| Severe | 0.397 | 0.529 | 0.750 | 0.386 | – | – | 9.926 | 0.002* | |
| Critical | 9.276 | 0.002* | 12.000 | 0.001* | 9.926 | 0.002* | – | – | |
| SpO2 | Mild | – | – | 14.821 | <0001* | 15.835 | <0001* | 15.842 | <0001* |
| Moderate | 14.821 | <0001* | – | – | 10.280 | 0.001 | 12.134 | <0001* | |
| Severe | 15.835 | <0001* | 10.280 | 0.001 | – | – | 8.802 | 0.003* | |
| Critical | 15.842 | <0001* | 12.134 | 0.000* | 8.802 | 0.003* | – | – | |
Abbreviations: CASP3, Caspase 3; Conc, concentration; LDH, lactate dehydrogenase; SpO2, Oxygen saturation level in the blood.
Statistically significant.
The Mean ± SD Hemogram values of each group are given in the Table 1. When all groups were taken into consideration, statistically significant differences were detected among the groups for ferritin (χ 2 = 13.459, p = 0.004), for d‐dimer (χ 2 = 11.588, p = 0.009), for LDH (χ 2 = 16.421, p = 0.001) and for SpO2 (χ 2 = 35.260, p < 0001), respectively (Table 1). To understand these differences' causes from which groups, double comparison of the groups was carried out. Statistically significant differences between mild (206.400 ± 136.862) and moderate (549.111 ± 246.763) (χ 2 = 5.444, p = 0.020), between mild (206.400 ± 136.862) and critical (1145.625 ± 502.592) (χ 2 = 8.571, p = 0.003), between moderate (549.111 ± 246.763) and critical (1145.625 ± 502.592) (χ 2 = 6.510, p = 0.011), between severe (569.250 ± 420.320) and critical (1145.625 ± 502.592) (χ 2 = 3.982, p = 0.046) were detected for ferritin (Table 2). The ferritin values of the patients included in the study were critical (1145.625 ± 502.592), severe (569.250 ± 420.320), moderate (549.111 ± 246.763), and mild (206.400 ± 136.862) from the highest to the lowest, respectively (Table 1).
When the two groups were compared in terms of d‐dimer, statistically significant differences between mild (0.391 ± 0.185) and severe (1.133 ± 1.249) (χ 2 = 6.904, p = 0.009), between mild (0.391 ± 0.185) and critical (6.153 ± 7.582) (χ 2 = 9.303, p = 0.002), between moderate (0.762 ± 0.575) and critical (6.153 ± 7.582) (χ 2 = 3.717, p = 0.054) were detected (Table 2). The d‐dimer values of the patients included in the study were critical (6.153 ± 7.582), severe (1.133 ± 1.249), moderate (0.762 ± 0.575) and mild (0.391 ± 0.185) from the highest to the lowest, respectively (Table 1).
Also, statistically significant differences between mild (315.125 ± 152.031) and critical (716.250 ± 235.635) (χ 2 = 9.276, p = 0.002), between moderate (305.111 ± 92.669) and critical (716.250 ± 235.635) (χ 2 = 12.000, p = 0.001), between severe (349.250 ± 103.989) and critical (716.250 ± 235.635) (χ 2 = 9.926, p = 0.002) were detected for LDH (Table 2). The LDH values of the patients included in the study were critical (716.250 ± 235.635), severe (349.250 ± 103.989), mild (315.125 ± 152.031), and moderate (305.111 ± 92.669) from the highest to the lowest, respectively (Table 1).
Additionally, statistically significant differences between mild (95.563 ± 1.153) and moderate (90.444 ± 3.046) (χ 2 = 14.821, p < 0001), between mild (95.563 ± 1.153) and severe (82.125 ± 5.817) (χ 2 = 15.835, p < 0001), between mild (95.563 ± 1.153) and critical (68.625 ± 7.873) (χ 2 = 15.842, p < 0001), between moderate (90.444 ± 3.046) and critical (68.625 ± 7.873) (χ 2 = 12.134, p < 0001), between severe (82.125 ± 5.817) and critical (68.625 ± 7.873) (χ 2 = 8.802, p = 0.003) were detected for SpO2 (Table 2). The SpO2 values of the patients included in the study were critical (68.625 ± 7.873), severe (82.125 ± 5.817), moderate (90.444 ± 3.046), and mild (95.563 ± 1.153) from the lowest to the highest, respectively (Table 1).
When we divided Group 1 into two subgroup such as patients with mild illness and healed from the disease, and patients with mild disease, statistically significant differences were detected among all groups for age (χ 2 = 24.526; p < 0001), CASP3 (χ 2 = 10.613; p = 0.031) and CASP3 concentration (χ 2 = 12.401; p = 0.015) (Table 3). According to this grouping, the CASP3 values of the patients included in the study were critical (0.955 ± 1.044), severe (2.576 ± 2.244), moderate (3.153 ± 1.429), healed (4.141 ± 2.745), and mild (5.704 ± 5.203) from the lowest to the highest, respectively (Table 3) (Figure 1B). The CASP3 concentration values of the patients included in the study were severe (0.394 ± 0.509), critical (0.415 ± 0.654), moderate (0.467 ± 0.423), mild (0.671 ± 0.597), and healed (3.779 ± 4.920) from the lowest to the highest, respectively (Table 3) (Figure 1D).
Table 3.
The age, CASP3 , and CASP3 concentration levels of each group when Group 1 divided into two subgroup such as patients with mild illness and healed from the disease, and patients with mild disease
| Groups | |||||||
|---|---|---|---|---|---|---|---|
| Healed (n = 8) | Mild (n = 8) | Moderate (n = 9) | Severe (n = 8) | Critical (n = 8) | Χ2/p | ||
| Age (years) | 30.375 ± 2.875 | 50.000 ± 16.475 | 58.222 ± 11.355 | 70.375 ± 12.247 | 71.875 ± 12.264 | 24.526/0.000* | |
|
CASP3
|
4.141 ± 2.745 | 5.704 ± 5.203 | 3.153 ± 1.429 | 2.576 ± 2.244 | 0.955 ± 1.044 | 10.613/0.031* | |
| CASP3conc. | 3.779 ± 4.920 | 0.671 ± 0.597 | 0.467 ± 0.423 | 0.394 ± 0.509 | 0.415 ± 0.654 | 12.401/0.015* | |
Abbreviations: CASP3, caspase 3; conc, concentration.
Statistically significant
Although the CASP3 values of the patients with mild group is approximately 1.4 times higher than the healed group, the CASP3 concentration values of the patients with healed group is approximately 5.6 times higher in the healed group than in the mild group.
Additionally, statistically significant differences were detected among all groups for sex (χ 2 = 9.092, p = 0.028), additional disease (χ 2 = 17.338, p = 0.001), HT (χ 2 = 11.167, p = 0.011), and lungs (χ 2 = 10.871, p = 0.012) (Table 4).
Table 4.
The sex and additional diseases of each group
| Groups | |||||
|---|---|---|---|---|---|
| Mild (n = 16) | Moderate (n = 9) | Severe (n = 8) | Critical (n = 8) | Χ 2/p | |
| Sex (M/F) | 4(25%)/12(75%) | 5(55.6%)/4(44.4%) | 5(62.5%)/3(37.5%) | 7(87.5%)/1(12.5%) | 9.092/0.028* |
| AD (Y/N) | 3(18.8%)/13(81.2%) | 7(77.8%)/2(22.2%) | 7(87.5%)/1(12.5%) | 7(87.5%)/1(12.5%) | 17.338/0.001* |
| DM (Y/N) | 2(12.5%)/14(87.5%) | 5(55.6%)/4(44.4%) | 2(25%)/6(75%) | 2(25%)/6(75%) | 5.484/0.140 |
| HT (Y/N) | 2(12.5%)/14(87.5%) | 5(55.6%)/4(44.4%) | 6(75%)/2(25%) | 5(62.5%)/3(37.5%) | 11.167/0.011* |
| CVA (Y/N) | 0(0%)/16(100%) | 1(11.1%)/8(88.9%) | 0(0%)/8(100%) | 2(25%)/6(75%) | 5.774/0.123 |
| CRD (Y/N) | 0(0%)16(100%) | 1(11.1%)/8(88.9%) | 4(50%)/4(50%) | 1(12.5%)/7(87.5%) | 10.871/0.012* |
| CRF (Y/N) | 0(0%)16(100%) | 1(11.1%)/8(88.9%) | 0(0%)/8(100%) | 0(0%)/8(100%) | 2.390/0.303 |
| Malig (Y/N) | 0(0%)16(100%) | 1(11.1%)/8(88.9%) | 0(0%)/8(100%) | 2(25%)/6(75%) | 12.228/0.201 |
| CVD (Y/N) | 3(18.8%)/13(81.2%) | 3(33.3%)/6(66.7%) | 2(25%)/6(75%) | 1(12.5%)/7(87.5%) | 1.237/0.744 |
Abbreviations: AD, additional Disease; CVA: Cerebrovascular accident; CRF, chronic renal failure; CVD, cardiovascular disease; CRD, chronic respiratory disease; DM, diabetes mellitus; HT, hypertension; Malig, Malignancy; M, male; N, no; f, female; Y, yes.
Statistically significant.
When the both CASP3 and CASP3 concentration levels of the related genes and blood parameters to be considered, the relationships between CASP3 levels and HB (p = 0.023), between CASP3 levels and CRP (p = 0.001), between CASP3 levels and ferritin (p = 0.003), between CASP3 levels and LDH (p = 0.001), and between CASP3 levels and SpO2 (p = 0.006) were statistically significant (Table 5 and Figure 2). Additionally, the relationship between CASP3 concentration levels and SpO2 was statistically significant (p < 0.046) (Table 5 and Figure 2), too.
Table 5.
Model summary and parameter estimates for between both CASP3 and CASP3 concentration levels and hemogram parameters
| Model summery | Parameter estimates | |||||||||
|---|---|---|---|---|---|---|---|---|---|---|
| Variable | Equation | R 2 | F | df1 | df2 | sig | Constant | b1 | b2 | b3 |
| CASP3 and HB | Linear | 0.157 | 5.761 | 1 | 31 | 0.023 | 12.162 | −0.706 | ||
| Log | 0.155 | 5.704 | 1 | 31 | 0.023 | 24.263 | ‐8.327 | |||
| Cubic | 0.157 | 2.796 | 2 | 30 | 0.077 | 13.477 | ‐0.870 | 0.000 | 0.000 | |
| CASP3 and CRP | Linear | 0.102 | 3.526 | 1 | 31 | 0.070 | 4.107 | ‐0.160 | ||
| Log | 0.305 | 13.579 | 1 | 31 | 0.001 | 4.713 | ‐1.337 | |||
| Cubic | 0.187 | 2.219 | 3 | 29 | 0.107 | 5.598 | ‐1.050 | 0.090 | ‐0.002 | |
| CASP3 and Ferritin | Linear | 0.276 | 10.656 | 1 | 28 | 0.003 | 3.738 | ‐0.002 | ||
| Log | 0.199 | 6.973 | 1 | 28 | 0.013 | 8.015 | ‐0.909 | |||
| Cubic | 0.291 | 3.560 | 3 | 26 | 0.028 | 3.630 | ‐0.001 | ‐2.567 | 1.081 | |
| CASP3 and LDH | Linear | 0.170 | 6.357 | 1 | 31 | 0.017 | 5.585 | −0.006 | ||
| Log | 0.300 | 13.272 | 1 | 31 | 0.001 | 25.178 | −3.731 | |||
| Cubic | 0.437 | 7.508 | 3 | 29 | 0.001 | 19.222 | −0.085 | 0.000 | −5.124 | |
| CASP3 and SpO2 | Linear | 0.179 | 8.522 | 1 | 39 | 0.006 | −7.163 | 0.121 | ||
| Log | 0.168 | 7.896 | 1 | 39 | 0.008 | −37.893 | 9.254 | |||
| Cubic | 0.211 | 5.082 | 2 | 38 | 0.011 | 13.554 | −0.277 | 0.000 | 2.027 | |
| CASP3Conc. and SpO2 | Linear | 0.057 | 2.346 | 1 | 39 | 0.134 | −3.500 | 0.053 | ||
| Log | 0.048 | 1.972 | 1 | 39 | 0.168 | −16.191 | 3.890 | |||
| Cubic | 0.150 | 3.343 | 2 | 38 | 0.046 | 12.069 | 0.000 | −0.006 | 5.339 | |
| CASP3 and Lymp. | Linear | 0.005 | 0.141 | 1 | 31 | 0.710 | 2.538 | 0.001 | ||
| Logarithmic | 0.006 | 0.178 | 1 | 31 | 0.676 | −0.765 | 0.607 | |||
| Cubic | 0.006 | 0.058 | 3 | 29 | 0.982 | 1.124 | 0.007 | −7.726 | 2.768 | |
| CASP3Conc. and Lymp. | Linear | 0.018 | 0.573 | 1 | 31 | 0.455 | 0.669 | 0.000 | ||
| Logarithmic | 0.028 | 0.880 | 1 | 31 | 0.355 | 1.872 | −0.218 | |||
| Cubic | 0.182 | 2.144 | 3 | 29 | 0.116 | −0.909 | 0.009 | −1.398 | 6.346 | |
Abbreviations: CASP3, caspase 3; conc, concentration; HB, hemoglobin; PLT, Platelet; CRP, C‐reactive protein; LDH, lactate dehydrogenase; Lymp, lymphocytes; SpO2, oxygen saturation level in the blood.
Figure 2.
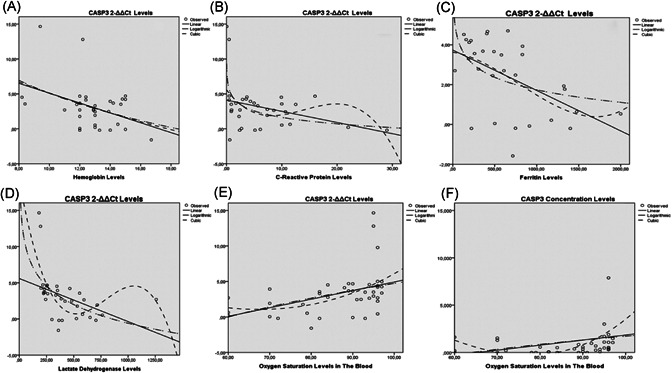
Relationship among both CASP3 levels and CASP3 concentration levels of patients and blood parameters. Statistically significant relation were detected between CASP3 levels and hemoglobin (A), between CASP3 levels and CRP (B), between CASP3 levels and ferritin (C), between CASP3 levels and LDH (D) and between CASP3 levels and SpO2 (E). Additionally, the relationship between CASP3 concentration levels and SpO2 was statistically significant (p < 0.046) (F), too. CASP3, Caspase‐3; CRP, C‐reactive protein; LDH, lactate dehydrogenase
Experimental demonstration of SARS‐CoV‐2 infection is given in Figure 1. The patients were divided into four main groups such as mild (patients with mild illness and healed from the disease, and patients with mild disease), moderate, severe, and critical. Both CASP3 levels and CASP3 concentration levels of patients were detected. SARS‐CoV‐2 infection caused cellular damage and a response occurs in the nucleus of cells. So CASP3 gene is transcribed CASP3 mRNA and CASP3 proteins are translated from mature CASP3 mRNA. Statistically significant differences were detected among all groups for both CASP3 levels (a and b) and CASP3 concentration levels of patients (c and d) (Figure 1).
4. DISCUSSION
In this study, CASP3 levels increased as poor prognostic factors (LDH, ferritin, d‐dimer, and HB) for SARS‐CoV‐2 infection increased. Also, the relationship between serum CASP3 concentration levels and SpO2 was statistically significant.
Statistically significant differences were detected among all groups for patient ages. The disease severity of the individuals included in the study was critical, severe, moderate, and mild, ranging from the oldest to the youngest. Therefore, the disease progresses from being more severe in the elderly compared with the young. This difference might be due to the increased risk of cellular ageing and the decrease in metabolic rate, increasing the risk of other diseases.
Zhang et al. showed that EV71‐induced T‐lymphocyte apoptosis has a crucial function in hand, foot, and mouth disease. They indicated that EV71 infection significantly induced apoptosis in human T‐lymphocytes, increased the pro‐apoptosis Bcl‐2‐associated X (Bax) expression, and the cleaved CASP3 conversely decreased the antiapoptosis B‐cell lymphoma protein 2 (Bcl2) expression. 7 Chen et al. reported, and we verified that viral 2 Apro could activate cellular CASP3. The inhibition of CASP3 activation could lead to the partial restoration of interferon‐alpha receptor 1 (IFNAR1) in cells transfected with 2A or infected with EV71. 8 Another study showed that EV71 induced apoptosis in a CASP3‐dependent pathway. 9 Also, Guo et al. reported that acute kidney injury is a common complication of caecal ligation and puncture‐induced sepsis. Thymoquinone protected against kidney damage and inhibited increases in serum creatinin and blood urea nitrogen levels, high levels of NLR‐family pyrin domain‐containing protein 3, caspase‐1, CASP3, caspase‐8, tumor necrosis factor‐α (TNF‐α), interleukin‐1β (IL‐1β), and IL‐6 in septic BALB/c mice. 15 Moehler et al. reported that hepatoma cell death correlated with parvovirus H1 DNA replication, morphological features of apoptosis, and nonstructural protein expression. Parvovirus H1 induced significant apoptosis. Apoptosis was partially inhibited by DEVD‐CHO, a CASP3 inhibitor. 10 The expression levels of CASP3 were increased and activated in the human cytomegalovirus‐infected cells, in addition to downregulating bel‐2 mRNA expression and upregulating fas mRNA expression. 11 In addition, Allhetheel et al. reported that, while the expression levels of signal transducer and activator of transcriptio‐1 and Interferon regulatory factor ‐1 were significantly downregulated, the expression of CASP3 was significantly upregulated in peripheral blood mononuclear cells of patients infected with the hepatitis C virus. 12 Also, CASP3, 8 and 9 activities and the interferon promoter terminal deoxynucleotidyl transferase‐mediated dUTP nick end‐labeling were strongly induced in early infection in H5N1 Cambodia PA‐infected cells that protect uninfected cells from viral infection. 13 In addition, the Caprine parainfluenza virus type 3, an emerging respiratory pathogen, triggers apoptosis by targeting CASP3, an effector of apoptosis. 14
In our study, we found a significant relationship between CASP3 level and disease severity. Statistically significant differences were detected among all groups for CASP3 (p = 0.014) and CASP3 concentration (p = 0.024). When the two groups were compared regarding CASP3 values, there were statistically significant differences between mild and critical groups (p = 0.003) and between the moderate and critical groups (p = 0.009). Also, statistically significant differences between the mild and severe groups (p = 0.030) and between the mild and critical groups were detected for CASP3 concentration values (p = 0.012). Perhaps, CASP3 levels can provide information about disease severity?
Although the CASP3 values of patients in the mild group is approximately 1.4 times higher than the healed group, the CASP3 concentration values of patients in the healed group are approximately 5.6 times higher in the healed group than in the mild group. Therefore, CASP3 plays a vital role in protecting against SARS‐CoV‐2 infection. CASP3 gene expression starts to increase when the virus is encountered. Disease severity decreases in contrast to the increasing expression capacity and amount of CASP3. CASP3 gene product is found in high amounts in healed individuals. The levels of CASP3 gene expression and/or its products may vary depending on the degree of cellular damage caused by SARS‐CoV‐2 infection. This process may continue until the balance of the cells is restored when homeostasis is achieved. To obtain more certain knowledge about the current topic additional studies about the activity level of the CASP3 are needed.
CASP3 has an important function to maintain the homeostasis of living cells. CASP3 could be used as an indicator to evaluate the degree of the cell damage caused by the SARS‐CoV‐2 infection. Also, CASP3 could be used as a biomarker for selecting the most reliable treatment strategy and then evaluating the success rate of the treatment strategy. All living cells must protect themselves from internal and external dangerous agents such as SARS‐CoV‐2 infection. CASP3 is activated against injury caused by SARS‐CoV‐2 infection as a protective mechanism or triggers the expression of other genes and their products. What role does CASP3 play in regulating gene expression and signaling transduction pathways against injury caused by SARS‐CoV‐2 infection? Can CASP3 be used as a therapeutic agent to prevent injury caused by SARS‐CoV‐2 infection? This approach might lead to developing new therapeutic options against injury caused by SARS‐CoV‐2 infection in the near future. Can these processes protect uninfected cells from a viral infection? Additional studies about the current topic should be conducted to understand this situation more clearly.
Studies reported that as HB 16 , 17 and lymphocyte 18 levels decrease, LDH, 19 , 20 d‐dimer, 21 , 22 , 23 ferritin 24 , 25 levels increase and the severity of disease increases.
When all groups were considered, statistically significant differences were detected among the groups for ferritin (p = 0.004), d‐dimer (p = 0.009), LDH (p = 0.001), and SpO2 (p < 0001).
Statistically significant reverse relations were detected between CASP3 levels and HB, between CASP3 levels and CRP, between CASP3 levels and ferritin, and between CASP3 levels and LDH. Conversely, statistically significant relations between CASP3 levels and SpO2 and between CASP3 concentration levels and SpO2 were detected.
5. CONCLUSION
The CASP3 gene and/or its products have an important function to prevent injury caused by SARS‐CoV‐2 infection. They play crucial roles in maintaining cellular homeostasis and viability. Perhaps CASP3 levels can provide information about the severity of the COVID‐19 disease. Further studies are needed on this subject.
CONFLICT OF INTERESTS
The authors declare that there are no conflict of interests.
AUTHOR CONTRIBUTIONS
Data collection: Pinar Yildiz Gulhan, Recep Eroz, Ozlem Ataoglu, Nevin İnce, Fatih Davran, Cihadiye Elif Öztürk, Zerrin Gamsızkan. Study design: Pinar Yildiz Gulhan, Recep Eroz. Analysis of data: Pinar Yildiz Gulhan, Recep Eroz, Ozlem Ataoglu, Cihadiye Elif Öztürk, Oner Abidin Balbay. Manuscript preparation: Pinar Yildiz Gulhan, Recep Eroz, Ozlem Ataoglu, Nevin İnce, Fatih Davran. Review of manuscript: Pinar Yildiz Gulhan, Recep Eroz, Ozlem Ataoglu, Nevin İnce, Fatih Davran, Cihadiye Elif Öztürk, Oner Abidin Balbay, Zerrin Gamsızkan
ACKNOWLEDGMENT
This study was supported by the Duzce University coordinators of scientific research projects.
Yildiz Gulhan P, Eroz R, Ataoglu O, et al. The evaluation of both the expression and serum protein levels of Caspase‐3 gene in patients with different degrees of SARS‐CoV2 infection. J Med Virol. 2022;94:897‐905. 10.1002/jmv.27362
DATA AVAILABILITY STATEMENT
Due to the nature of this study, participants of this study did not agree for their data to be shared publicly, so supporting data is not available.
REFERENCES
- 1. Yuksel A, Karadogan D, Gurkan CG, et al. Unclear issues regarding COVID‐19. Eurasian J Med. 2020;52(2):191‐196. [DOI] [PMC free article] [PubMed] [Google Scholar]
- 2. Liu X, Zhang R, He G. Hematological findings in coronavirus disease 2019: indications of progression of disease. Ann Hematol. 2020;99(7):1421‐1428. [DOI] [PMC free article] [PubMed] [Google Scholar]
- 3. Lossi L, Castagna C, Merighi A. Caspase‐3 mediated cell death in the normal development of the mammalian cerebellum. Int J Mol Sci. 2018;19(12):3999. [DOI] [PMC free article] [PubMed] [Google Scholar]
- 4. Yagami T, Yamamoto Y, Koma H. Pathophysiological roles of intracellular proteases in neuronal development and neurological diseases. Mol Neurobiol. 2019;56(5):3090‐3112. [DOI] [PubMed] [Google Scholar]
- 5. Parrish AB, Freel CD, Kornbluth S. Cellular mechanisms controlling caspase activation and function. Cold Spring Harb Perspect Biol. 2013;5(6):a008672. 10.1101/cshperspect.a008672 [DOI] [PMC free article] [PubMed] [Google Scholar]
- 6. Lv X, Zhou X, Yan J, Jiang J, Jiang H. Propofol inhibits LPS‐induced apoptosis in lung epithelial cell line, BEAS‐2B. Biomed Pharmacother. 2017;87:180‐187. [DOI] [PubMed] [Google Scholar]
- 7. Zhang M, Chen Y, Cheng X, Cai Z, Qiu S. GATA1/SP1 and miR‐874 mediate enterovirus‐71‐induced apoptosis in a granzyme‐B‐dependent manner in Jurkat cells. Arch Virol. 2020;165(11):2531‐2540. [DOI] [PubMed] [Google Scholar]
- 8. Chen B, Wang Y, Pei X, Wang S, Zhang H, Peng Y. Cellular caspase‐3 contributes to EV‐A71 2Apro‐mediated down‐regulation of IFNAR1 at the translation level. Virol Sin. 2020;35(1):64‐72. [DOI] [PMC free article] [PubMed] [Google Scholar]
- 9. Li ML, Lin JY, Chen BS, et al. EV71 3C protease induces apoptosis by cleavage of hnRNP A1 to promote apaf‐1 translation. PLOS One. 2019;14(9):e0221048. [DOI] [PMC free article] [PubMed] [Google Scholar]
- 10. Moehler M, Blechacz B, Weiskopf N, et al. Effective infection, apoptotic cell killing and gene transfer of human hepatoma cells but not primary hepatocytes by parvovirus H1 and derived vectors. Cancer Gene Ther. 2001;8(3):158‐167. [DOI] [PubMed] [Google Scholar]
- 11. Nie X, Fang F, Li H, et al. Effects of human cytomegalovirus infection on apoptosis and expression of apoptosis‐regulating factors. J Huazhong Univ Sci Technolog Med Sci. 2005;25(5):480‐483. [DOI] [PubMed] [Google Scholar]
- 12. Alhetheel A, Albarrag A, Hakami A, et al. In the peripheral blood mononuclear cells (PBMCs) of HCV infected patients the expression of STAT1 and IRF‐1 is downregulated while that of caspase‐3 upregulated. Acta Virol. 2020;64(3):352‐358. [DOI] [PubMed] [Google Scholar]
- 13. Wang Q, Zhang S, Jiang H, et al. PA from an H5N1 highly pathogenic avian influenza virus activates viral transcription and replication and induces apoptosis and interferon expression at an early stage of infection. Virol J. 2012;9:106. [DOI] [PMC free article] [PubMed] [Google Scholar]
- 14. Li J, Zhong C, Liao Z, et al. Bta‐miR‐98 suppresses replication of caprine parainfluenza virus type 3 through inhibiting apoptosis by targeting caspase‐3. Front Immunol. 2020 28;11:1575. [DOI] [PMC free article] [PubMed] [Google Scholar]
- 15. Guo LP, Liu SX, Yang Q, et al. Effect of thymoquinone on acute kidney injury induced by sepsis in BALB/c mice [published correction appears in Biomed Res Int. 2020 Nov 24;2020:3182919]. BioMed Res Int. 2020;2020:1594726.32626733 [Google Scholar]
- 16. Guan W, Ni Z, Hu Y, et al. Clinical characteristics of coronavirus disease 2019 in China. N Engl J Med. 2020;382(18):1708‐1720. [DOI] [PMC free article] [PubMed] [Google Scholar]
- 17. Tao Z, Xu J, Chen W, et al. Anemia is associated with severe illness in COVID‐19: a retrospective cohort study. J Med Virol. 2021;93(3):1478‐1488. [DOI] [PMC free article] [PubMed] [Google Scholar]
- 18. Tan L, Wang Q, Zhang D, et al. Lymphopenia predicts disease severity of COVID‐19: a descriptive and predictive study [published correction appears in Signal Transduct Target Ther. 2020 Apr 29;5(1):61]. Signal Transduct Target Ther. 2020;5(1):33. [DOI] [PMC free article] [PubMed] [Google Scholar]
- 19. Zheng F, Tang W, Li H, Huang YX, Xie YL, Zhou ZG. Clinical characteristics of 161 cases of corona virus disease 2019 (COVID‐19) in Changsha. Eur Rev Med Pharmacol Sci. 2020; 24(6):3404‐3410. [DOI] [PubMed] [Google Scholar]
- 20. Niu Y, Zhan Z, Li J, et al. Development of a predictive model for mortality in hospitalized patients with COVID‐19 [published online ahead of print, 2021 Jan 8]. Disaster Med Public Health Prep. 2021:1‐9. [DOI] [PMC free article] [PubMed] [Google Scholar]
- 21. Shah S, Shah K, Patel SB, et al. Elevated D‐Dimer levels are associated with increased risk of mortality in coronavirus disease 2019: a systematic review and meta‐analysis. Cardiol Rev. 2020;28(6):295‐302. [DOI] [PMC free article] [PubMed] [Google Scholar]
- 22. Soni M, Gopalakrishnan R, Vaishya R, Prabu P. D‐dimer level is a useful predictor for mortality in patients with COVID‐19: analysis of 483 cases. Diabetes Metab Syndr. 2020;14(6):2245‐2249. [DOI] [PMC free article] [PubMed] [Google Scholar]
- 23. Ozen M, Yilmaz A, Cakmak V, et al. D‐Dimer as a potential biomarker for disease severity in COVID‐19. Am J Emerg Med. 2021;40:55‐59. [DOI] [PMC free article] [PubMed] [Google Scholar]
- 24. Zhou C, Chen Y, Ji Y, He X, Xue D. Increased serum levels of hepcidin and ferritin are associated with severity of COVID‐19. Med Sci Monit. 2020;26:e926178. [DOI] [PMC free article] [PubMed] [Google Scholar]
- 25. Deng F, Zhang L, Lyu L, et al. Increased levels of ferritin on admission predicts intensive care unit mortality in patients with COVID‐19. Med Clin. 2021;156(7):324‐331. [DOI] [PMC free article] [PubMed] [Google Scholar]
Associated Data
This section collects any data citations, data availability statements, or supplementary materials included in this article.
Data Availability Statement
Due to the nature of this study, participants of this study did not agree for their data to be shared publicly, so supporting data is not available.