Abstract
The current study aimed at characterizing the dynamics of SARS‐CoV‐2 nucleocapsid (N) antigenemia in a cohort of critically ill adult COVID‐19 patients and assessing its potential association with plasma levels of biomarkers of clinical severity and mortality. Seventy‐three consecutive critically ill COVID‐19 patients (median age, 65 years) were recruited. Serial plasma (n = 340) specimens were collected. A lateral flow immunochromatography assay and reverse‐transcription polymerase chain reaction (RT‐PCR) were used for SARS‐CoV‐2 N protein detection and RNA quantitation and in plasma, respectively. Serum levels of inflammatory and tissue‐damage biomarkers in paired specimens were measured. SARS‐CoV‐RNA N‐antigenemia and viral RNAemia were documented in 40.1% and 35.6% of patients, respectively at a median of 9 days since symptoms onset. The level of agreement between the qualitative results returned by the N‐antigenemia assay and plasma RT‐PCR was moderate (k = 0.57; p < 0.0001). A trend towards higher SARS‐CoV‐2 RNA loads was seen in plasma specimens testing positive for N‐antigenemia assay than in those yielding negative results (p = 0.083). SARS‐CoV‐2 RNA load in tracheal aspirates was significantly higher (p < 0.001) in the presence of concomitant N‐antigenemia than in its absence. Significantly higher serum levels of ferritin, lactose dehydrogenase, C‐reactive protein, and D‐dimer were quantified in paired plasma SARS‐CoV‐2 N‐positive specimens than in those testing negative. Occurrence of SARS‐CoV‐2 N‐antigenemia was not associated with increased mortality in univariate logistic regression analysis (odds ratio, 1.29; 95% confidence interval, 0.49‐3.34; p = 0.59). In conclusion, SARS‐CoV‐2 N‐antigenemia detection is relatively common in ICU patients and appears to associate with increased serum levels of inflammation and tissue‐damage markers. Whether this virological parameter may behave as a biomarker of poor clinical outcome awaits further investigations.
Keywords: COVID‐19, inflammation biomarkers, mortality, SARS‐CoV‐2 N‐antigenemia, SARS‐CoV‐2 RNAemia
Highlights
SARS‐CoV‐2 N‐antigenemia occurs frequently in ICU patients.
SARS‐CoV‐2 N‐antigenemia occurs more frequently in ICU patients with viral RNAemia.
SARS‐CoV‐2 N‐antigenemia associates with high serum levels of inflammatory biomarkers.
1. INTRODUCTION
Severe COVID‐19 is a multisystem disease involving the lower respiratory tract (LRT) and extra‐pulmonary organs such as the liver, kidney, spleen, and central nervous system. 1 Following infection, SARS‐CoV‐2 initially replicates in the upper respiratory tract (URT) before reaching the LRT 2 , 3 where it may cause severe damage, by virtue of its own cytopathogenicity and notably by inducing a persistent, dysregulated proinflammatory state. 4 , 5 SARS‐CoV‐2 may access the systemic compartment early after infection. In fact, depending upon clinical severity, SARS‐CoV‐2 RNAemia can be detected in up to 88% of COVID‐19 patients within the first week after symptoms onset and has been associated with ICU admission, need for invasive mechanical ventilation, multiple organ failure, and mortality rate. 6 Likewise, SARS‐CoV‐2 nucleocapsid (N) antigenemia, which has also been found in a large percentage of COVID‐19 patients, 7 , 8 , 9 has been associated with higher ICU admission rates and overall mortality. 7 , 9 The current study aimed at further characterizing the dynamics of SARS‐CoV‐2 N‐antigenemia in a cohort of critically ill adult COVID‐19 patients and assessing its potential association with plasma levels of biomarkers of clinical severity and mortality. Studies of this nature may contribute to clarifying the pathogenesis of SARS‐CoV‐2 infection, as well as precisely identifying virological factors modulating COVID‐19 prognosis.
2. MATERIAL AND METHODS
2.1. Patients and specimens
In this prospective observational study, 73 consecutive critically ill COVID‐19 patients (51 males and 22 females; median age, 65 years; range, 21–80 years) were enrolled between October 2020 and February 2021 (Table 1). According to the Centers for Disease Control and Prevention (CDC) (https://www.covid19treatmentguidelines.nih.gov/management/critical-care), critical illness was defined by the presence of respiratory failure, septic shock, and/or multiple organ dysfunction. Plasma specimens were scheduled to be collected at least once a week from ICU admission, were obtained by centrifugation of whole blood ethylenediaminetetraacetic acid tubes, cryopreserved at −80°C and retrieved for analyses within 1 month after collection. Nonpreviously thawed specimens were used for analyses. Medical history and laboratory data were prospectively recorded. The current study was approved by the Ethics Committee of Hospital Clínico Universitario INCLIVA (May, 2020).
Table 1.
Baseline clinical characteristics of the study population at Intensive Care Unit admission
| Variable | No. (%) |
|---|---|
| Acute physiology and chronic health evaluation (APACHE) II score | |
| <10 | 14 (19.2) |
| 10–14 | 27 (37.0) |
| 15–29 | 32 (43.8) |
| Comorbidities | |
| Diabetes mellitus | 18 (24.7) |
| Asthma/chronic lung disease | 11 (15.0) |
| Hypertension | 33 (45.2) |
| Obesity | 38 (52.0) |
| Chronic heart disease | 9 (12.3) |
| Vascular disease | 7 (9.6) |
| Cancer | 3 (4.1) |
| Hematologic disease | 3 (4.1) |
| Number of comorbidity conditions | |
| One | 22 (30.1) |
| Two or more | 33 (45.2) |
| None | 18 (24.7) |
| Oxygenation and ventilator support | |
| Invasive mechanical ventilation | 64 (87.7) |
| PiO2/FiO2 < 150 mmHg | 58 (79.5) |
| Acute kidney disfunction | 17 (23.3) |
2.2. Detection of SARS‐CoV‐2 N protein in plasma
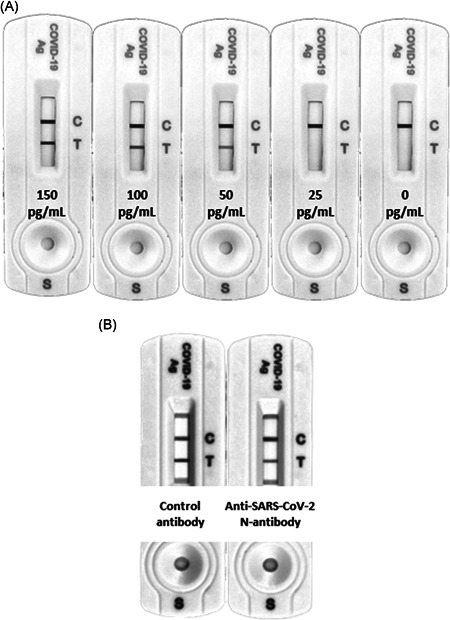
The CLINITEST Rapid COVID‐19 Antigen Test (Siemens, Healthineers), a lateral flow immunochromatography (LFIC) device licensed for detection of SARS‐CoV‐2 nucleocapsid protein nasopharyngeal specimens or nasal swabs, was used on plasma specimens. The limit of detection (LOD) of the assay in plasma was determined by spiking a prepandemic plasma pool testing negative by SARS‐CoV‐2 reverse‐transcription polymerase chain reaction (RT‐PCR) with 10, 25, 50, 100, and 150 pg/ml of a recombinant N protein (MT‐25C19NC, Certest Biotec S.L.). The LOD was found to be at least 50 pg/ml (Figure 1A). N‐antigen line intensity was scored visually using a 3‐level scale: 0, negative result; 1+, intensity of test band lower than control band, and 2+, intensity of test band equal or greater to control line (which roughly corresponded to less than 100 pg/ml and greater than or equal to 100 pg/ml, respectively) (Figure 1A).
Figure 1.

(A) Evaluation of the limit of detection of the CLINITEST Rapid COVID‐19 Antigen Test (Siemens, Healthineersy) for detection of the SARS‐CoV‐2 N protein in plasma specimens. A prepandemic plasma pool testing negative by RT‐PCR was spiked with 10, 25, 50, 100, and 150 pg/ml of a recombinant N protein (MT‐25C19NC, Certest Biotec S.L.). (B) Representative example of a depleting experiment demonstrating the true nature of SARS‐CoV‐2 N protein detected in plasma specimens with N‐antigenenia and testing negative for SARS‐CoV‐2 RNA by RT‐PCR. A a rabbit anti‐N protein antibody (40143‐R019; SinoBiological) was used for N protein depletion. An isotype‐matched rabbit antibody was employed as a control. RT‐PCR, reverse‐transcription polymerase chain reaction
Depleting experiments were conducted to confirm the true nature of SARS‐CoV‐2 N detected in a number of discordant plasma specimens (testing negative by RT‐PCR). Serum N protein depletion was achieved with an anti‐N protein antibody produced in rabbits (40143‐R019; SinoBiological). Two aliquots of 150 μl of COVID 19 positive serum were first incubated with 150 μl protein G agarose resin 4 rapid run (4RRPG; Agarose Bead Technologies) equilibrated in phosphate buffered solution (PBS) for 3 h at room temperature in batch mode for Immunoglobulin (IgG) depletion. Later, the mixtures were centrifuged for 10 min at 3000 g at 4°C and the supernatants were collected. Then, 10 μg of anti‐N protein antibody or rabbit IgG isotype (02‐6102; Invitrogen) used as control were added to respective tubes and incubated overnight at 4°C in an orbital shaker. The samples were incubated again with 150 μl protein G agarose resin 4 rapid run equilibrated in PBS for 3 h at room temperature in batch mode for specific IgG anti‐N depletion and then centrifuged for 10 min at 3000 g at 4°C and the supernatants were collected. Sera were then analyzed for N protein presence with Clinitest Rapid Covid‐19 Antigen test (Siemens Healthineers), 150 μl of each serum were diluted 1:1 with extraction buffer, incubated for one minute at room temperature and 100 μl of each dilution were applied to the sample well of the lateral flow immunoassay. After 15 min the results were analyzed in an Amersham Imager 680 UV (Ge Healthcare) with the software ImageQuant TL 8.2 (Ge Healthcare).
2.3. Detection of SARS‐CoV‐2 RNA in plasma and tracheal aspirates by RT‐PCR
Nucleic acid extraction was performed using a magnetic microparticle‐based protocol (Abbott mSample Preparation SystemDNA; Abbott Molecular) on the Abbott m2000sp platform (Abbott Molecular) with a starting sample volume of 400 µl of plasma or tracheal aspirates (TA) from mechanically ventilated patients which were collected undiluted in sterile containers. TA were kept at 4°C until processed (within 6 h of receipt). SARS‐CoV‐2 RNA amplification was carried out by the Abbott RealTime SARS‐CoV‐2 assay, a dual‐target RT‐PCR assay amplifying the RdRp and N‐genes, on the m2000rt platform, following the manufacturer's instructions. The LOD was found to be approximately 100 copies/ml (95% confidence interval [CI]). 10 SARS‐CoV‐2 viral loads in plasma and TA are given in copies/ml throughout the study, as estimated using the AMPLIRUN TOTAL SARS‐CoV‐2 RNA Control (Vircell SA).
2.4. Laboratory measurements
Clinical laboratory tests included serum levels of ferritin, D‐Dimer (D‐D), C reactive protein (CRP), interleukin‐6 (IL‐6), lactate dehydrogenase (LDH), and absolute lymphocyte counts. Serum biomarkers were monitored as per local ICU clinical guidelines.
2.5. Statistical methods
Frequency comparisons for categorical variables were carried out using Fisher's exact test. Differences between medians were compared using the Mann–Whitney U test. Two‐sided exact p values were reported. A p < 0.05 was considered statistically significant. The level of agreement between qualitative results provided by paired virological assays was assessed using Kappa–Cohen statistics. Logistic regression analyses were performed to assess risk factors for all‐cause mortality. The analyses were performed using SPSS version 20.0 (SPSS).
3. RESULTS
3.1. Patient clinical features
Patients were admitted to ICU at a median of 9 days (range, 2–25) after the onset of symptoms. All patients presented with pneumonia and imaging findings compatible with COVID‐19 on chest‐X‐ray or CT‐scan, and most eventually needed mechanical ventilation (87.7%). The median time of ICU stay was 18 days (range, 2–67).
3.2. Detection of SARS‐CoV‐2 N‐antigenemia
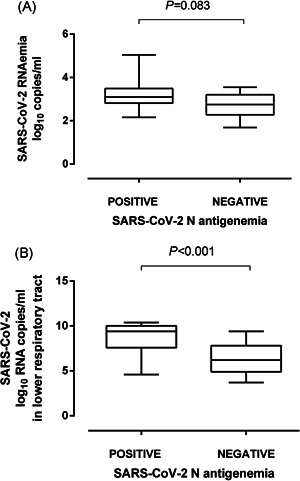
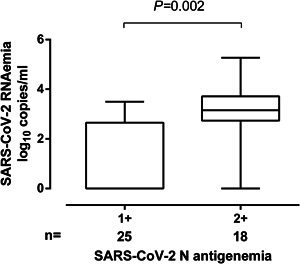
A total of 340 plasma specimens from 73 patients (median, 4 samples/patient; range, 1–16) were available for analytical determinations. SARS‐CoV‐2 N‐antigenemia was detected in 43 samples from 30 patients (41.0%). The median time to first N‐antigenemia detection was 9 days after onset of symptoms (range, 3–29 days). No patient had N‐antigenemia beyond day 32 after symptoms onset. SARS‐CoV‐2 RNAemia could be detected in 37 plasma specimens from 26 patients (35.6%) and its kinetics was similar to that of N‐antigenemia. 10 There were 30 specimens yielding discordant results (N‐antigenemia positive/RNAemia negative, n = 18, and N‐antigenemia negative/RNAemia positive, n = 12); Thus, the level of agreement between the qualitative results returned by the N‐antigenemia assay and plasma RT‐PCR was moderate (k = 0.57; p < 0.0001). A trend towards higher SARS‐CoV‐2 RNA loads was seen in plasma specimens testing positive for N‐antigenemia assay than in those yielding negative results (3.1 log10 vs. 2.7 log10 copies/ml; p = 0.083) (Figure 2A). Moreover, as shown in Figure 3, specimens yielding strong reactivity on the N‐antigen assay (2+) had significantly higher SARS‐CoV‐2 RNA loads (p = 0.002) than those yielding weak reactivity (1+).
Figure 2.

Box‐plot depicting SARS‐CoV‐2 RNA load (in copies/ml) in plasma (A) and tracheal aspirates (B) from critically ill patients in the presence or absence of SARS‐CoV‐2 N protein. p‐value for comparison is shown
Figure 3.

Box‐plot depicting SARS‐CoV‐2 RNA load (in copies/ml) in plasma from critically ill patients according to the intensity of the N‐antigen line (1+ vs. 2+) on the CLINITEST Rapid COVID‐19 Antigen test. p value for comparison is shown
One plasma specimen yielding discordant results (positive RT‐PCR and negative N‐antigen assay) was subjected to N depletion as detailed above. As shown in Figure 1B, treatment of plasma with anti‐N protein antibody reduced the test line intensity by 54% compared with that obtained with the rabbit isotype control.
A total of 16 and 27 patients were under remdesivir and tocilizumab treatment, respectively, at ICU admission. The rate of positive SARS‐CoV‐2 N‐antigenemia was comparable for treated and untreated patients (p = 0.58 for remdesivir and p = 0.41, for tocilizumab).
A total of 61 patients had one or more TA collected (total number, 165; median of 2 specimens/patient; range, 1–11) within the study period. As previously reported, 10 SARS‐CoV‐2 RNA load in TA ranged between 3.03 and 10.6 log10 copies/ml (median, 6.5 log10 copies/ml). SARS‐CoV‐2 RNA load in TA was significantly higher (p < 0.001) in the presence of concomitant N‐antigenemia than in its absence (Figure 2B).
3.3. Relationship between n‐antigenemia and plasma levels of inflammatory or tissue‐damage biomarkers and absolute lymphocyte counts
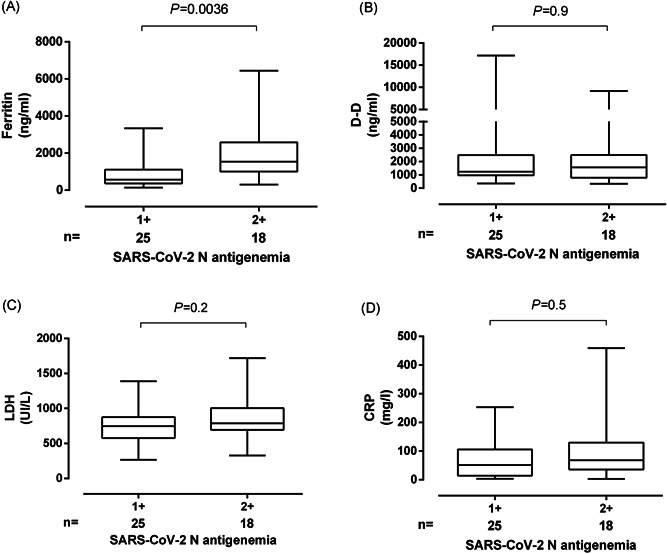
Significantly higher serum levels of ferritin, LDH, CRP, and D‐D were measured in paired SARS‐CoV‐2 N‐positive specimens than in those testing negative (Table 2). In contrast, plasma levels of IL‐6 were comparable across groups. Lymphocyte counts were significantly lower in the presence of SARS‐CoV‐2 N antigen in plasma than in its absence (Table 2). Median serum levels of the above biomarkers tended to be higher when paired plasma specimens yielded stronger N‐antigen reactivity (2+ vs. 1+), yet the difference was only significantly different for ferritin (Figure 4).
Table 2.
SARS‐CoV‐2 N‐antigenemia and plasma level COVID‐19 severity biomarkers
| Qualitative result | No. of paired specimens | Parameter; median (range) | p value | ||
|---|---|---|---|---|---|
| SARS‐CoV‐2 N‐antigenemia | Pos | 14 | IL‐6 in pg/ml | 105.8 (4–3548) | 0.69 |
| Neg | 35 | 148.6 (4.7–3437) | |||
| Pos | 34 | Ferritin in ng/ml | 971.5 (147–6440) | 0.03 | |
| Neg | 208 | 599 (42–5847) | |||
| Pos | 41 | D‐D in ng/ml | 1350 (320–18,870) | 0.03 | |
| Neg | 269 | 1760 (270–60,000) | |||
| Pos | 43 | LDH in UI/l | 748 (214–1720) | 0.002 | |
| Neg | 274 | 632.5 (58–2132) | |||
| Pos | 42 | CRP in mg/l | 61.55 (1–459) | 0.01 | |
| Neg | 293 | 29.9 (1–746) | |||
| Pos | 27 | Lymphocytes in cell/µl | 0.83 (0.02–1.65) | 0.001 | |
| Neg | 208 | 1.12 (0.17–3.73) | |||
Abbreviations: CRP, C‐reactive protein; D‐D, Dimer‐D; IL‐6, interleukin‐6; LDH, lactate dehydrogenase.
Figure 4.

Box‐plot depicting serum levels of (A) ferritin, (B) D‐Dimer, (C) LDH, and (D) C‐reactive protein (CRP) from critically ill patients according to the intensity of the N‐antigen line (1+ vs. 2+) on the CLINITEST Rapid COVID‐19 Antigen test. P‐value for comparison is shown. LDH, lactate dehydrogenase
3.4. SARS‐CoV‐2 antigenemia and mortality
A total of 29 patients died, at a median of 22 days (range, 7–66) after ICU admission, of whom 13 had N‐antigenemia at some time point during ICU stay. Among the 44 survivors, 17 had N‐antigenemia. Occurrence of SARS‐CoV‐2 N‐antigenemia was not associated with increased mortality in univariate logistic regression analysis (odds ratio, 1.29; 95% CI, 0.49–3.34; p = 0.59).
4. DISCUSSION
Here, we investigated the dynamics of SARS‐CoV‐2 N‐antigenemia in a relatively homogeneous cohort of ICU patients with severe pneumonia, most of whom underwent mechanical ventilation, by means of LFIC with an analytical sensitivity of around 50 pg/ml. In contrast to previous studies, serial specimens from patients rather than a single one drawn at hospital admission were analyzed. SARS‐CoV‐2 N‐antigenemia was detected in 41.0% of patients and was cleared before day 33 after ICU admission, those exhibiting higher plasma viral RNA loads being more likely to test positive, as previously noticed, 8 and yielding stronger N‐antigen line reactivities. This concurs with the figure (49%) reported in a previous study 9 also using LFIC (Panbio COVID‐19 Ag Rapid Test Device from Abbott), but is much lower than the proportion found by Hingrat et al. 8 employing an ultrasensitive immunoassay (limit of detection of 2.8 pg/ml). We did not measure serum antibodies against SARS‐CoV‐2, which may impact the rate of N‐antigenemia detection, 9 and precludes certainty concerning the comparability of our data with those reported in the other studies. 8 , 9 Interestingly, in line with a previous report, 8 N‐antigenemia had a higher detection rate than viral RNAemia; as depletion experiments proved the true nature of the N protein detected in discordant specimens, we favor the idea that this phenomenon could be explained by the fact that N protein is likely less prone to degradation than RNA in cryopreserved‐thawed specimens. Given that detection of SARS‐CoV‐2 RNA in blood has not been associated with the infectious virus, 11 we speculate that free RNA and soluble N protein, probably leaking from the lower respiratory tract (and perhaps from other tissue sources), are the main biological forms of SARS‐CoV‐2 present in plasma.
A novel observation was that, as previously shown for SARS‐CoV‐2 RNAemia, 10 the presence of N‐antigenemia was significantly associated with high viral loads in the lower respiratory tract.
Interestingly, neither treatment with remdesivir nor with tocilizumab appeared to have a major impact on the rate of SARS‐CoV‐2 N‐antigenemia detection. This is in line with previous studies showing that neither of these drugs had a tangible effect on SARS‐CoV‐2 RNA load in the upper airways even when given early after symptoms onset. 12 , 13
We provide for the first time some evidence linking the presence of SARS‐CoV‐2 N‐antigenemia with increased levels of inflammation or tissue damage biomarkers including ferritin, CRP, D‐D, and LDH, and decreased absolute lymphocyte counts. Moreover, the level of N‐antigenemia, as inferred by the intensity of the N‐antigen line reactivity on the LFIC device, appeared to be higher in the presence of high levels of these biomarkers, although statistical significance was only reached for ferritin. In line with this finding, previous studies reported a significant association between the presence of SARS‐CoV‐2 in the blood (viral RNAemia) and blood levels of IL‐6 14 or several cytokines and chemokines, such as IL‐6, IL‐10, C‐reactive protein, ferritin, D‐D, and LDH. 15 Unfortunately, serum IL‐6 levels were not available in a large percentage of patients of the current cohort.
SARS‐CoV‐2 N‐antigenemia at hospital admission has been independently associated with disease progression in mixed cohorts of COVID‐19 patients with severe disease 7 and independently associated with increased 30‐day overall mortality in a series including only ICU patients. 9 Nevertheless, we found no evidence of an association between detection of N‐antigenemia and mortality rate. Reasons for this discrepancy are unclear, but may be linked to differences in baseline characteristics of patients and clinical and therapeutic management of COVID‐19 across centers; It may also be related to different sample collection timing across the studies.
The main limitations of the current study are the relatively small sample size and the use of an analytical semiquantitative method which may have underestimated the N‐antigenemia detection rate. Analysis of sequential specimens from patients could be considered a strength of the research.
In conclusion, SARS‐CoV‐2 N‐antigenemia detection is relatively common in ICU patients and appears to associate with increased plasma levels of inflammation and tissue‐damage markers. Whether this virological parameter may behave as a biomarker of poor clinical outcome awaits data from larger and well‐powered studies.
CONFLICT OF INTERESTS
The authors declare that there are no conflict of interests.
AUTHOR CONTRIBUTIONS
Beatriz Olea, Eliseo Albert, Ignacio Torres, Roberto Gozalbo‐Rovira, Rosa Costa, Javier Colomina and Jesús Rodríguez: Methodology and validation of data. Nieves Carbonell, José Ferreres and María Luisa Blasco: Medical care of ICU patients. David Navarro: Conceptualization, supervision, writing the original draft. All authors reviewed the original draft.
ACKNOWLEDGMENTS
We are grateful to all personnel who work at Clinic University Hospital, in particular to those at the Microbiology laboratory and the Intensive Care Unit for their commitment to the fight against COVID‐19. Eliseo Albert holds a Juan Rodés Contract (JR20/00011) from the Health Institute Carlos III. Ignacio Torres holds a Río Hortega Contract (CM20/00090) the Health Institute Carlos III. We thank Siemens Healthineers (Erlangen, Germany) for providing reagents free of charge.
Olea B, Albert E, Torres I, et al. SARS‐CoV‐2 N‐antigenemia in critically ill adult COVID‐19 patients: Frequency and association with inflammatory and tissue‐damage biomarkers. J Med Virol. 2021;94:222‐228. 10.1002/jmv.27300
[Correction added on 15 September 2021, after first online publication: Figure 1 has been replaced and author name, Jesús Rodríguez, has been corrected to read Jesús Rodríguez‐Díaz.]
DATA AVAILABILITY STATEMENT
The data presented in the manuscript have not been made available, but can be shared upon request.
REFERENCES
- 1. Berlin DA, Gulick RM, Martinez FJ. Severe Covid‐19. N Engl J Med. 2020;383:2451‐2460. [DOI] [PubMed] [Google Scholar]
- 2. Zheng S, Fan J, Yu F, et al. Viral load dynamics and disease severity in patients infected with SARS‐CoV‐2 in Zhejiang province, China, January‐March 2020: retrospective cohort study. BMJ. 2020;369:m1443. [DOI] [PMC free article] [PubMed] [Google Scholar]
- 3. Cevik M, Tate M, Lloyd O, et al. SARS‐CoV‐2, SARS‐CoV, and MERS‐CoV viral load dynamics, duration of viral shedding, and infectiousness: a systematic review and meta‐analysis. Lancet Microbe. 2021;2:e13‐e22. [DOI] [PMC free article] [PubMed] [Google Scholar]
- 4. Fajgenbaum DC, June CH. Cytokine storm. N Engl J Med. 2020;383:2255‐2273. [DOI] [PMC free article] [PubMed] [Google Scholar]
- 5. Leisman DE, Ronner L, Pinotti R, et al. Cytokine elevation in severe and critical COVID‐19: a rapid systematic review, meta‐analysis, and comparison with other inflammatory syndromes. Lancet Respir Med. 2020;8:1233‐1244. [DOI] [PMC free article] [PubMed] [Google Scholar]
- 6. Tang K, Wu L, Luo Y, Gong B. Quantitative assessment of SARS‐CoV‐2 RNAemia and outcome in patients with coronavirus disease 2019. J Med Virol. 2021;93:3165‐3175. [DOI] [PMC free article] [PubMed] [Google Scholar]
- 7. Ogata AF, Maley AM, Wu C, et al. Ultrasensitive serial profiling of SARS‐CoV‐2 antigens and antibodies in plasma to understand disease progression in COVID‐19 patients with severe disease. Clin Chem. 2020;66:1562e72. [DOI] [PMC free article] [PubMed] [Google Scholar]
- 8. Hingrat QL, Visseaux B, Laouenan C, et al. Detection of SARS‐CoV‐2 N‐antigen in blood during acute COVID‐19 provides a sensitive new marker and new testing alternatives. Clin Microbiol Infect. 2020;S1198‐743X(20):30721‐30727. [DOI] [PMC free article] [PubMed] [Google Scholar]
- 9. Martin‐Vicente M, Almansa R, Martínez I, Tedim AP, Bustamante E, Tamayo L. Absent or insufficient anti‐SARS‐CoV‐2 S antibodies at ICU admission are associated to higher viral loads in plasma, antigenemia and mortality in COVID‐19 patients. medRxiv. 2021. 10.1101/2021.03.08.21253121 [DOI] [Google Scholar]
- 10. Olea B, Albert E, Torres I, et al. Lower respiratory tract and plasma SARS‐CoV‐2 RNA load in critically ill adult COVID‐19 patients: relationship with biomarkers of disease severity. J Infect. 2021;83. [DOI] [PMC free article] [PubMed] [Google Scholar]
- 11. Andersson MI, Arancibia‐Carcamo CV, Auckland K, et al. SARS‐CoV‐2 RNA detected in blood products from patients with COVID‐19 is not associated with infectious virus. Wellcome Open Res. 2020;5:181. [DOI] [PMC free article] [PubMed] [Google Scholar]
- 12. Masiá M, Fernández‐González M, Padilla S, et al. Impact of interleukin‐6 blockade with tocilizumab on SARS‐CoV‐2 viral kinetics and antibody responses in patients with COVID‐19: a prospective cohort study. EBioMedicine. 2020;60:10299. [DOI] [PMC free article] [PubMed] [Google Scholar]
- 13. Bitker L, Dhelft F, Chauvelot L, et al. Protracted viral shedding and viral load are associated with ICU mortality in Covid‐19 patients with acute respiratory failure. Ann Intensive Care. 2020;10:167. [DOI] [PMC free article] [PubMed] [Google Scholar]
- 14. Chen X, Zhao B, Qu Y, et al. Detectable serum SARS‐CoV‐2 viral load (RNAaemia) is closely correlated with drastically elevated interleukin 6 (IL‐6) level in critically ill COVID‐19 patients. Clin Infect Dis. 2020;71:1937‐1942. [DOI] [PMC free article] [PubMed] [Google Scholar]
- 15. Bermejo‐Martin JF, González‐Rivera M, Almansa R, et al. Viral RNA load in plasma is associated with critical illness and a dysregulated host response in COVID‐19. Crit Care. 2020;24:691. [DOI] [PMC free article] [PubMed] [Google Scholar]
Associated Data
This section collects any data citations, data availability statements, or supplementary materials included in this article.
Data Availability Statement
The data presented in the manuscript have not been made available, but can be shared upon request.


