

Abstract
Purpose.
The objective of this study was to develop a computational fluid dynamics (CFD) model to predict the deposition, dissolution, clearance, and absorption of pharmaceutical particles in the human nasal cavity.
Methods.
A three-dimensional nasal cavity geometry was converted to a surface-based model, providing an anatomically-accurate domain for the simulations. Particle deposition data from a commercial nasal spray product was mapped onto the surface model, and a mucus velocity field was calculated and validated with in vivo nasal clearance rates. A submodel for the dissolution of deposited particles was developed and validated based on comparisons to existing in vitro data for multiple pharmaceutical products. A parametric study was then performed to assess sensitivity of epithelial drug uptake to model conditions and assumptions.
Results.
The particle displacement distance (depth) in the mucus layer had a modest effect on overall drug absorption, while the mucociliary clearance rate was found to be primarily responsible for drug uptake over the timescale of nasal clearance for the corticosteroid mometasone furoate (MF). The model revealed that drug deposition in the nasal vestibule (NV) could slowly be transported into the main passage (MP) and then absorbed through connection of the liquid layer in the NV and MP regions. As a result, high intersubject variability in cumulative uptake was predicted depending on the length of time the NV dose was left undisturbed without blowing or wiping the nose.
Conclusions.
This study has developed, for the first time, a complete CFD model of nasal aerosol delivery from the point of spray formation through absorption at the respiratory epithelial surface. For the development and assessment of nasal aerosol products, this CFD-based in silico model provides a new option to complement existing in vitro nasal cast studies of deposition and in vivo imaging experiments of clearance.
Keywords: Nasal spray suspensions, drug particle dissolution, nasal clearance, nasal drug absorption, post-deposition particle tracking, dosimetry modeling, microdosimetry
INTRODUCTION
Nasal drug delivery is a rapidly growing area of research, and may be particularly beneficial for drugs that require rapid administration but have a delayed onset of action. The nasal mucosa offers a richly vascularized site for drug absorption, providing an effective target for treating localized nasal conditions (e.g. allergic rhinitis)1 or quickly delivering drugs to the systemic circulation.1–3 Additionally, the nasal route may mitigate unwanted side effects or first-pass metabolism of drugs that are traditionally taken orally.1–5 Vaccines, which typically require injection delivery, may also be administered intranasally, providing a needle-free delivery alternative and a potential improvement in efficacy.1 Considering these applications and potential advantages, the delivery of drugs through the nasal mucosa appears to be a promising area of current and future research.
Despite recent advancements, the effective administration of drugs through the nasal route still poses many challenges. First, studies show poor deposition in the posterior region of the nasal cavity where the vascularized epithelium is located.6–10 Additionally, drug particles that are deposited on the respiratory epithelium are quickly cleared by mucociliary movement, thus limiting the available time for absorption.11–14 Some pharmaceutical molecules that are either very large or insoluble in mucus show limited dissolution and absorption in the nasal cavity, reducing their availability via this route.1,2,4,5 When treating localized conditions such as sinusitis, it is essential for the drug to reach the local site of action (i.e. the sinuses or inflamed tissue); however, current delivery methods perform poorly in targeting these hard to reach locations.7 Because of these factors, multiple research pathways are considering how to optimize the delivery and absorption of nasally administered drugs.3–5,15–19
Several studies have investigated nasal drug deposition from spray pumps using both computational8,9,20–23 and in vitro10,24–27 methods. However, these models do not consider the effects of mucociliary clearance or the dissolution and absorption of drugs in the nasal mucus lining. Some groups have evaluated the absorption of gases in the upper airways, providing uptake rates for various types of pollutant compounds.28–32 Still, no computational studies have simulated the behavior of soluble drug particles after they deposit in nasal mucus lining, which is crucial in understanding how particle size and deposition patterns affect absorption rates.
Depending on the required drug formulation, nasal sprays can be delivered either as a homogeneous solution or a heterogeneous suspension. Most nasal deposition and clearance studies have involved solutions, where the active ingredient is already dissolved and incorporated into a liquid mixture.6,33,34 However, most current commercial nasal sprays are formulated as suspensions, where solid drug particles are dispersed within the carrier liquid.27 While calculating drug absorption from a solution is much simpler, simulating the uptake of a suspension formulation requires assessing the deposition of the carrier spray droplets, the subsequent dissolution of the suspended solid particles, and finally the absorption of the dissolved drug, all while mucociliary clearance is occurring. The current study seeks to develop a computational fluid dynamics (CFD) based model of nasal spray drug delivery from the point of aerosol formation through epithelial absorption. An emphasis is placed on what happens to the suspended drug particles after deposition occurs, which is critical to understanding the dosimetry of nasal spray products.
Several approaches are currently being utilized to better model respiratory dosimetry through absorption of either inhaled medications or inhaled pollutants. CFD models of nasal spray drug delivery are currently well developed and show good agreement with in vitro depositional data, but stop at the point of nasal spray droplet deposition.8,9,20–23,35,36 For compounds that dissolve slowly or are not rapidly absorbed, the local deposition is only the starting point of the full dosimetry prediction. Other computational studies have utilized custom CFD boundary conditions to model pollutant vapor absorption in the respiratory airways;29,31 however, these types of models are unable to account for the discrete particle clearance and dissolution that occurs with suspension based pharmaceutical delivery. Pharmacokinetic (PK) modeling is able to quantify blood plasma concentrations of delivered pharmaceutical products,37 but often neglects the localized deposition, dissolution, and absorption related factors that affect localized uptake profiles. To thoroughly investigate drug uptake in the nasal cavity from a suspension spray formulation, a CFD model is needed that simulates post-deposition particle transport, dissolution in the mucus layer, and absorption at the epithelium. By obtaining both cumulative and localized drug uptake profiles, the variables associated with nasal spray suspension delivery may be better analyzed and optimized.
The objective of this study is to develop a computational model to predict the deposition, dissolution, clearance, and absorption of pharmaceutical particles from a spray suspension product in the human nasal cavity. The model starts at the point of spray aerosol formation and predicts drug fate through the point of nasal epithelial cell absorption or clearance from the nasal cavity. To ensure that aerosol transport and deposition of the nasal spray product are correctly simulated, comparisons are made with in vitro data under identical conditions, with and without inspiratory flow.38 After particle deposition, separate experiments were selected to isolate and validate mucociliary clearance and drug dissolution predictions. Accuracy of the model’s clearance rate predictions are assessed through comparisons with existing in vivo data of a radiotracer that is not absorbed by the respiratory epithelium.27 Predictions of suspension particle dissolution in mucus are validated based on comparisons to existing in vitro dissolution chamber experiments.39 As a result of these comparisons, the model is capable of predicting both dilute drug dissolution rate and dissolution rate limitations associated with limited available airway surface liquid and solubility. An assessment is then made regarding the sensitivity of model input parameters including representative particle number, particle depth in mucus, mucus velocity, and time before nose wiping or blowing. The resulting CFD-based model provides a new approach to assess the dosimetry of nasal spray products that goes significantly beyond the existing CFD estimates of initial deposition and can potentially complement or, in some cases, replace in vivo imaging studies.
MATERIALS AND METHODS
Overview
The overall methodology of the modeling approach is illustrated in Figure 1 and includes simulations of spray aerosol transport in an anatomically accurate nasal airway model, initial deposition of the spray droplets containing the suspended drug particles on the mucus surface, translation of the CFD-predicted deposition profile to a surface-based clearance model, and post-deposition transport of the suspended drug particles. Simulations of the suspended particles include dissolution, diffusion of the dissolved drug, evolution of the drug concentration profile, and absorption at the epithelial surface during mucociliary clearance. The premise behind the model is that (i) initial deposition locations affect the eventual fate of suspended drug particles and (ii) the complexity of post-deposition transport is best addressed by an additional clearance model with spatial and temporal resolutions of drug concentration profiles. The approach taken first simulates aerosol spray transport through deposition using a 3D CFD model (Figure 1a). The surface of the nasal airways and deposited particle locations were then translated to a surface-based model (Figure 1b). Simulation of mucus transport on a 3D model of the highly complex nasal anatomy was viewed as neither practical nor necessary. In contrast, a surface model allowed for practical mesh construction of the airway surface liquid (ASL) region, which is approximately 10 μm thick,40 over the entire nasal surface area (~160 cm2).4 The surface model captures regions of mucus acceleration and deceleration based on cross-sectional perimeter and an assumption of constant ASL height. CFD-based simulations within the ASL then capture both mucus motion and the post-deposition transport physics of the drug particles over both time and space (Figure 1c). Descriptions of the individual model components as well as selected experimental studies for model validation are described in the following sections.
Figure 1.
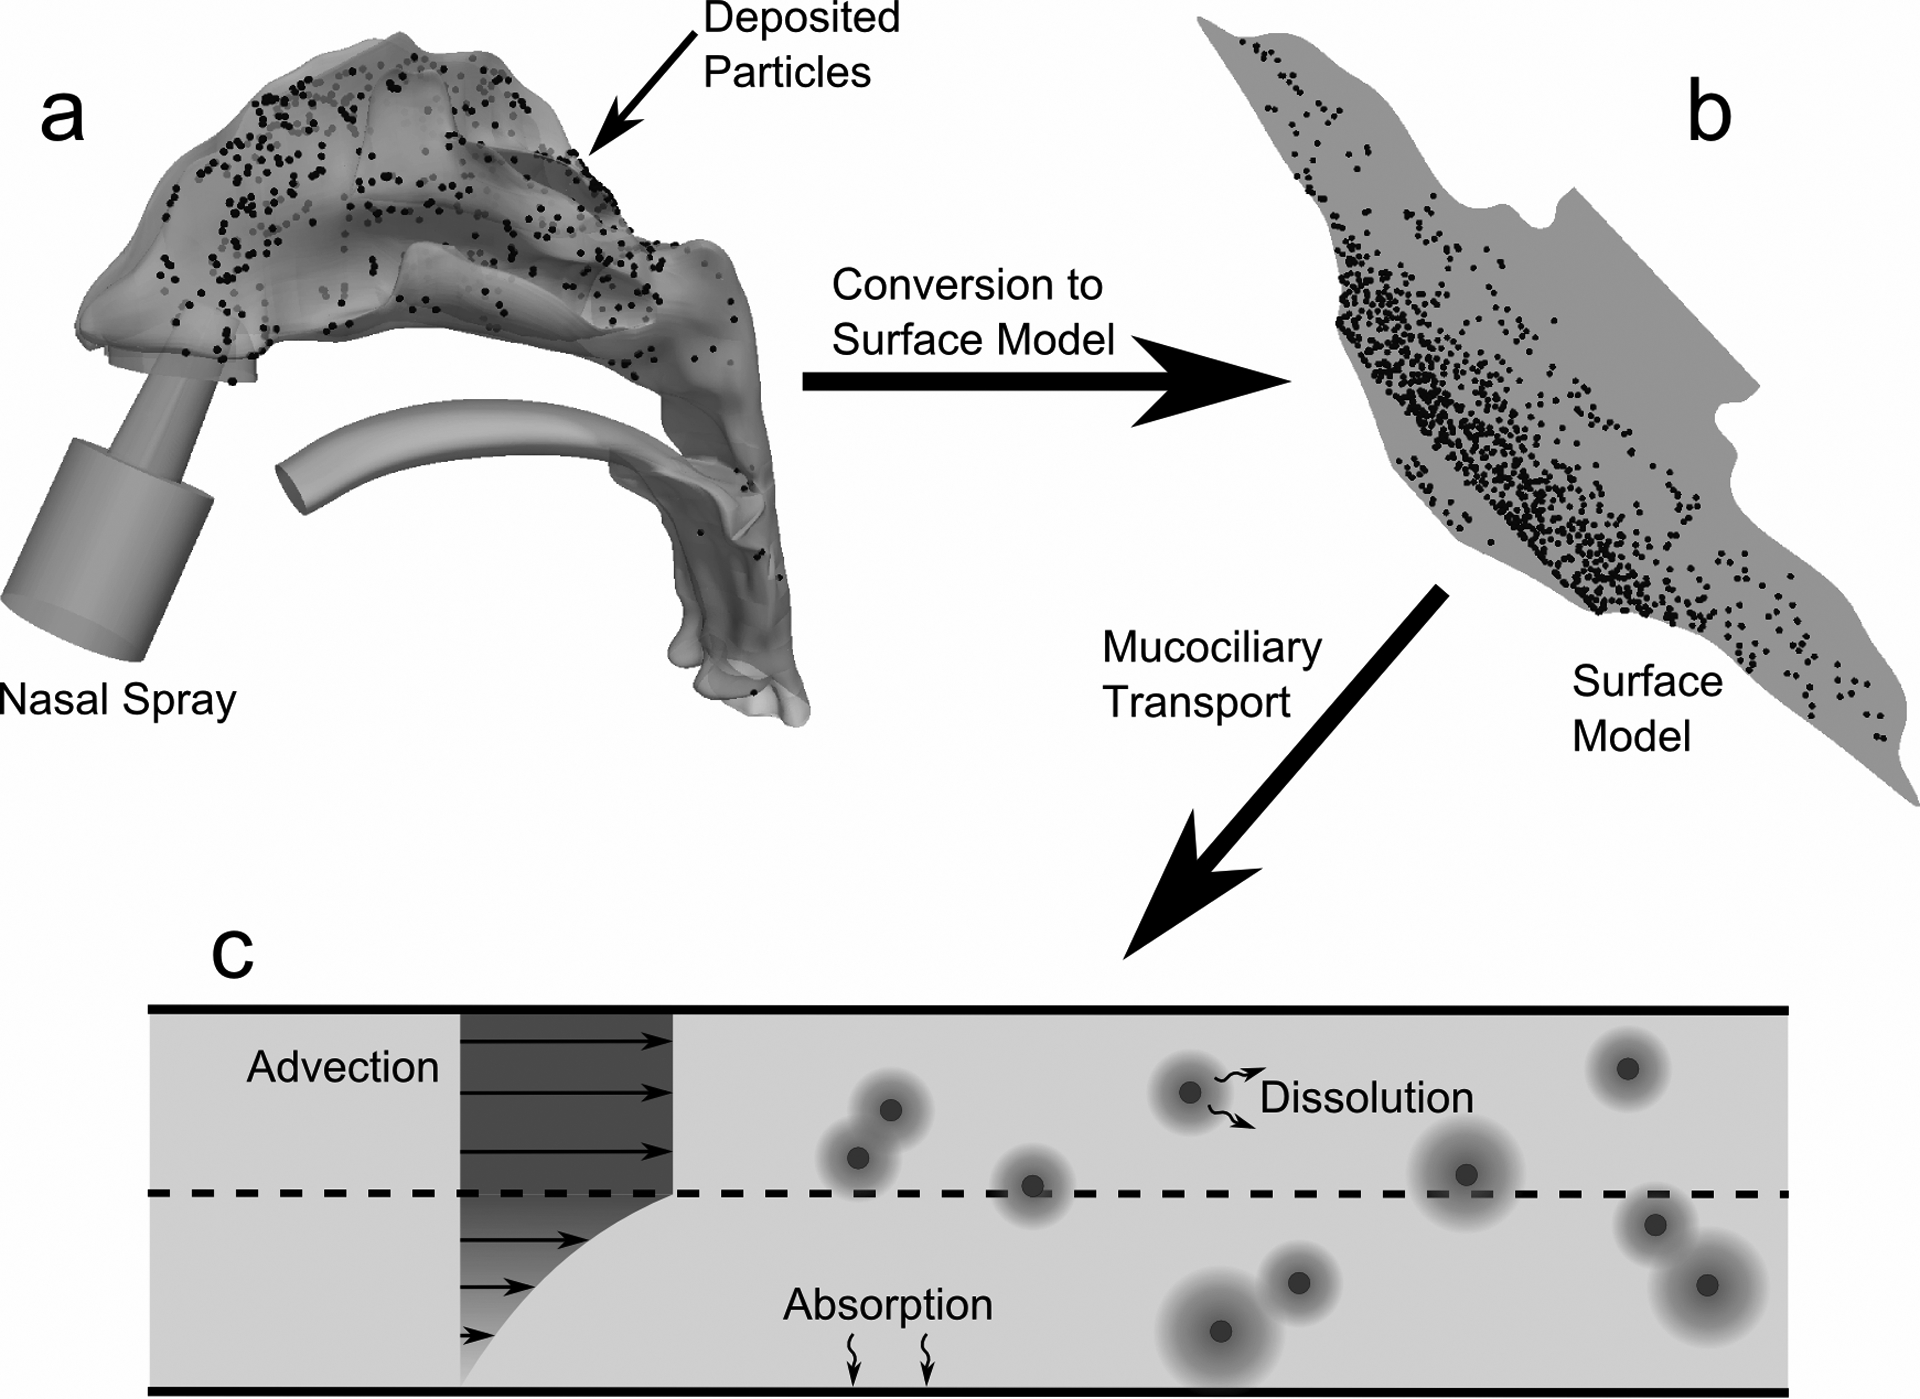
The overall methodology for creating the CFD clearance model is shown. Particle deposition data in the (a) 3D model of the nose from a commercial nasal spray was mapped onto the (b) surface-based model. CFD simulations were run using this model and accounted for (c) particle advection due to mucociliary clearance, particle dissolution and diffusion, and drug absorption at the epithelial surface.
As a representative popular nasal spray suspension formulation, mometasone furoate (MF) was selected. Mometasone furoate is a corticosteroid frequently prescribed to treat allergic rhinitis, acute rhinosinusitis, and nasal polyps.41 A MF spray suspension was recently considered by Azimi et al.38 in an in vitro system to assess nasal deposition patterns with and without inhalation, and to develop a standardized method for regulating new and generic nasal sprays. This corticosteroid is expected to have concentration limited dissolution in the nasal ASL, making its spatial deposition and clearance critical in determining local bioavailability.
3D Spray Pump and NMT Model
The three-dimensional nose-mouth-throat (NMT) geometry used in CFD simulations was derived from the dataset of Guilmette et al.42 and developed by Xi and Longest.43 This NMT geometry has frequently been used in in vitro24,25,44,45 and CFD simulations.20,22,36,44,46,47 A nasal spray pump (Nasonex®, Merck & Co., Summit, NJ) was added to the geometry and inserted at an angle of 30 degrees from vertical, as described by Position 1 in Azimi et al.38 and shown in Figure 2.
Figure 2.
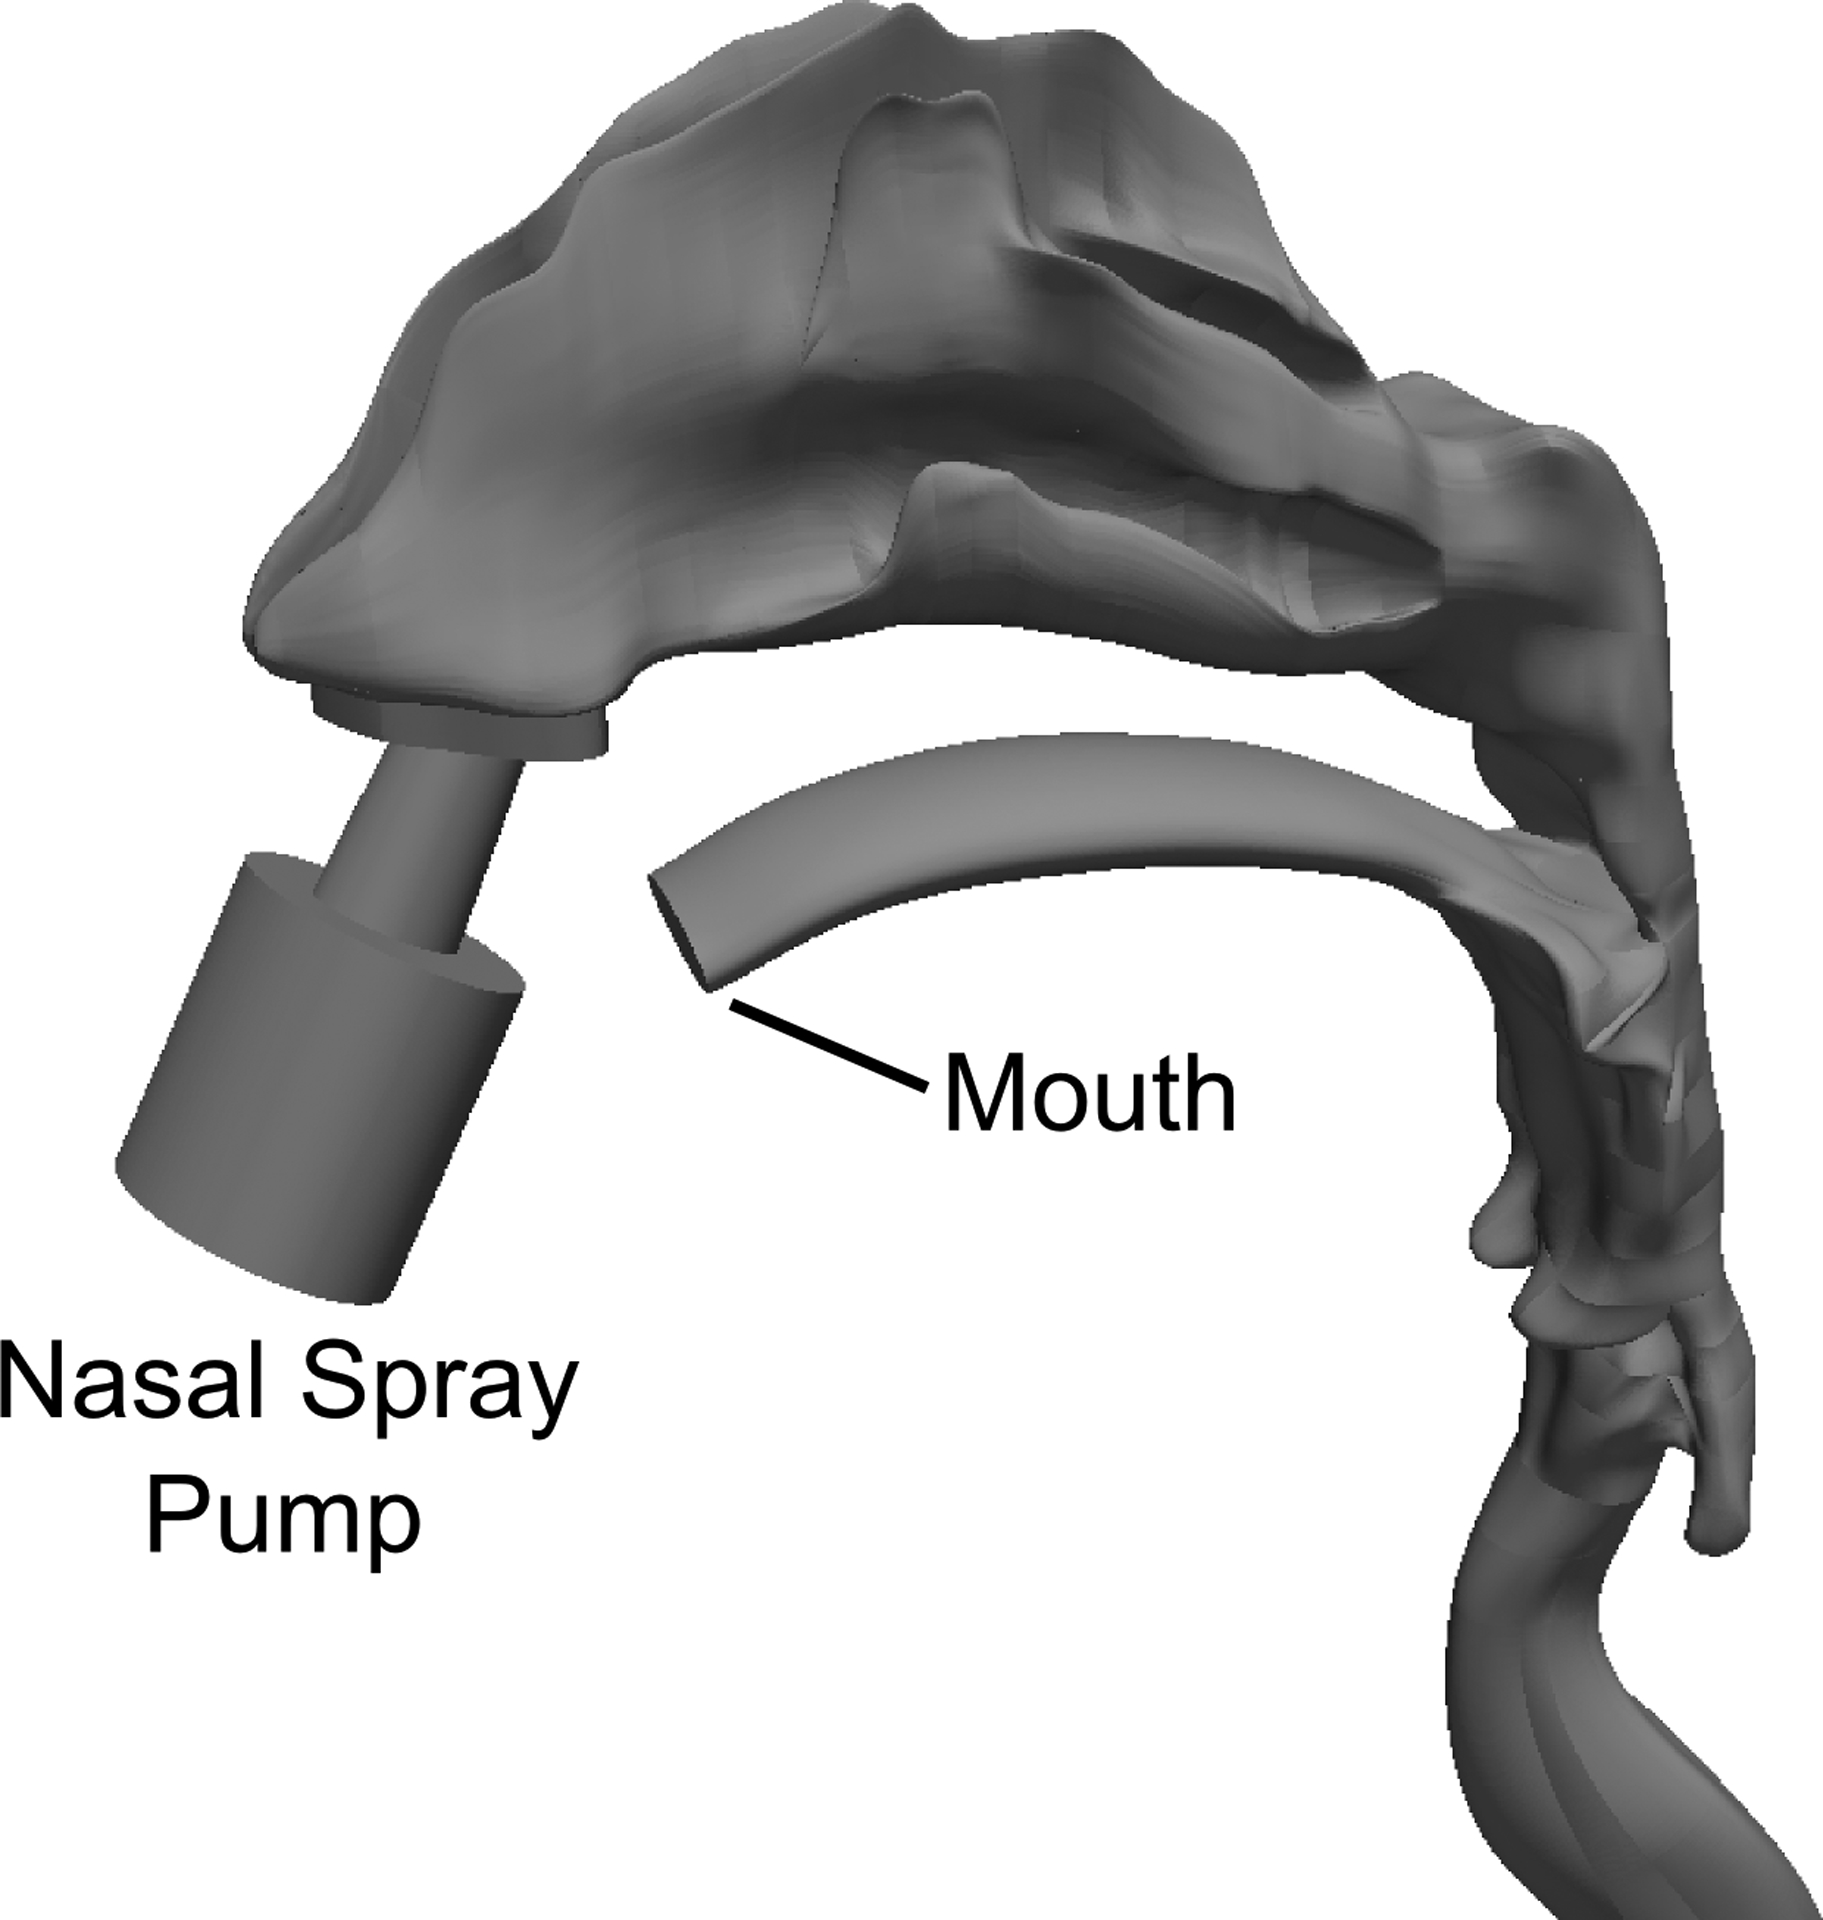
The 3D nose-mouth-throat (NMT) geometry is shown, with a nasal spray pump inserted into the left nostril at a 30 degree tilt from vertical.
A computational mesh was created using ICEM CFD 15.0.7 (ANSYS Inc., Canonsburg, PA) that contained approximately 3 million computational cells and seven refined prism layers at the boundaries to capture large near-wall velocity gradients. This mesh density is in agreement with that used by Walenga et al.47, who conducted a grid refinement study using the same nasal geometry and found this resolution to be sufficient in capturing necessary flow field features and particle transport phenomena. Combined with comparisons to in vitro data to validate accuracy (presented in the Results section), the current computational mesh for calculating spray droplet transport was deemed to be of sufficient quality and resolution.
Surface Model for the Post-Deposition Prediction of Clearance, Dissolution, and Absorption
The surface-based model of the nasal cavity (Figure 3) was created to represent a simplified, yet anatomically-accurate geometry of the epithelial surface in the nose. Using morphometric data from Xi et al.,23 a flat surface was created whose transverse length corresponds to the combined cross-sectional perimeter of the left and right nasal airways at a given distance from the nostril tip. Illustrated in the figure are the anatomical regions corresponding to the anterior portion of the nose (the nasal vestibule, NV), the nasal turbinates or middle passages (MP), and the nasopharynx (NP). This model (Figure 3) therefore represents a surface-based version of the nasal cavity that extends from the nostrils to the throat. The model height in the direction normal to the image shown in Figure 4b was defined to represent the ASL (i.e., mucus) thickness. Previous studies have reported varying ranges for nasal mucus thickness, from 5 μm4,17,19,48 to 10–15 μm.14,40,49 Given this range of heights, a representative total ASL thickness of 7.5 μm was selected for the purpose of model development and validation. Considering the small dimension of the mucus layer height relative to the large approximate size of the nasal surface, with an area of 167 cm2, capturing 3D curvatures of the nasal anatomy was not viewed as important for simulating mucus motion and post-deposition transport.
Figure 3.
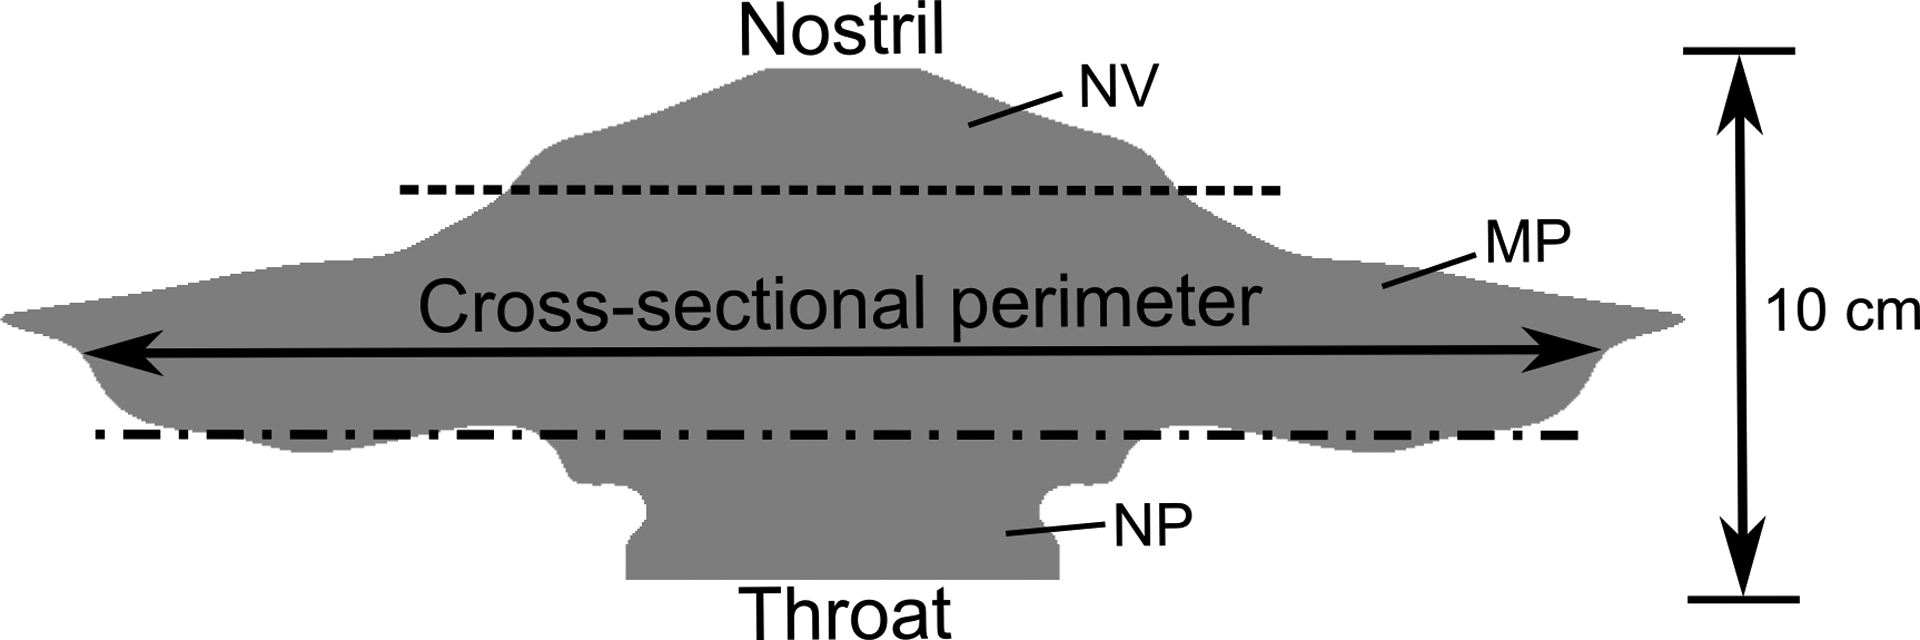
The surface model of the nasal cavity is shown, where the lateral length corresponds to the cross-sectional perimeter of the airway. The dotted lines indicate the separation between the nasal vestibule (NV), middle passages (MP), and nasopharynx (NP).
Figure 4.
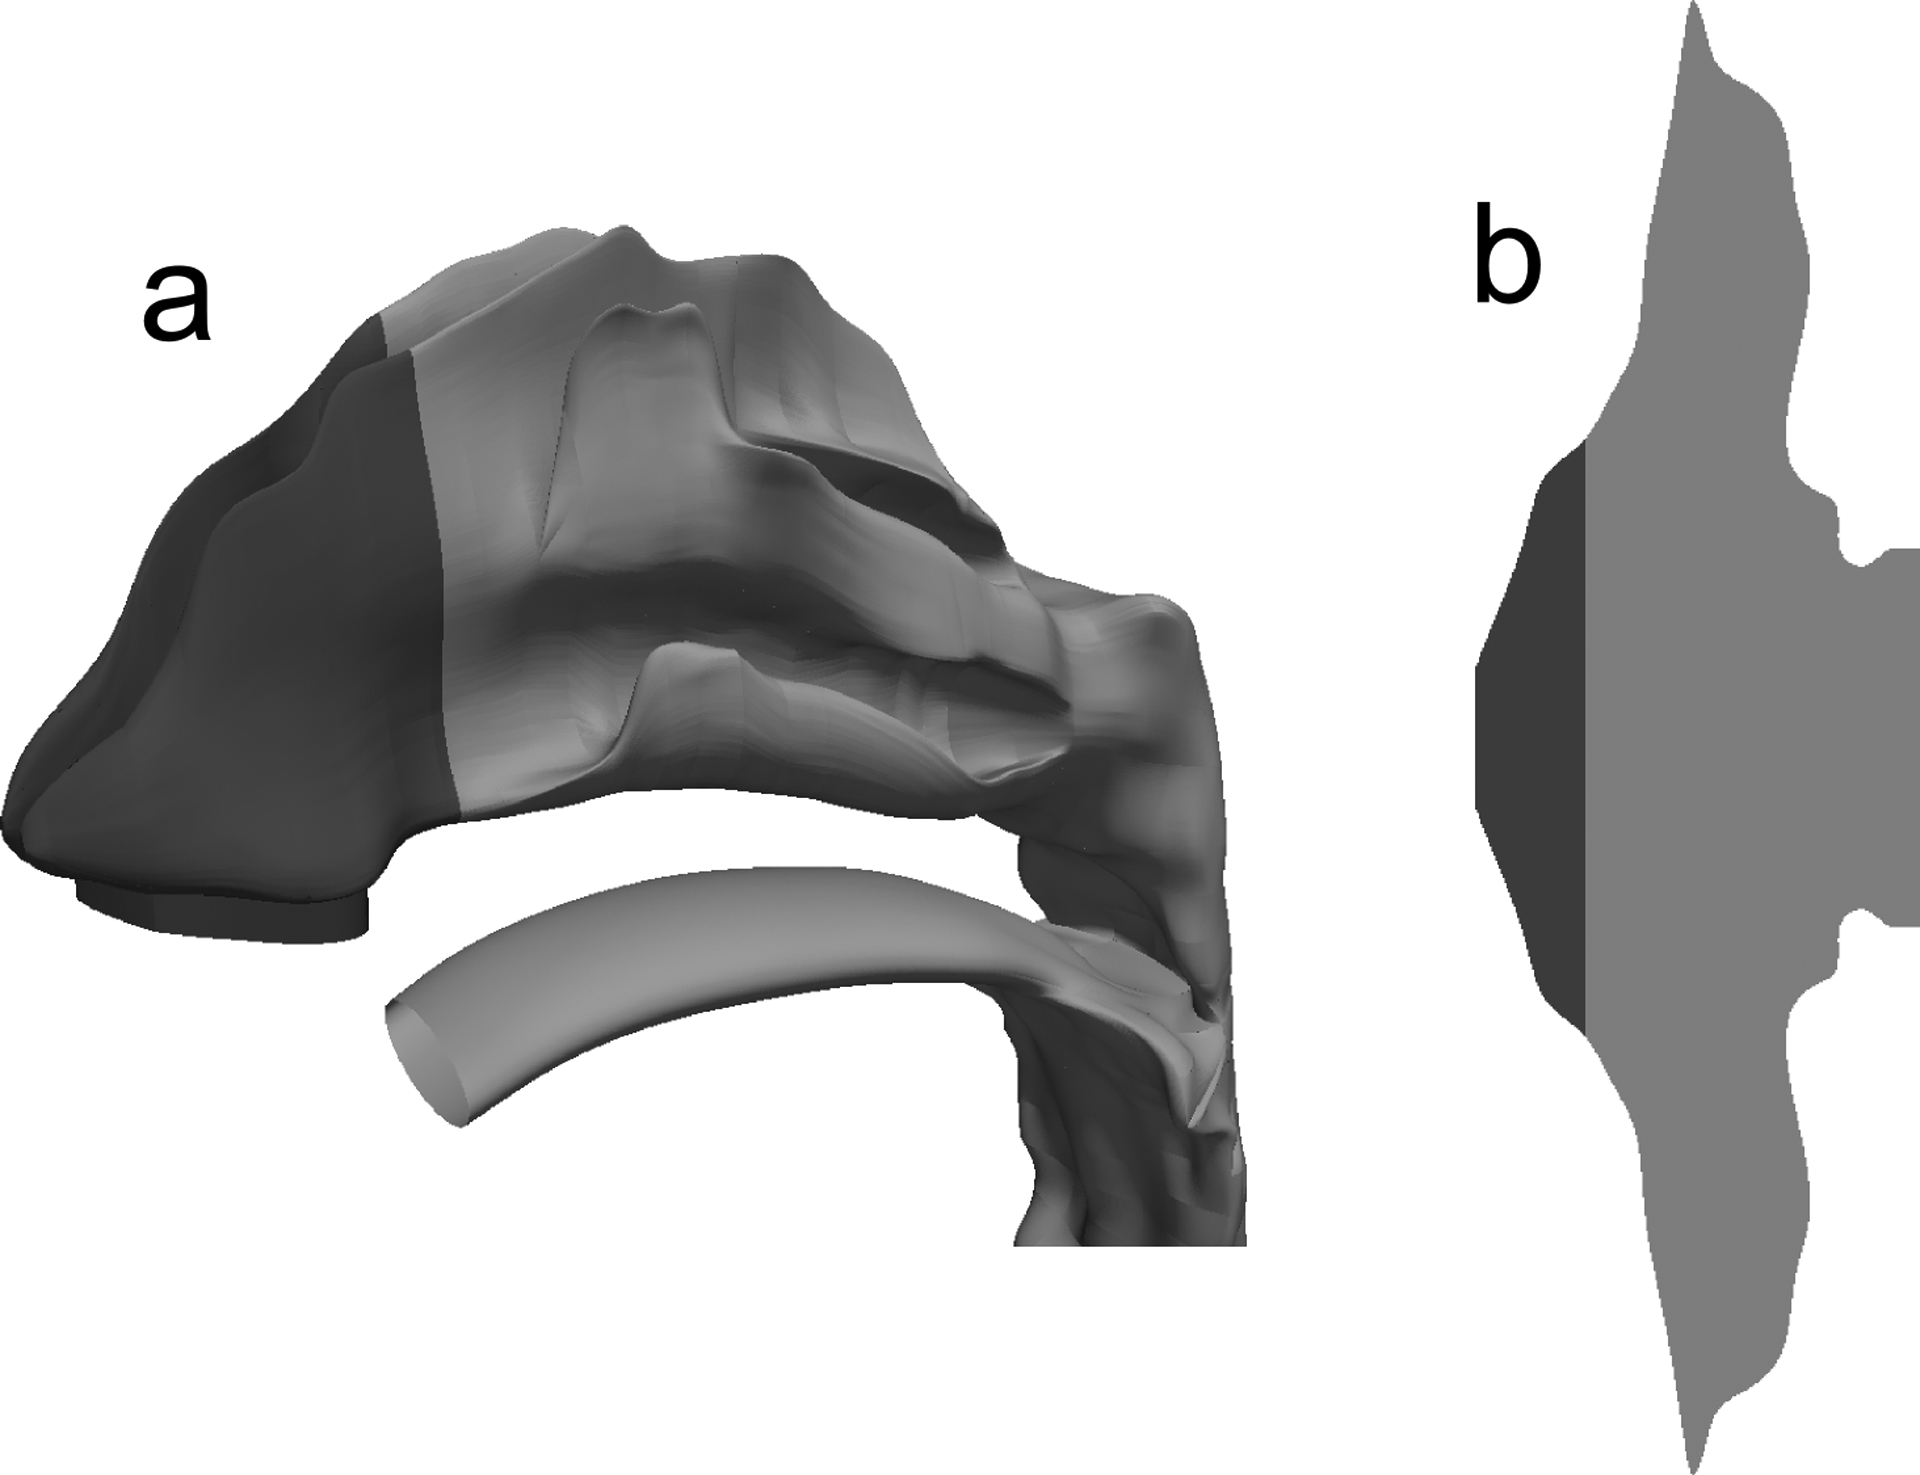
The unciliated region of the nose (NV) is shown in dark gray for the (a) 3D NMT geometry and (b) surface model of the nose.
Simulation of Nasal Spray and Droplet Deposition
Computational fluid dynamics (CFD) simulations were run to assess nasal spray particle transport and deposition in the nasal cavity. To model the spray characteristics at the nozzle tip, the methodology employed by Longest and Hindle50 was used, which involved simulations of aerosol particle transport in a gas-phase jet. In that study, the authors found that two-way coupling (i.e. including the effects of aerosol momentum on the gas phase) is essential for capturing critical components of the spray flow. However, two-way coupled simulations are computationally expensive, and it was found that the coupling process could be approximated by performing one-way coupled simulations with an effective air jet to model the influence of the aerosol on the gas phase.50 That is, for a given aerosol velocity, a separate air jet velocity was specified at the nozzle orifice to account for momentum exchange between the aerosol and gas phases. To capture the nasal spray effect in the current study, the air velocity induced by droplets exiting the spray pump was specified such that the flow speed of the mixture ≈1 cm downstream of the nozzle tip was approximately 15 m/s.51 An initial aerosol injection velocity of 7 m/s was specified, which is in the range used by previous CFD simulations of particle transport from similar nasal spray pumps.9,36 A plume angle of 52 degrees, in the range of typical of nasal spray devices,52 was specified at the site of injection.
To ensure that the CFD model was accurately predicting both spray aerosol effects and flow dynamics within the nasal model, validation cases were considered that included the spray actuation with (i) no inhalation, (ii) slow nasal inhalation, and (iii) fast nasal inhalation. The validation simulations were based on the previously reported nasal spray in vitro experiments of Azimi et al.,38 which implemented a Nasonex® spray pump, MF as a model drug suspension product, and an in vitro rapid prototype airway geometry identical to the NMT geometry used in this study. For validation cases (ii) and (iii) involving inhalation, flow rates of 20.2 L/min and 35.8 L/min were used for slow and fast nasal inhalation, respectively, which correspond to the peak inspiratory flow rates (PIFR) used by Azimi et al.38 Simulation of nasal sprays introduces the challenge of both turbulent flow characteristics in the vicinity of the spray and nostrils as well as mostly laminar flow in the majority of the nasal cavity. To accurately simulate low-Reynolds number turbulence and transition to laminar flow, the low-Re stress-omega model was used in these simulations. This Reynolds Stress Model (RSM) is able to capture turbulent anisotropy near walls, includes low-Reynolds number corrections, and contains transport equations that resemble the k-ω model, making it suitable for a wide range of turbulent flows. In this manner, previously developed corrections typically required for accurately simulating particle deposition with isotropic turbulence models47 could be avoided.
Simulations were run using ANSYS Fluent 15 (ANSYS Inc., Canonsburg, PA). The air-phase flow field solution was obtained using the SIMPLEC algorithm for pressure-velocity coupling, and all transport equations were discretized to be 2nd order accurate in space. A converged solution was obtained when all mass and momentum residuals dropped by at least three orders of magnitude and did not change with further iterations.
The delivery of a nasal spray occurs over a very brief time period relative to a full nasal inhalation breathing cycle. Based on this observation, steady simulations of the inlet airflow profile and resulting flow field are justified. Using these steady-state flow fields, simulations of discrete particle transport (Lagrangian modeling) provided spray droplet deposition locations in the nose. Using the injection conditions described above, 50,000 droplets with a polydisperse size distribution were injected from the spray pump nozzle tip and tracked until they impacted an airway surface. The polydisperse size distribution of the spray pump aerosol was based on internal lab measurements (not reported) for a MF suspension spray product and Nasonex® (Merck & Co., Summit, NJ) spray pump. Given the location and size of each deposited particle, drug mass deposition fractions were calculated in the NV and MP for comparison with the in vitro results under identical conditions (including inclination angles and insertion depth) of the recent study by Azimi et al.38 It is noted that calculation of drug mass deposition fraction accounts for the amount of drug deposited as a function of the polydisperse spray droplet size.
Translation of Deposited Spray Droplets and Suspended Particles to the Surface Model
After calculating the spray droplet deposition locations, a translation was required for the starting position of suspended drug particles. Although the nasal spray is ejected from the nozzle as liquid droplets (as described previously), the formulation under consideration is a suspension, which consists of solid un-dissolved particles immersed in the carrier liquid. The current simulations assumed a monodisperse suspension of 3 μm geometric diameter MF drug particles. For each droplet deposition location in the 3D model, the axial distance from the nostril was calculated; this distance was translated to a location relative to the nostril on the surface model, where a drug particle starting point was specified. Additionally, the spray droplet size was taken into account by weighting the number of drug particles at each location in the surface model by the droplet mass, such that the mass deposition fractions in the 3D and surface models were in agreement.
Calculation of the Mucus Clearance Velocity Field
Mucociliary clearance rates have been reported as 5–6 mm/min on average in a typical and healthy adult.16,17,19,48 To create a realistic mucus flow profile, this study began with the requirements that (i) ASL height would be held constant and (ii) the cross-sectional flow profile in the ASL layer would resemble that shown on Figure 1c. It is often stated that ASL consists of a watery periciliary fluid (sol layer) in which the cilia move covered by a blanket or patches of higher viscosity mucus.14,40 The cilia beat in a whip-like manner in the sol layer with the tips of the cilia contacting the lower mucus surface and propelling it on the forward strokes.14,40 Constant ASL height is based on the view that the respiratory cell surface will absorb and secret periciliary fluid in a manner that keeps the tips of the cilia just touching the mucus blanket during the propulsion stroke.40 This is likely accomplished through mechanotransduction53 and active ion secretion into the ASL.54 Considering the whip-like beating motion of the cilia, which are attached at the epithelial surface and have a highest velocity at the mucus interface, this study assumes a periciliary velocity profile as shown in Figure 1c. Furthermore, considering the high viscosity of mucus relative to the periciliary layer, we assumed the mucus layer velocity to be constant in the wall-normal direction, which is also shown in Figure 1c.
A flow field that satisfies the two specified requirements was created by injecting periciliary liquid as a mass source into the domain to maintain a realistic velocity profile, similar to that shown in Figure 1c. Since the anterior third of the nose (NV) is unciliated11 and composed of keratinized squamous epithelial cells55 (see Figure 4), the mass injection (and therefore velocity) was set to zero in the first 25 mm of the surface model (although a constant ASL thickness of 7.5 μm, specified by the computational mesh, was still assumed in this region). In the ciliated region of the nose (i.e., MP), the mass source was specified such that, after solving the Navier-Stokes equations, the average velocity in the MP was close to the 5–6 mm/min range reported in the literature.16,17,19,48 The magnitude of the mass source was calculated by applying conservation of mass with the assumption of a constant mucus layer height and target clearance velocity. This resulted in an injection rate that was a function of the varying cross-sectional perimeter in the axial direction of the nasal model (see Figure 3). The justification of this variable injection and absorption of ASL is that a constant periciliary layer height is required by the cilia to most effectively perform their function and clear the mucus.13,14,54 This injection profile resulted in a variable velocity field with a net transport of mucus from the front to the back of the nasal cavity. Importantly, the nature of this fluid injection led to a natural velocity transition region between the NV and MP after solving the Navier-Stokes equations. This transition is expected to mimic the in vivo change from squamous to ciliated epithelium,55 allowing for small scale mixing and transport of fluid from the NV and MP. The implications of these fluid flow patterns on drug transport and absorption are described in the Results section.
In terms of physical properties, the non-Newtonian behavior of nasal mucus makes characterizing its viscosity difficult.40 Studies have shown that, at low shear rates, the ratio of mucus viscosity to the viscosity of water can be greater than 10,000.56,57 Additionally, it has been found that a mucus viscosity close to 12 Pa ⋅ s is optimal for mucociliary clearance,58 which falls in the range reported by Mestecky et al.56 For the current study, an effective mucus viscosity of 10 Pa ⋅ s was used when solving the Navier-Stokes equations for the mucus velocity field. While this likely represents an in vivo state, the selected viscosity does not have a direct impact on the performance of the model, as the fluid motion is prescribed to meet a target clearance rate (as described above).
Calculation of Drug Dissolution and Absorption
In the current computational model, the suspended drug particles dissolve according to the Noyes-Whitney equation as they move through the nasal cavity, i.e.,
| (1) |
In this equation, A is the surface area of the particle, Dmucus is the diffusion coefficient of the drug in mucus, Cs is the solubility of the drug, Cb is the concentration in the bulk phase, and h is the diffusion layer thickness. Since the effective radius of a MF molecule is very small (~ 1 nm), the diffusion coefficient of the dissolved drug in mucus is approximately equal to its diffusion coefficient in water.59 The aqueous diffusion coefficient of MF was calculated by the Hayduk and Laudie equation;60 all other properties of MF (e.g. solubility, density, etc.) were taken from the product information for the drug.41 For particles with radius < 30 μm, the diffusion layer thickness h around a particle can be approximated as the particle radius that changes with time as the drug dissolves;61 as described earlier, we are considering an initially monodisperse particle diameter of 3 μm.
The behavior of the dissolved drug was governed by the advection-diffusion equation for species transport, i.e.,
| (2) |
where ρ is the fluid density, Yi is the mass fraction of species i, is the fluid velocity, Di,m is the mass diffusion coefficient of the drug, and the source term Si accounts for the addition of drug into the bulk phase from the dissolving particles.
When calculating drug uptake at the epithelium, differences in nasal cell types were taken into account. The NV (see Figures 3 and 4) is characterized by keratinized, stratified squamous epithelium13,14,48 and is therefore unlikely to absorb any significant amount of drug. A zero-gradient boundary condition for MF was therefore applied to the epithelium in this region. In the MP, which is coated with respiratory and olfactory epithelium,14,48 the drug concentration at the epithelium was set to zero. This was justified by considering the octanol/water partition coefficient of MF, which is greater than 5000,62 indicating that the drug is readily absorbed by these epithelial cells upon exposure.
Numerical Methods for Particle Advection, Dissolution, and Absorption
Computational fluid dynamics simulations for evaluating mucus flow and particle transport were run using ANSYS Fluent 15 (ANSYS Inc., Canonsburg, PA) coupled with user-defined functions for drug dissolution and absorption. A steady-state flow solution was calculated using the SIMPLEC algorithm for pressure-velocity coupling, and all transport equations were discretized to be 2nd order accurate in space. The solution was determined to be converged when all residuals dropped by at least three orders of magnitude and did not change with additional iterations. The mesh resolution was found to be sufficient, as increasing the number of computational cells spanning the mucus layer beyond 15 had a negligible effect on the flow solution. Within the mucus flow field, transient simulations of coupled particle transport, dissolution, and species transport were carried out for a total clearance time of one hour after spray aerosol administration. At each time step, a sufficient number of iterations were performed to converge the solution of the species transport equation.
When tracking discrete particles, it can often be computationally prohibitive to track every particle in the domain. To account for this, a “parcel” tracking method was employed, where each parcel represents a certain number of particles with the same properties (e.g. diameter, velocity, position, etc.). A sufficient number of parcels is required to accurately simulate the drug particle behavior; a sensitivity study was therefore carried out to determine the appropriate number of parcels for this model.
Validation of CFD Mucus Clearance Rate
To evaluate the physiological accuracy of the calculated mucus velocity field, CFD simulations were compared with existing in vivo data of radiolabel clearance from the nose. In the in vivo study by Shah et al.,27 a radiolabel tracer was deposited into the noses of human subjects via a nasal spray, and scintigraphic techniques were used to determine the rate of radiolabel clearance by mucociliary transport (i.e., the mass of radiolabel remaining in the nose over time). The radiolabel tracer was not absorbed by the respiratory epithelial cells, and this comparison therefore allows for isolation of the mucus velocity as it relates to nasal clearance. For validation of the current model, CFD simulations were set up with the computed velocity field described above, and an initial “radiolabel” deposition profile matching that reported in the in vivo study.27 Transient simulations of radiolabel transport were then run for a total simulation time of six hours, consistent with the in vivo study, and the mass remaining in the computational domain was calculated at each time step for comparison with experimental time points.
Validation of CFD Particle Dissolution Predictions
To ensure that the CFD user-defined functions were correctly capturing the dissolution behavior of the drug particles in a limited volume of liquid, a validation study was performed with existing in vitro data. Arora et al.39 measured the rate of dissolution for 5 inhaled corticosteroids with varying aqueous solubilities. Aerosol particles were collected in an impactor and placed on the donor compartment of a Transwell® support, which was bounded by a permeable membrane and basal receptor compartment. After the addition of 0.04 mL aqueous fluid into the apical donor compartment, the drug particles were allowed to dissolve, and measurements were taken of the dissolved drug that appeared in the basal receptor compartment. To validate the code governing particle dissolution in the current CFD model, a corresponding computational domain was created, in which a 0.04 mL volume containing a “membrane” boundary was bordered by a larger “receptor” volume. For three corticosteroids with different solubilities (reported in Arora et al.39), simulations were run where drug particles were injected into the top “donor” volume and allowed to dissolve according to the user-defined functions. The diffusivity across the “membrane” boundary was specified to match the membrane permeability profile for a solution of flunisolide reported in the in vitro study.39 At each time step, the amount of dissolved drug in the “receptor” volume was calculated and compared to the measurements by Arora et al.39
RESULTS
Validation of CFD Spray Droplet Deposition with In Vitro Data
CFD simulations of spray droplet deposition were validated with in vitro experiments38 to ensure correct deposition profiles. At a nozzle tip insertion angle of 30 degrees, with no inhalation airflow, both CFD and in vitro results show that approximately 90% of the drug mass is deposited in the NV, while the rest of the drug is deposited in the MP (Figure 5). For the slow and fast inhalation cases, the CFD results tend to underpredict MP deposition relative to the in vitro experiments by around 10%; however, both sets of data show that an inhalation flow rate greatly increases drug deposition in the MP, the target site for drug absorption. Still, even the best case scenario shows that less than half of the administered dose reaches the MP, demonstrating the need for improvements in the design of current nasal spray devices. Overall, the CFD predictions capture the trend in nasal deposition distribution without and with nasal airflow and fall approximately within the in vitro standard deviation bars. As a result, the CFD simulations of nasal spray delivery are viewed as acceptably accurate.
Figure 5.
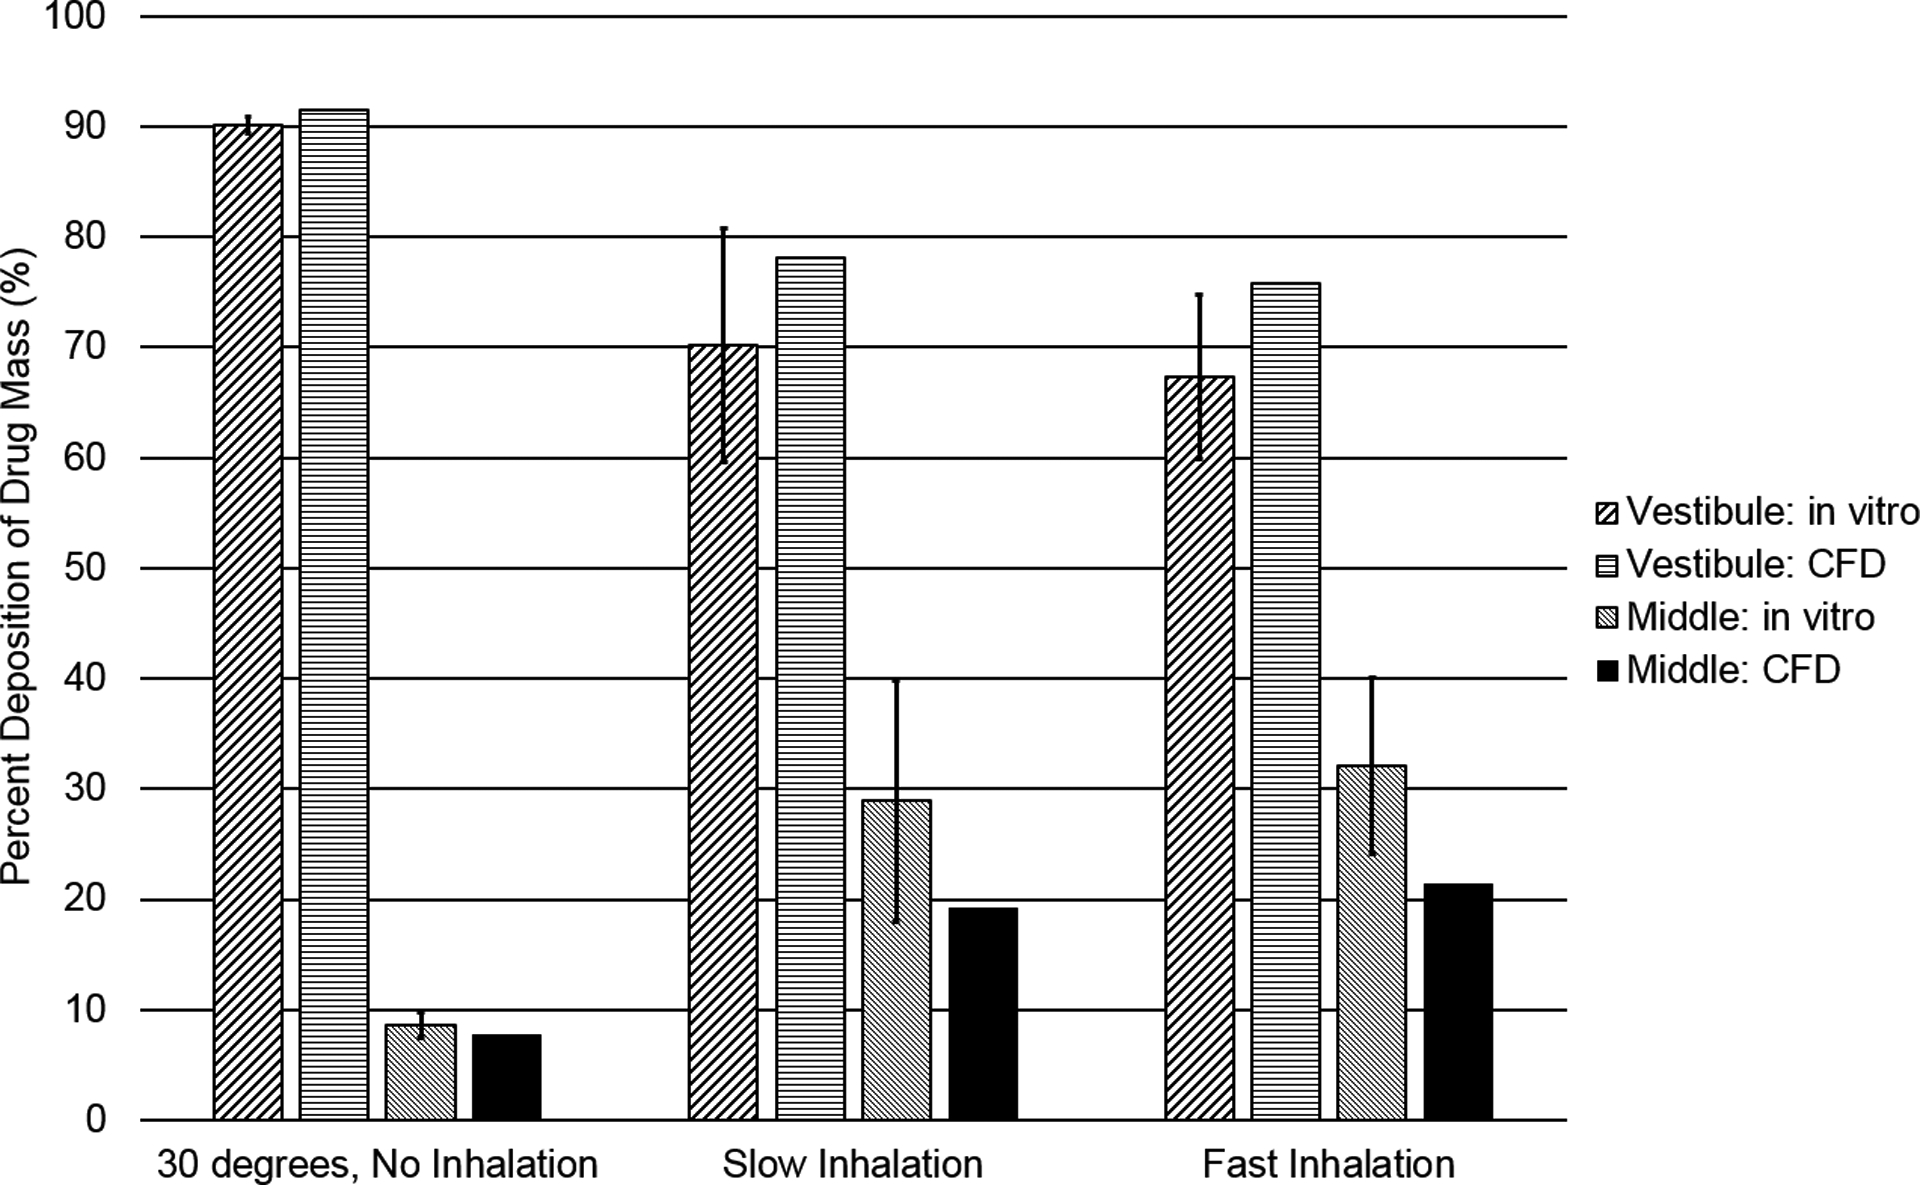
Deposition fractions as a percentage of aerosolized drug mass in the NV and MP, based on CFD and in vitro data for a commercial nasal spray, are shown for a 30 degree spray angle with and without inhalation.
CFD Mucus Clearance Velocity Field
The computed mucus velocity field on the surface model, Figure 6, demonstrates the variability in the local mucus velocity field with the overall specified mucus velocity of 5–6 mm/min. It is noted that this variable mucus velocity field is the result of variable surface liquid injection to maintain a constant mucus thickness over a variable perimeter. Faster velocities can be seen near the throat, where the cross-sectional perimeter decreases; likewise, stagnant regions can be observed where the cross-sectional perimeter increases (due to conservation of mass). This variable velocity field is expected to match in vivo total clearance over time for healthy human adults, and this assumption is confirmed with the validation study presented in the next section.
Figure 6.
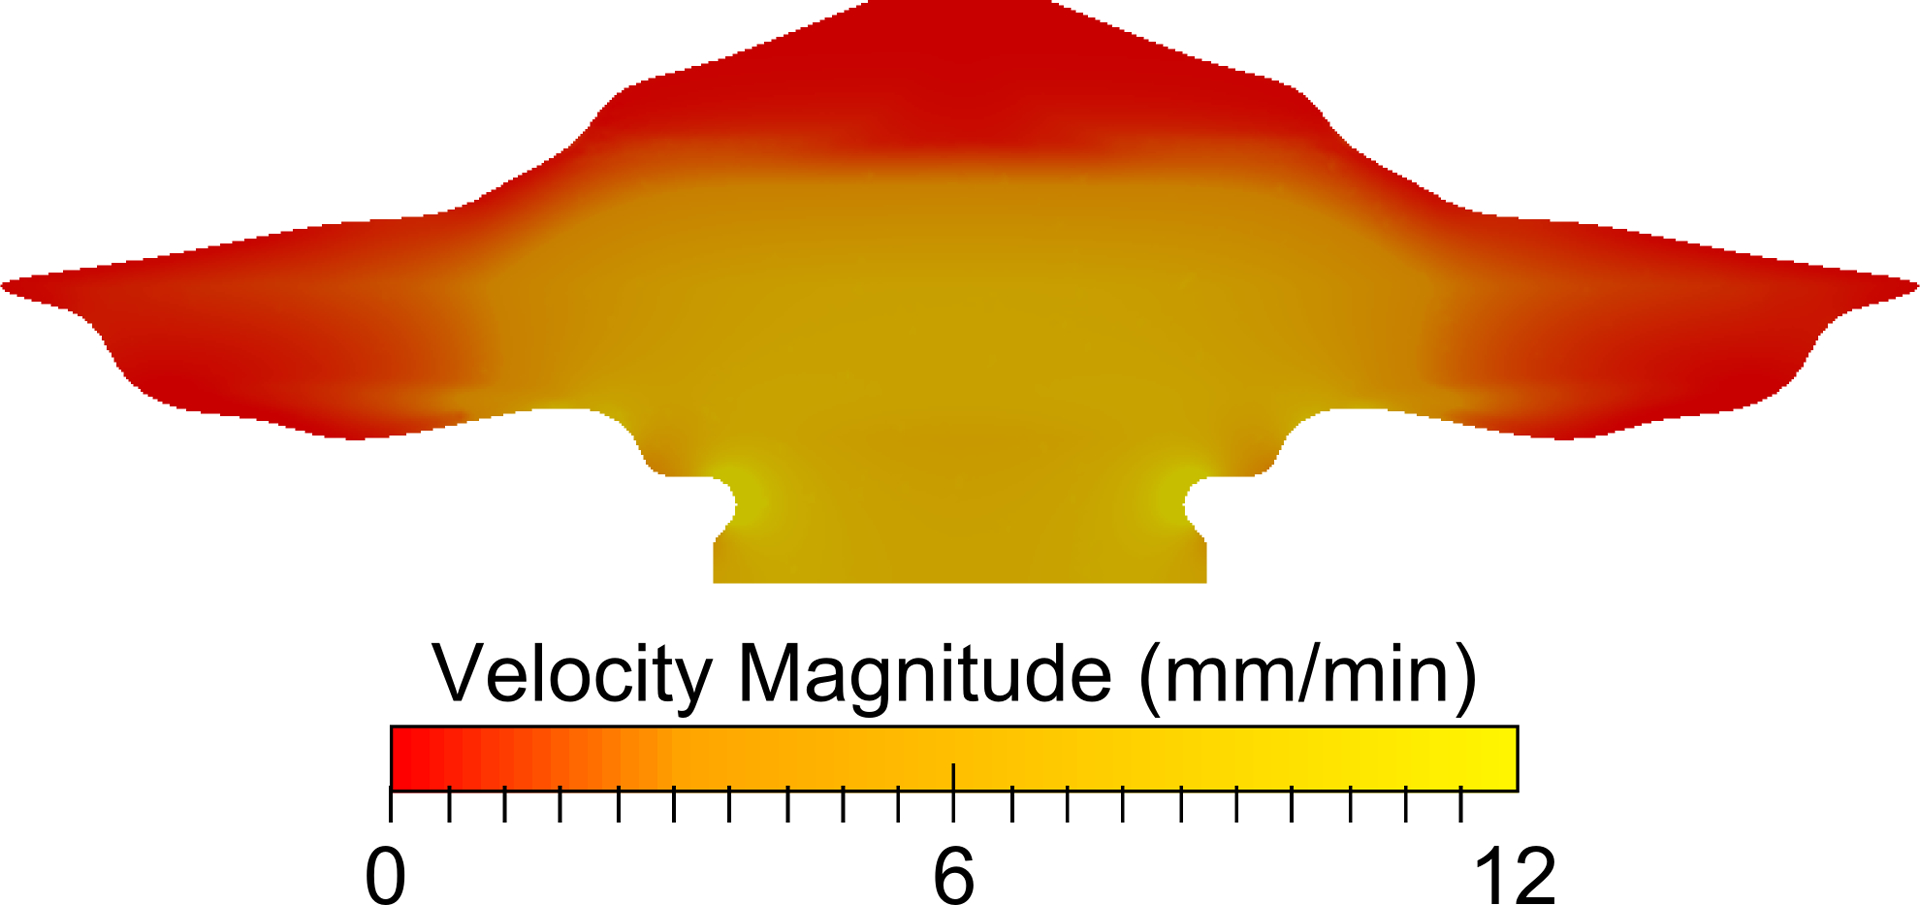
The velocity field at the air-mucus interface (top) of the domain is shown and illustrates a dependence on the nasal cross-sectional perimeter.
Validation with In Vivo Nasal Clearance Rates
The results of the nasal clearance validation study, shown in Figure 7, indicate that the mucus velocity field (Figure 6) provides realistic clearance rates of a radiotracer27 that are representative of normal physiological conditions. Over a simulation time of 6 hours, the radiolabel remaining in the CFD model closely matches that in the in vivo study (Figure 7).27 This indicates that, given an initial mass deposition profile from a nasal spray product, the CFD clearance model accurately predicts the nasal mass clearance rate from a healthy human adult population. The error bars in the in vivo data represent the standard deviation of data taken across 12 individuals. Based on this agreement, the velocity field in the CFD model is expected to realistically represent drug particle clearance from the nasal cavity, including the effects of local changes in the velocity profile required to maintain a constant ASL height.
Figure 7.
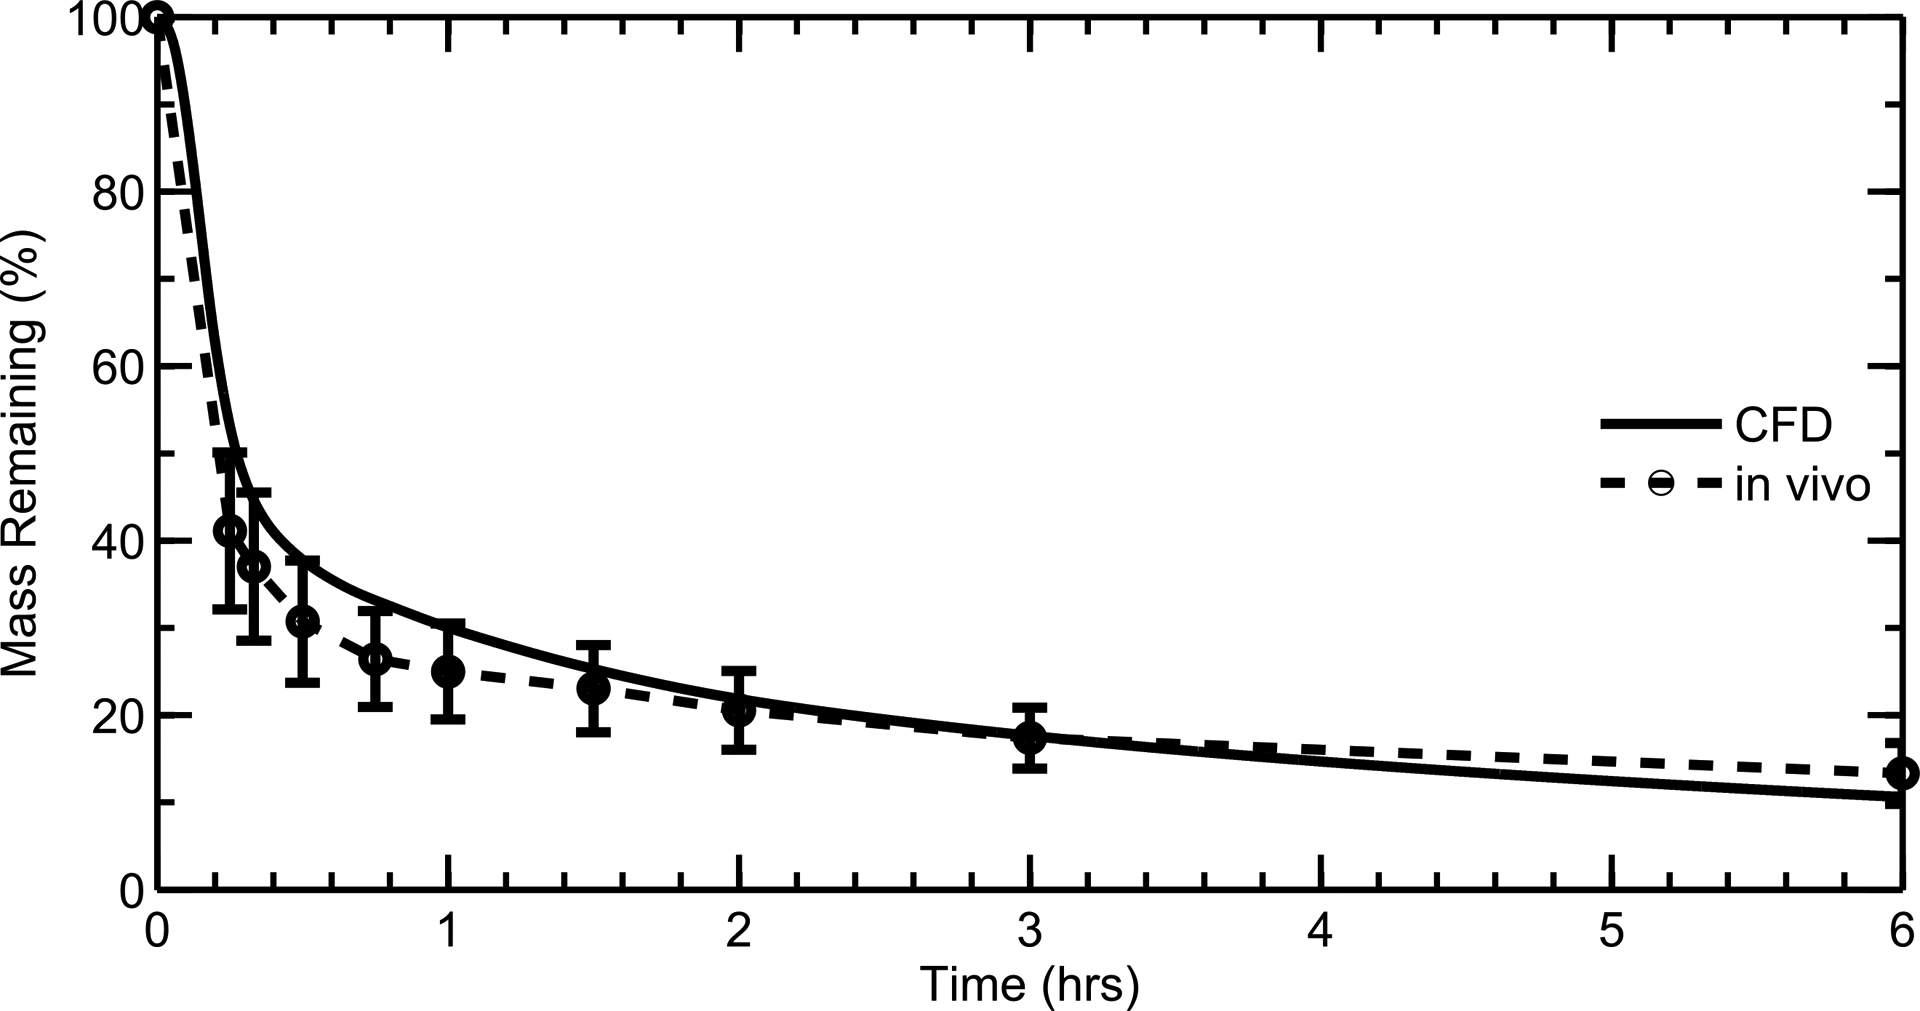
CFD and in vivo data of radiolabeled aerosol clearance from the nose compared over an assessment period of 6 hours.
Validation of CFD Code with In Vitro Dissolution Data
As described, separate CFD simulations of the dissolution Transwell® system experiments of Arora et al.39 were conducted in order to assess the model’s capability to accurately predict drug particle dissolution in a concentration-limited system. CFD results showed good agreement with in vitro39 dissolution rates (Figure 8) for three corticosteroids whose solubilities spanned three orders of magnitude, validating the ability of the CFD user-defined functions to realistically model particle dissolution in the current system, even at high drug concentrations and with concentration-limited dissolution. The corticosteroids considered were flunisolide (FN), budesonide (BD), and fluticasone propionate (FP). Over a simulation time of 1.5 hours, the amount of dissolved drug that appeared in the “receptor” volume of the CFD model matched that of the in vitro experiments for each of the drugs. As the solubility of the different drugs increased, so did the dissolution rate, leading to a greater amount of drug permeating the membrane at each time point. The results highlight the ability of the CFD model to predict dissolution rates for a wide variety of drugs, regardless of solubility. Non-linearity of the in vitro and CFD predicted curves indicates limitations of dissolution associated with drug solubility.
Figure 8.
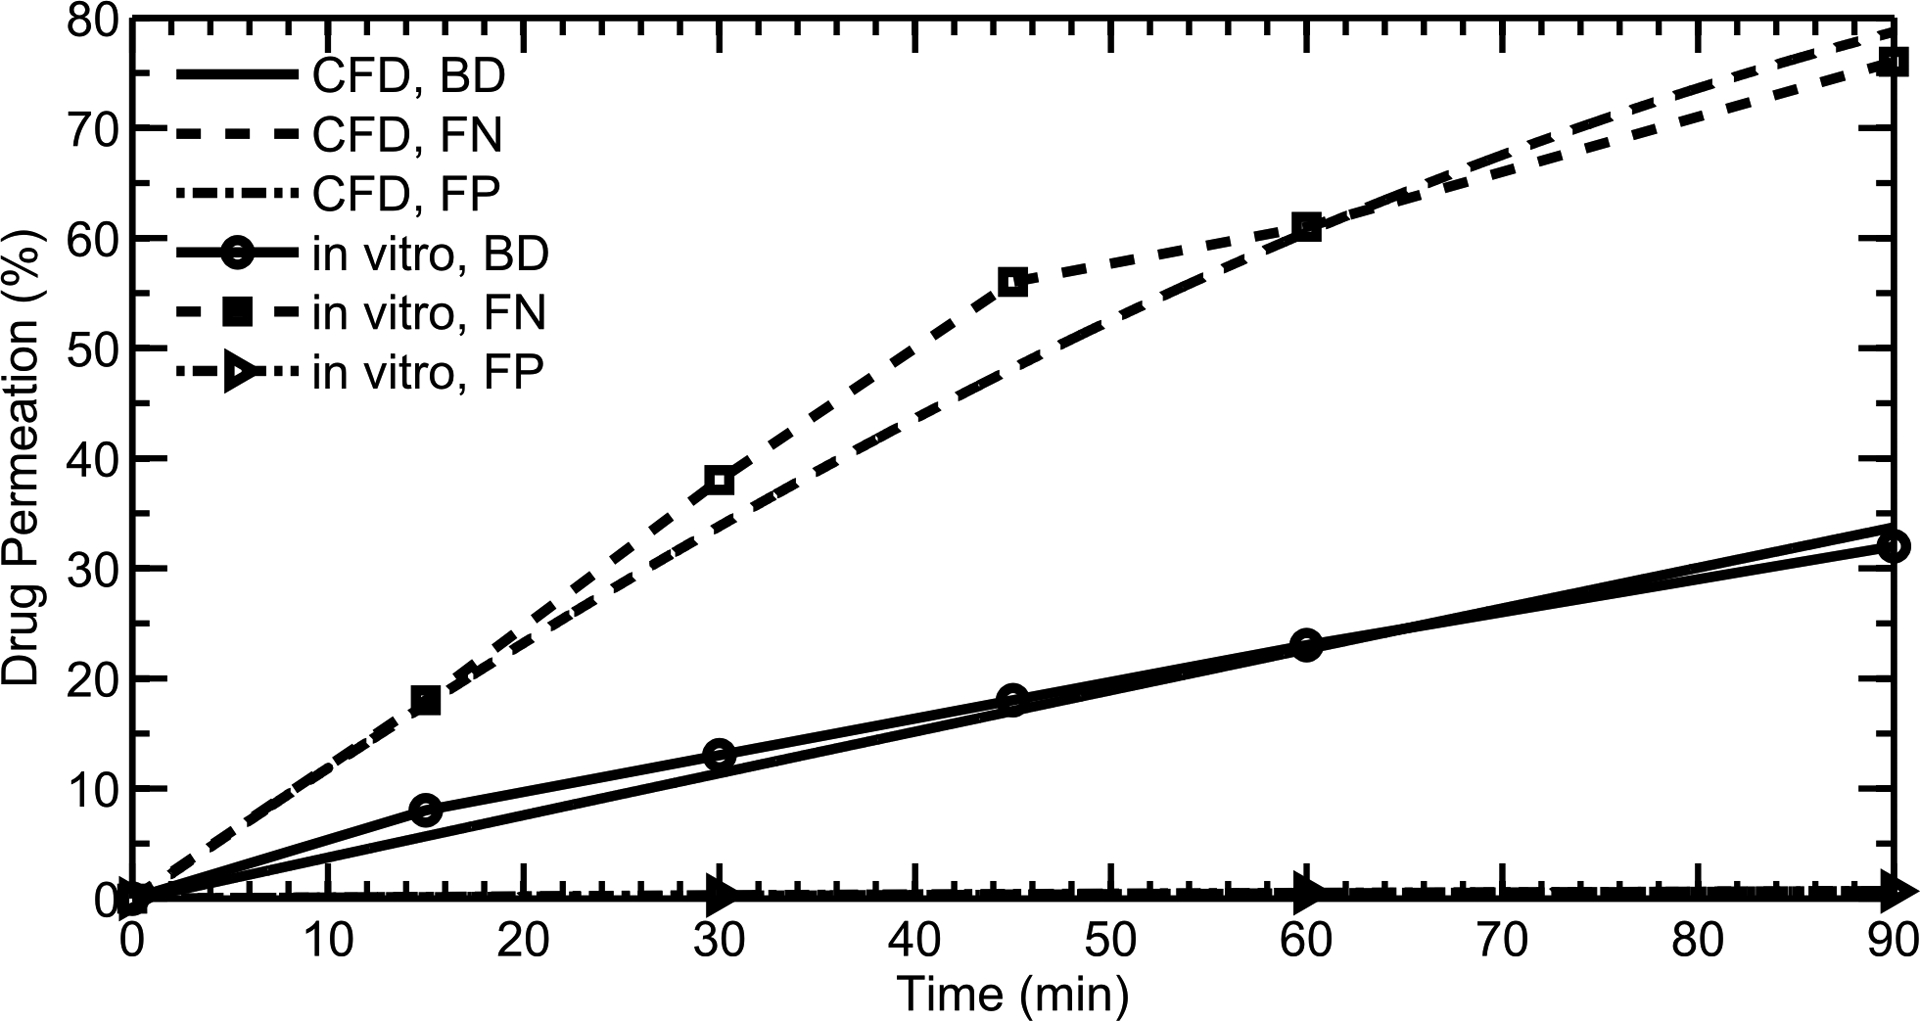
CFD simulations of particle dissolution are compared with in vitro data from Arora et al., 2010 for three different drugs with varying solubilities: Flunisolide (FN), Budesonide (BD), and Fluticasone propionate (FP).
Sensitivity of Injected Parcel Number
As discussed in the Methods section, ANSYS Fluent employs a “parcel” tracking method to reduce computational cost when modeling the discrete phase, where each parcel represents a number of particles with the same properties. However, a sufficient number of parcels is required to accurately simulate the behavior of the particles. Figure 9 shows cumulative drug uptake at the epithelial surface when the number of injected parcels is varied between one thousand, ten thousand, and one hundred thousand. Given the cumulative uptake after an hour for the three cases, an effective grid convergence index (GCI)63 can be calculated in terms of the number of parcels (rather than the grid resolution). For 10,000 parcels, the GCI is calculated as 1.7%, while the GCI for 100,000 parcels is 0.6%. Since approximately 50% of the drug is absorbed after an hour, an uncertainty of 1 to 2 percent will not have a significant effect on the overall results. Therefore, a parcel quantity of ten thousand was chosen to accurately represent particle behavior while reducing computational cost.
Figure 9.

Cumulative drug uptake at the epithelium over time is shown for particles of 3 μm diameter with a varying number of injected parcels. Results are shown as a percentage of total injected drug mass.
Effect of Initial Particle Penetration Depth in Mucus
It is unknown how deeply the aerosol drug particles penetrate the nasal mucus layer upon deposition, but it is likely a factor of particle surface properties.64 Figure 10 shows cumulative drug uptake for particles of 3 μm diameter when they are injected at either random depths throughout the mucus layer or near the top of the mucus layer. The fast uptake rates within the first few minutes (for both injections) correspond to the quick dissolution of the 3 μm particles deposited in the MP. Once these particles have been absorbed, dissolved drug in the NV is carried towards the MP and respiratory epithelium (illustrated by the slow, steady increase in the uptake profiles at longer time scales). This transport is due to the motion of the posterior mucus, which pulls in fluid from the vestibule (see Figure 6); this effect is further elaborated upon and illustrated in the following section (see Effect of Mucus Velocity).
Figure 10.
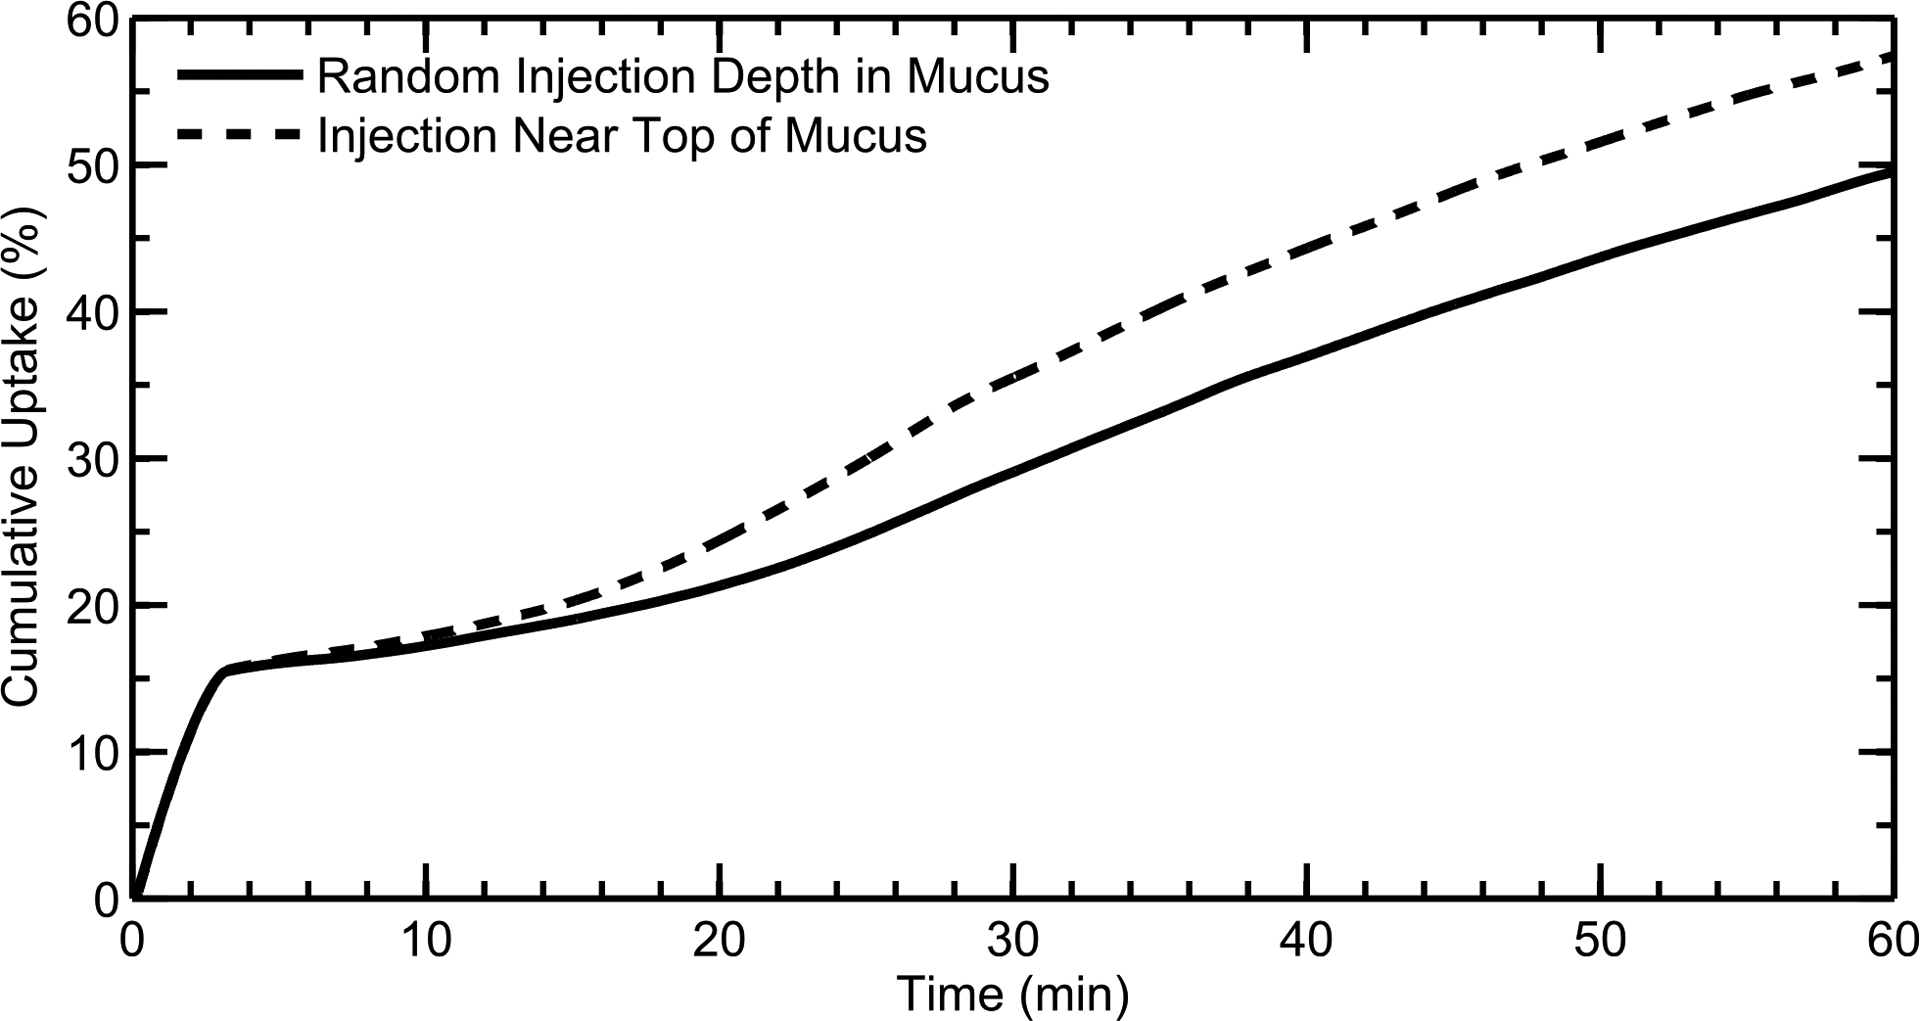
Cumulative drug uptake at the epithelium over time is shown for particles of 3 μm diameter when they are injected at random depths in the mucus or near the top of the mucus layer. Results are shown as a percentage of total injected drug mass.
Based on Figure 10, when the particles are injected near the top of the mucus layer, the dissolved drug is carried to the back of the nose by the faster velocity in this region (see Figure 1c); this leads to increased drug absorption at longer time scales when compared to the “random” particle injection, where more of the dissolved drug diffuses into the low-velocity region near the epithelium. For the rest of the study, particles were injected at random depths throughout the mucus layer, as this methodology provided a clearance rate of dissolved drug that best agreed with in vivo data (Figure 7).
Effect of Mucus Velocity
Because nasal mucus clearance rates can vary between individuals, and some diseases inhibit proper mucociliary clearance, CFD simulations examined the effect of average mucus velocity on overall drug absorption at the epithelial surface. As discussed earlier (see Methods), the mucus velocity was set to zero in the NV and increased to a specified clearance rate further back in the nose through a defined injection of perciliary liquid. Figure 11 shows drug uptake profiles for posterior (MP+NP) area-based average mucus velocities of ≈5 mm/min, ≈2.5 mm/min, and zero (i.e. no mucociliary clearance). Mucus velocity has very little effect on drug absorption within the first few minutes, where particles in the MP and NP regions quickly dissolve and drug reaches the epithelium. At longer time scales, a slower mucus velocity results in decreased drug advection from the front of the nose, as expected. When the velocity is zero, drug transport is caused only by diffusion; as shown in Figure 11, the small aqueous diffusion coefficient of MF inhibits any significant diffusive transport of drug from the NV to the MP and NP regions over 1 hour. Additionally, diffusion is further limited by the low concentration of dissolved drug in the mucus layer, which is bounded by the aqueous solubility limit of MF. This shows that, at long time scales beyond the first few minutes, drug transport is primarily due to advection from ciliary movement.
Figure 11.
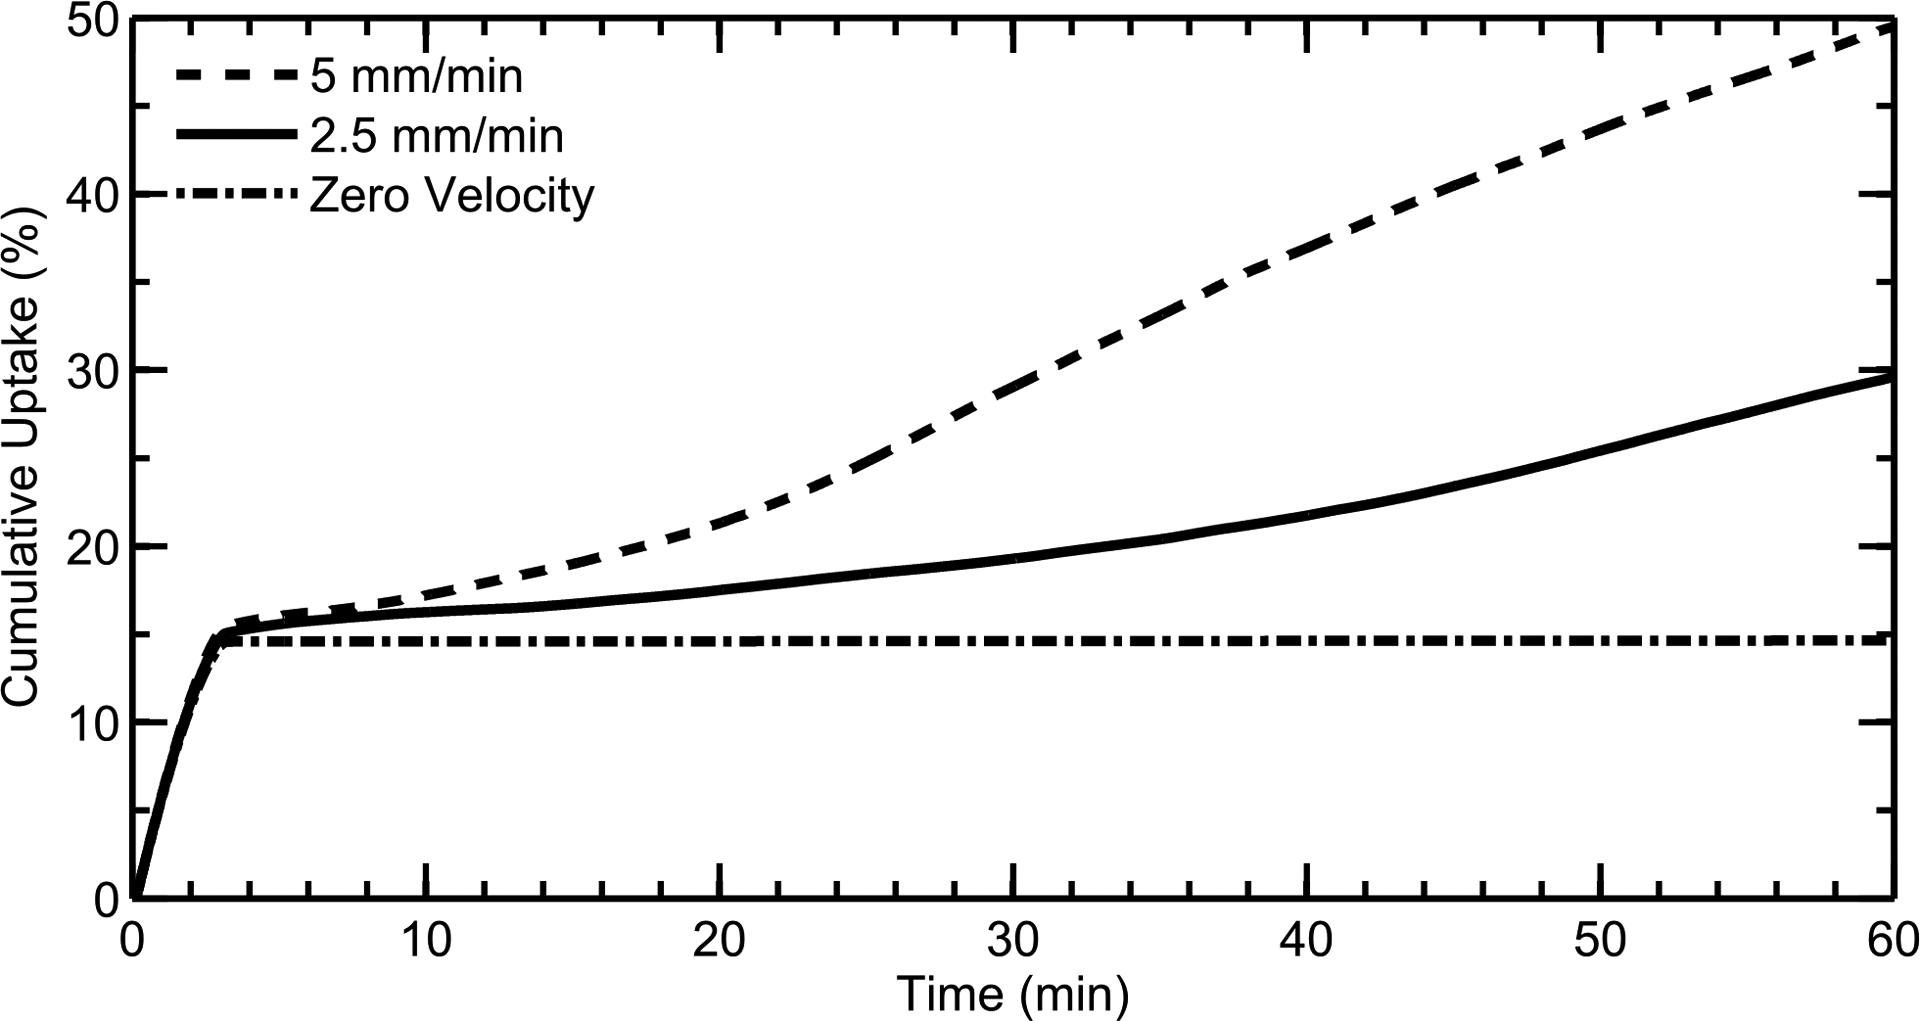
Drug uptake profiles for mucus velocities of ≈5 mm/min, ≈2.5 mm/min, and zero are shown. At long time scales, a slower mucus velocity results in decreased drug advection from the NV. Results are shown as a percentage of total injected drug mass.
Fate of Drug Deposited in the Nasal Vestibule
As discussed previously, drug uptake was limited to the posterior region of the nasal cavity, and this leads to an uncertainty regarding the fate of the drug deposited in the NV. In theory, all of the drug deposited in the NV would eventually make its way to the back of the nose, although this would occur over a very long time scale. In reality, an individual is likely to wipe his or her nose or sneeze well before all of the drug reaches the respiratory epithelium. To quantify this uncertainty, two extremes were modeled: (i) all of the drug deposited in the NV is allowed to move towards the back of the nose over the course of an hour (with an average posterior mucus velocity equal to 5 mm/min), or (ii) all of the drug deposited in the NV exits through the nostril (e.g. through sneezing, nose wiping, etc. immediately after spray delivery). As shown in Figure 12, the amount of drug absorbed can vary by a net difference of 35% between the two cases after an hour of time has passed. The current study is therefore simulating a “maximum” absorption profile where sneezing, blowing or dripping do not occur for an hour (although drug absorption in vivo is likely to fall somewhere between these two curves due to nose blowing or other external effects). This variability also indicates that deposition in the NV should be minimized by the nasal spray device, as inter-individual behavioral differences can lead to widely varying uptake rates and dosages when most of the drug is deposited in the front of the nose (as is the case with most current nasal sprays).
Figure 12.

Cumulative drug uptake at the epithelium is shown over time for 3 μm diameter particles, with two scenarios modeling different boundary conditions for the drug deposited in the NV. In one scenario, all of the drug deposited in the NV is allowed to move towards the back of the nose. In the other scenario, all of the drug deposited in NV exits through the nostril (e.g. is wiped away). Results are shown as a percentage of total injected drug mass.
DISCUSSION
The current study describes the methodology used to create a computational model that realistically represents particle clearance and dissolution in the human nasal cavity. The conversion of a three-dimensional nasal cavity to a surface-based model allowed for simulations in an anatomically realistic domain. Particle deposition data from a commercial nasal spray was mapped onto the surface model, and a mucus velocity field was calculated that accurately represents nasal clearance rates compared with in vivo data (Figure 7). The user-specified routines governing particle dissolution were validated with in vitro data (Figure 8); a parametric study was then performed to assess sensitivity to initial conditions. The penetration depth of the particles in the mucus layer had a modest effect on overall drug absorption, while the mucociliary clearance rate was highly correlated with drug transport and uptake at longer time scales up to 1 hour. Finally, a large amount of variability was observed when considering differences between an idealized case, where the NV dose is not removed through the nostrils and allowed to move into the MP, and a realistically conservative case, where the drug deposited in the NV is immediately wiped away by the individual.
In the area of gas dosimetry, previous CFD-based models have incorporated absorption and transport within mucus, tissue, and blood. For example, Cohen Hubal et al.65 reviewed mass transport models used for gas dosimetry and highlighted the importance of spatial and temporal resolution provided by CFD-based models coupled with boundary conditions for wall mass transport. Schroeter et al.66 developed a coupled CFD-PK model of hydrogen sulfide (H2S) absorption and respiratory tissue dose based on in vivo absorption experiments in a rat. The CFD-PK model was used to illustrate a correlation between local H2S absorption and nasal lesions in the rat inhalation toxicology model and to extrapolate safe exposure limits for humans.67 Tian et al.30,32 illustrated the importance of considering both transient flow field and transient mass transport effects when assessing respiratory gas absorption. Tian et al. then developed transient gas absorption boundary conditions and illustrated implementation in nasal31 and oral airway30 models. Recently, Corley et al.68 implemented a CFD-PK model of gas absorption that also considered transient flow fields and mass transport effects, solving for coupled transport in the air and wall regions. Based on these previous studies, sub-surface gas transport using a CFD-based approach is well developed and useful in the field of toxicology. The model developed in this study is the first implementation of CFD to predict the post-deposition transport of pharmaceutical nasal aerosols.
In delivering nasal spray products, drug deposition in the NV region is typically considered to be lost, whereas drug deposition in the MP is available for absorption and may be cleared by mucociliary action. Figure 11 illustrates that drug transport by diffusion between the NV and MP regions is negligible over the time course of an hour. However, in the current model, ASL layers in the NV and MP regions are connected. As a result, mucus motion in the MP slowly pulls NV mucus into the nasal cavity. In this manner, some drug deposited in the NV can reach the MP and be absorbed resulting in the ongoing absorption observed in Figure 11 with MP clearance. Furthermore, the rate of MP mucus motion has a large effect on how much NV dose is transported into the MP and absorbed, resulting in high dose variability. This convective motion of mucus and deposited drug has not been previously identified or reported using other assessment techniques. While the numerical clearance model may not provide final proof that mucus convection from the NV to the MP occurs, inclusion of this component was required to capture the in vivo clearance profile reported by Shah et al.27 (Figure 7) from a nasal spray product. As a result, the newly developed nasal clearance model may have captured an important absorption mechanism that can largely affect (i) overall absorption of a nasal spray products and (ii) intersubject variability under otherwise similar conditions.
The parametric study showed that reduced mucociliary clearance, perhaps caused by a disease state, can greatly impact the rate of drug delivery to the epithelium (Figure 11). A locally-acting drug that needs to be delivered over a long time scale may benefit from this reduced clearance. However, if quick systemic uptake is the main goal, then this variability could be greatly reduced by minimizing drug deposition in the NV. In Figure 11, the uptake rates within the first 3 minutes are independent of mucus velocity, indicating that drug deposited in the back of the nose is absorbed relatively quickly regardless of ciliary function. Thus, by reducing drug deposition in the front of the nose and increasing deposition in the MP, a fast systemic uptake may be achieved in spite of impaired mucociliary clearance.
Along the same lines, the variability in cumulative drug uptake in Figure 12 indicates that delivering a specific dose of drug using current nasal spray devices can be extremely difficult. Because most current nasal spray devices deposit a majority of the drug in the NV, the amount of drug that reaches the MP is highly dependent on both anatomical and behavioral differences between individuals (e.g. whether they wipe and/or blow their nose). As such, it may be beneficial to optimize nasal drug delivery devices to reduce deposition in the front of the nose; by depositing a larger fraction of drug in the MP, variability in drug absorption and dosage (Figure 12) may be reduced.
A study by Henning et al.69 looked at the effect of particle size and properties on airway mucus clearance. The study found that the size and zeta potential of particles have little effect on clearance rates, but surface chemistry can significantly affect particle clearance. Specifically, mucoadhesive particles, which form a gel and stick to the epithelial surface, were cleared much more slowly from the airways than other types of particles. Based on the findings by Henning et al.,69 a particle size correction term is not needed in the current model, and the results presented here are expected to realistically model the behavior of non-mucoadhesive particles. However, this CFD clearance model does not account for differences in surface chemistry, and assumes that particles move with the nasal mucus. As a next step, mucoadhesive effects could be incorporated into the current model by including a “drag” or velocity correction term in the particle transport equation; this term would be associated with the specific material properties of the particles (e.g. the degree of mucoadhesion). Alternatively, particle concentration could be used to modify local mucus velocity by creating regions of high viscosity that anchor to the epithelial layer and are surrounded by regions of less viscous, faster moving mucus.
Buttini et al.70 found that differences in the solution composition (e.g. ethanol content) of a pressurized metered dose inhaler (pMDI) had a significant effect on particle formation and drug dissolution rates. The current CFD model looks only at the dissolution and absorption for the active ingredient in a suspension MF formulation, and is not able to account for these subtle differences in solution composition. Through in vitro testing of nasal spray dissolution, an experimentally-determined correction factor (β) may be included in the Noyes-Whitney equation that would modify the particle dissolution rate for the specific formulation, i.e.,
| (3) |
where β could be determined experimentally for a variety of solution compositions, allowing for more accurate dissolution simulations.
As discussed, the current study did not account for factors associated with solution composition or unique material properties of the drug particles. However, the current CFD model is able to implement corrections for these types of properties, guided by in vitro experiments, and thereby simulate drug uptake for a wide range of formulations. Many in vitro methods are currently being used to obtain accurate dissolution rates for specific drugs and spray compositions. As discussed earlier in this study, Arora et al.39 looked at drug dissolution rates in a fixed volume of fluid, and examined the effects of formulation, particle size, and drug solubility. Another method employed by Bur et al.71 was able to show drug dissolution in a fluid film (representative of ASL) and the subsequent transport of this dissolved drug across pulmonary cell cultures. This method can provide realistic dissolution and absorption rates for various drug formulations in a human airway environment. Given the improving methods for in vitro dissolution testing, this type of experimental data can benefit CFD models (such as the one developed here) by providing more accurate, formulation-specific drug properties, thus enhancing validation studies and the predictions of both epithelial cell absorption and systemic exposure through blood absorption.
While the current CFD model advances the prediction capabilities for nasal drug absorption, it has several limitations. In addition to neglecting mucoadhesive effects and simplifying drug properties, the current model represents a simplified surface of the complex three dimensional nasal airways. This study also considered a monodisperse suspension size in a polydisperse spray aerosol; however, an actual suspension is likely to contain polydisperse solid particles within the spray droplets. While the current model is able to provide localized drug uptake information, it is unable to isolate specific regions of the nasal cavity. That is, in current form, the simplified surface model is unable to show if drug enters the sinuses or is deposited on the olfactory epithelium (which is a current area of research for drugs that cross the blood brain barrier72,73). Finally, the current model calculates the amount of drug that is absorbed by the epithelial cells, but does not provide specific pharmacokinetic data as it pertains to plasma concentration over time. This would require an additional step from the current absorption data.
An additional limitation of the model is the assumption of a continuous ASL height in the NV and MP regions. Currently the model implements a 7.5 μm ASL thickness with fluid injection in the MP, which maintains ASL height and drives clearance. Connection between the ASL in the NV and MP regions explains the long-term transport characteristics of the drug, which match the in vivo data. However, ASL conditions in the NV are expected to be highly variable. Nasal drainage may result in some ASL present in the NV. It should be realized that the aqueous nasal spray also provides a significant amount of liquid to the system, which largely deposits in the NV region. For the Nasonex product, two sprays per nostril are prescribed resulting in 0.4 ml of aqueous delivery solution. Considering the NV spray aerosol deposition fraction and NV surface area, uniform surface distribution of this liquid would result in a NV ASL height of 0.17 mm. Therefore, improvement in the ASL conditions in the NV may be needed for future in vivo comparisons. However, it is reasonable to assume that the NV is not dry during aqueous nasal spray administration and the ASL between the NV and MP is continuous.
Multiple studies have stressed the benefits of in vitro nasal models and in vivo imaging modalities in the development and assessment of nasal aerosol products.7,51,74 Taken together, these assessment techniques can be used to evaluate the effects of realistic nasal anatomy on regional aerosol deposition and absorption vs. clearance of the medication after deposition. As a result, these techniques are viewed as improvements upon standard in vitro nasal spray tests that are currently required for regulatory submission.74,75 The CFD-based model developed in the current study provides a new approach in the development and assessment of nasal aerosol products. In contrast with previous CFD simulations, the newly developed model considers both initial deposition locations and post-deposition transport of nasal aerosol products. As with all numerical models, frequent validations with experimental data are required for accurate model predictions. A practical application approach for the newly developed model in the advancement or assessment of a nasal aerosol product would be to first conduct additional model validations with limited in vitro deposition and in vivo clearance data. Bioadhesion and epithelial absorption in vitro experiments could also be conducted as needed. With continued model development and success, this in silico approach may evolve to a point where it replaces a majority of currently implemented in vitro and in vivo nasal aerosol device and formulation testing.
As a topic of future work, this computational model will be extended to look at the effect of particle size, drug solubility, and partition coefficient on local and total drug uptake rates. The data provided by this model can be used to optimize drug particle size, determine ideal spray deposition locations, or promote specific formulation properties based on the different delivery needs of various therapies. This model can also examine the effect of mucociliary clearance rates on drug absorption, providing better dosage recommendations for disease states (e.g. cystic fibrosis54). Finally, the current model will be extended to include more anatomical features for drug targeting (e.g. the sinuses), and will also include a pharmacokinetic model to assess drug bioavailability.
Acknowledgements
Dr. Geng Tian is gratefully acknowledged for his part in developing the NMT and nasal spray pump model during his time as a postdoc at Virginia Commonwealth University. This study was supported by Award U01 FD004570 and Contract HHSF223201310223C from the US FDA. The content is solely the responsibility of the authors and does not necessarily represent the official views of the US FDA.
Abbreviations
- 3D
three dimensional
- ASL
airway surface liquid
- CFD
computational fluid dynamics
- GCI
grid convergence index
- MP
middle passages
- MF
mometasone furoate
- NMT
nose-mouth-throat
- NP
nasopharynx
- NV
nasal vestibule
- PIFR
peak inspiratory flow rate
- PK
pharmacokinetic
- RSM
Reynolds stress model
Footnotes
Author Disclosure Statement
There are no conflicts of interest.
References
- 1.Costantino HR, Illum L, Brandt G, Johnson PH, and Quay SC: Intranasal Delivery: Physicochemical and Therapeutic Aspects. International Journal of Pharmaceutics. 2007;337(1–2):1–24. [DOI] [PubMed] [Google Scholar]
- 2.Hussain AA: Intranasal Drug Delivery. Advanced Drug Delivery Reviews. 1998;29(1–2):39–49. [DOI] [PubMed] [Google Scholar]
- 3.Turker S, Onur E, and Ozer Y: Nasal Route and Drug Delivery Systems. Pharmacy World and Science. 2004;26(3):137–142. [DOI] [PubMed] [Google Scholar]
- 4.Arora P, Sharma S, and Garg S: Permeability Issues in Nasal Drug Delivery. Drug Discovery Today. 2002;7(18):967–975. [DOI] [PubMed] [Google Scholar]
- 5.Illum L: Nasal Drug Delivery: New Developments and Strategies. Drug Discovery Today. 2002;7(23):1184–1189. [DOI] [PubMed] [Google Scholar]
- 6.Suman JD, Laube BL, and Dalby R: Comparison of Nasal Deposition and Clearance of Aerosol Generated by a Nebulizer and an Aqueous Spray Pump. Pharmaceutical Research. 1999;16(10):1648–1652. [DOI] [PubMed] [Google Scholar]
- 7.Laube BL: Devices for Aerosol Delivery to Treat Sinusitis. Journal of Aerosol Medicine. 2007;20 Suppl 1(1):S5–S18. [DOI] [PubMed] [Google Scholar]
- 8.Liu Y, Matida EA, and Johnson MR: Experimental Measurements and Computational Modeling of Aerosol Deposition in the Carleton-Civic Standardized Human Nasal Cavity. Journal of Aerosol Science. 2010;41(6):569–586. [Google Scholar]
- 9.Inthavong K, Ge Q, Se CMK, Yang W, and Tu JY: Simulation of Sprayed Particle Deposition in a Human Nasal Cavity Including a Nasal Spray Device. Journal of Aerosol Science. 2011;42(2):100–113. [Google Scholar]
- 10.Shah SA, Dickens CJ, Ward DJ, Banaszek AA, George C, and Horodnik W: Design of Experiments to Optimize an In Vitro Cast to Predict Human Nasal Drug Deposition. Journal of Aerosol Medicine and Pulmonary Drug Delivery. 2014;26(0):1–9. [DOI] [PubMed] [Google Scholar]
- 11.Fry FA and Black A: Regional Deposition and Clearance of Particles in the Human Nose. Journal of Aerosol Science. 1973;4(2):113–124. [Google Scholar]
- 12.Proctor DF and Lundqvist G: Clearance of Inhaled Particles from the Human Nose. Archives of Internal Medicine. 1973;131(1):132–139. [PubMed] [Google Scholar]
- 13.Schipper NGM, Verhoef JC, and Merkus FWHM: The Nasal Mucociliary Clearance: Relevance to Nasal Drug Delivery. Pharmaceutical Research. 1991;8(7):807–814. [DOI] [PubMed] [Google Scholar]
- 14.Beule AG: Physiology and Pathophysiology of the Paranasal Sinuses. GMS Current Topics in Otorhinolaryngology - Head and Neck Surgery. 2010;9. [DOI] [PMC free article] [PubMed] [Google Scholar]
- 15.Davis SS and Illum L: Absorption Enhancers for Nasal Drug Delivery. Clinical Pharmacokinetics. 2003;42(13):1107–1128. [DOI] [PubMed] [Google Scholar]
- 16.Illum L: Nasal Drug Delivery - Possibilities, Problems and Solutions. Journal of Controlled Release. 2003;87(1–3):187–198. [DOI] [PubMed] [Google Scholar]
- 17.Mistry A, Stolnik S, and Illum L: Nanoparticles for Direct Nose-to-Brain Delivery of Drugs. International Journal of Pharmaceutics. 2009;379(1–2):146–157. [DOI] [PubMed] [Google Scholar]
- 18.Pereswetoff-Morath L: Microspheres as Nasal Drug Delivery Systems. Advanced Drug Delivery Reviews. 1998;29(1–2):185–194. [DOI] [PubMed] [Google Scholar]
- 19.Ugwoke MI, Agu RU, Verbeke N, and Kinget R: Nasal Mucoadhesive Drug Delivery: Background, Applications, Trends and Future Perspectives. Advanced Drug Delivery Reviews. 2005;57(11):1640–1665. [DOI] [PubMed] [Google Scholar]
- 20.Schroeter JD, Kimbell JS, and Asgharian B: Analysis of Particle Deposition in the Turbinate and Olfactory Regions Using a Human Nasal Computational Fluid Dynamics Model. Journal of Aerosol Medicine. 2006;19(3):301–313. [DOI] [PubMed] [Google Scholar]
- 21.Shi H, Kleinstreuer C, and Zhang Z: Modeling of Inertial Particle Transport and Deposition in Human Nasal Cavities with Wall Roughness. Journal of Aerosol Science. 2007;38(4):398–419. [Google Scholar]
- 22.Schroeter JD, Garcia GJM, and Kimbell JS: Effects of Surface Smoothness on Inertial Particle Deposition in Human Nasal Models. Journal of Aerosol Science. 2011;42(1):52–63. [DOI] [PMC free article] [PubMed] [Google Scholar]
- 23.Xi J, Si X, Kim JW, and Berlinski A: Simulation of Airflow and Aerosol Deposition in the Nasal Cavity of a 5-Year-Old Child. Journal of Aerosol Science. 2011;42(3):156–173. [Google Scholar]
- 24.Kelly JT, Asgharian B, Kimbell JS, and Wong Ba: Particle Deposition in Human Nasal Airway Replicas Manufactured by Different Methods. Part I: Inertial Regime Particles. Aerosol Science and Technology. 2004;38(11):1063–1071. [Google Scholar]
- 25.Kelly JT, Asgharian B, Kimbell JS, and Wong Ba: Particle Deposition in Human Nasal Airway Replicas Manufactured by Different Methods. Part II: Ultrafine Particles. Aerosol Science and Technology. 2004;38(11):1072–1079. [Google Scholar]
- 26.Garcia GJM, Tewksbury EW, Wong Ba, and Kimbell JS: Interindividual Variability in Nasal Filtration as a Function of Nasal Cavity Geometry. Journal of Aerosol Medicine and Pulmonary Drug Delivery. 2009;22(2):139–155. [DOI] [PubMed] [Google Scholar]
- 27.Shah SA, Berger RL, McDermott J, Gupta P, Monteith D, Connor A, and Lin W: Regional Deposition of Mometasone Furoate Nasal Spray Suspension in Humans. Allergy and Asthma Proceedings. 2015;36(1):48–57. [DOI] [PubMed] [Google Scholar]
- 28.Kimbell JS and Subramaniam RP: Use of Computational Fluid Dynamics Models for Dosimetry of Inhaled Gases in the Nasal Passages. Inhalation Toxicology. 2001;13(5):325–334. [DOI] [PubMed] [Google Scholar]
- 29.Zhang Z, Kleinstreuer C, and Kim CS: Transport and Uptake of MTBE and Ethanol Vapors in a Human Upper Airway Model. Inhalation Toxicology. 2006;18(3):169–184. [DOI] [PubMed] [Google Scholar]
- 30.Tian G and Longest PW: Application of a New Dosimetry Program TAOCS to Assess Transient Vapour Absorption in the Upper Airways. Inhalation Toxicology. 2010;22(13):1047–1063. [DOI] [PubMed] [Google Scholar]
- 31.Tian G and Longest PW: Development of a CFD Boundary Condition to Model Transient Vapor Absorption in the Respiratory Airways. Journal of Biomechanical Engineering. 2010;132(5):051003. [DOI] [PubMed] [Google Scholar]
- 32.Tian G and Longest PW: Transient Absorption of Inhaled Vapors into a Multilayer Mucus-Tissue-Blood System. Annals of Biomedical Engineering. 2010;38(2):517–536. [DOI] [PubMed] [Google Scholar]
- 33.Hardy J, Lee S, and Wilson C: Intranasal Drug Delivery by Spray and Drops. Journal of Pharmacy and Pharmacology. 1985;37(5):294–297. [DOI] [PubMed] [Google Scholar]
- 34.Djupesland PG, Skretting A, Winderen M, and Holand T: Breath Actuated Device Improves Delivery to Target Sites Beyond the Nasal Valve. The Laryngoscope. 2006;116(3):466–472. [DOI] [PubMed] [Google Scholar]
- 35.Wang SM, Inthavong K, Wen J, Tu JY, and Xue CL: Comparison of Micron- and Nanoparticle Deposition Patterns in a Realistic Human Nasal Cavity. Respiratory Physiology and Neurobiology. 2009;166(3):142–151. [DOI] [PubMed] [Google Scholar]
- 36.Kimbell JS, Segal RA, Asgharian B, Wong BA, Schroeter JD, Southall JP, Dickens CJ, Brace G, and Miller FJ: Characterization of Deposition from Nasal Spray Devices Using a Computational Fluid Dynamics Model of the Human Nasal Passages. Journal of Aerosol Medicine. 2007;20(1):59–74. [DOI] [PubMed] [Google Scholar]
- 37.Bush ML, Frederick CB, Kimbell JS, and Ultman JS: A CFD PBPK Hybrid Model for Simulating Gas and Vapor Uptake in the Rat Nose. Toxicology and Applied Pharmacology. 1998;150(1):133–145. [DOI] [PubMed] [Google Scholar]
- 38.Azimi M, Longest PW, and Hindle M: Towards Clinically Relevant In Vitro Testing of Locally Acting Nasal Spray Suspension Products. Respiratory Drug Delivery Europe. 2015; [Google Scholar]
- 39.Arora D, Shah KA, Halquist MS, and Sakagami M: In vitro Aqueous Fluid-Capacity-Limited Dissolution Testing of Respirable Aerosol Drug Particles Generated from Inhaler Products. Pharmaceutical Research. 2010;27(5):786–795. [DOI] [PubMed] [Google Scholar]
- 40.Quraishi MS, Jones NS, and Mason J: The Rheology of Nasal Mucus: A Review. Clinical Otolaryngology & Allied Sciences. 1998;23(5):403–413. [DOI] [PubMed] [Google Scholar]
- 41.Merck: Nasonex Product Monograph. http://www.merck.ca/assets/en/pdf/products/NASONEX-PM_E.pdf.
- 42.Guilmette RA, Wicks JD, and Wolff RK: Morphometry of Human Nasal Airways in vivo Using Magnetic Resonance Imaging. Journal of Aerosol Medicine. 1989;2(4):365–377. [Google Scholar]
- 43.Xi J and Longest PW: Numerical Predictions of Submicrometer Aerosol Deposition in the Nasal Cavity Using a Novel Drift Flux Approach. International Journal of Heat and Mass Transfer. 2008;51(23–24):5562–5577. [Google Scholar]
- 44.Longest PW, Tian G, and Hindle M: Improving the Lung Delivery of Nasally Administered Aerosols During Noninvasive Ventilation—An Application of Enhanced Condensational Growth (ECG). Journal of Aerosol Medicine and Pulmonary Drug Delivery. 2011;24(2):103–118. [DOI] [PMC free article] [PubMed] [Google Scholar]
- 45.Golshahi L, Tian G, Azimi M, Son Y-J, Walenga R, Longest PW, and Hindle M: The Use of Condensational Growth Methods for Efficient Drug Delivery to the Lungs During Noninvasive Ventilation High Flow Therapy. Pharmaceutical Research. 2013;30(11):2917–2930. [DOI] [PMC free article] [PubMed] [Google Scholar]
- 46.Shi H, Kleinstreuer C, and Zhang Z: Laminar Airflow and Nanoparticle or Vapor Deposition in a Human Nasal Cavity Model. Journal of Biomechanical Engineering. 2006;128(5):697–706. [DOI] [PubMed] [Google Scholar]
- 47.Walenga RL, Tian G, Hindle M, Yelverton J, Dodson K, and Longest PW: Variability in Nose-to-Lung Aerosol Delivery. Journal of Aerosol Science. 2014;78:11–29. [DOI] [PMC free article] [PubMed] [Google Scholar]
- 48.Pires Ai, Fortuna A, Alves G, and Fal1 ao Ai: Intranasal Drug Delivery: How, Why and What For? Journal of Pharmacy and Pharmaceutical Sciences. 2009;12(3):288–311. [DOI] [PubMed] [Google Scholar]
- 49.Patton JS, Brain JD, Davies La, Fiegel J, Gumbleton M, Kim K-J, Sakagami M, Vanbever R, and Ehrhardt C: The Particle has Landed - Characterizing the Fate of Inhaled Pharmaceuticals. Journal of Aerosol Medicine and Pulmonary Drug Delivery. 2010;23, Supple:S71–S87. [DOI] [PubMed] [Google Scholar]
- 50.Longest PW and Hindle M: Evaluation of the Respimat Soft Mist Inhaler Using a Concurrent CFD and in vitro Approach. Journal of Aerosol Medicine and Pulmonary Drug Delivery. 2009;22(2):99–112. [DOI] [PubMed] [Google Scholar]
- 51.Djupesland PG: Nasal Drug Delivery Devices: Characteristics and Performance in a Clinical Perspective - A Review. Drug Delivery and Translational Research. 2013;3(1):42–62. [DOI] [PMC free article] [PubMed] [Google Scholar]
- 52.Djupesland PG and Skretting A: Nasal Deposition and Clearance in Man: Comparison of a Bidirectional Powder Device and a Traditional Liquid Spray Pump. Journal of Aerosol Medicine and Pulmonary Drug Delivery. 2012;25(5):280–289. [DOI] [PubMed] [Google Scholar]
- 53.Rogers D: Airway Goblet Cells: Responsive and Adaptable Front-Line Defenders. European Respiratory Journal. 1994;7(9):1690–1706. [PubMed] [Google Scholar]
- 54.Tarran R, Donaldson S, and Boucher RC: Rationale for Hypertonic Saline Therapy for Cystic Fibrosis Lung Disease. Seminars in Respiratory and Critical Care Medicine. 2007;28(3):295–302. [DOI] [PubMed] [Google Scholar]
- 55.Jafek BW: Ultrastructure of Human Nasal Mucosa. Laryngoscope. 1983;93:1576–1599. [DOI] [PubMed] [Google Scholar]
- 56.Mestecky J, Lamm ME, Ogra PL, Strober W, Bienenstock J, McGhee JR, and Mayer L: Mucosal Immunology. (Academic Press; ), pp. 43–64, 2005. [Google Scholar]
- 57.Lai SK, Wang YY, Wirtz D, and Hanes J: Micro- and Macrorheology of Mucus. Advanced Drug Delivery Reviews. 2009;61(2):86–100. [DOI] [PMC free article] [PubMed] [Google Scholar]
- 58.Puchelle E, Zahm J, and Quemada D: Rheological Properties Controlling Mucociliary Frequency and Respiratory Mucus Transport. Biorheology. 1986;24(6):557–563. [DOI] [PubMed] [Google Scholar]
- 59.Cu Y and Saltzman WM: Mathematical Modeling of Molecular Diffusion Through Mucus. Advanced Drug Delivery Reviews. 2009;61(2):101–114. [DOI] [PMC free article] [PubMed] [Google Scholar]
- 60.Gulliver JS: Introduction to Chemical Transport in the Environment. Cambridge University Press, 2007. [Google Scholar]
- 61.Sugano K, Okazaki A, Sugimoto S, Tavornvipas S, Omura A, and Mano T: Solubility and Dissolution Profile Assessment in Drug Discovery. Drug Metabolism and Pharmacokinetics. 2007;22(4):225–254. [DOI] [PubMed] [Google Scholar]
- 62.FDA: Nasonex Product Information. http://www.accessdata.fda.gov/drugsatfda_docs/label/2002/20762s11lbl.pdf.
- 63.Roache PJ: Perspective: A Method for Uniform Reporting of Grid Refinement Studies. Journal of Fluids Engineering. 1994;116(3):405–413. [Google Scholar]
- 64.Gehr P, Schürch S, Berthiaume Y, HOF VI, and Geiser M: Particle Retention in Airways by Surfactant. Journal of Aerosol Medicine. 1990;3(1):27–43. [Google Scholar]
- 65.Hubal EA, Fedkiw PS, and Kimbell JS: Mass-Transport Models to Predict Toxicity of Inhaled Gases in the Upper Respiratory Tract. Journal of Applied Physiology. 1996;80(4):1415–1427. [DOI] [PubMed] [Google Scholar]
- 66.Schroeter JD, Kimbell JS, Bonner AM, Roberts KC, Andersen ME, and Dorman DC: Incorporation of Tissue Reaction Kinetics in a Computational Fluid Dynamics Model for Nasal Extraction of Inhaled Hydrogen Sulfide in Rats. Toxicological Sciences. 2006;90(1):198–207. [DOI] [PubMed] [Google Scholar]
- 67.Schroeter JD, Kimbell JS, Andersen ME, and Dorman DC: Use of a Pharmacokinetic-Driven Computational Fluid Dynamics Model to Predict Nasal Extraction of Hydrogen Sulfide in Rats and Humans. Toxicological Sciences. 2006;94(2):359–367. [DOI] [PubMed] [Google Scholar]
- 68.Corley RA, Kabilan S, Kuprat AP, Carson JP, Jacob RE, Minard KR, Teeguarden JG, Timchalk C, Pipavath S, and Glenny R: Comparative Risks of Aldehyde Constituents in Cigarette Smoke Using Transient Computational Fluid Dynamics/Physiologically Based Pharmacokinetic Models of the Rat and Human Respiratory Tracts. Toxicological Sciences. 2015:kfv071. [DOI] [PMC free article] [PubMed] [Google Scholar]
- 69.Henning A, Schneider M, Nafee N, Muijs L, Rytting E, Wang X, Kissel T, Grafahrend D, Klee D, and Lehr C-M: Influence of Particle Size and Material Properties on Mucociliary Clearance from the Airways. Journal of Aerosol Medicine and Pulmonary Drug Delivery. 2010;23(4):233–241. [DOI] [PubMed] [Google Scholar]
- 70.Buttini F, Miozzi M, Balducci AG, Royall PG, Brambilla G, Colombo P, Bettini R, and Forbes B: Differences in Physical Chemistry and Dissolution Rate of Solid Particle Aerosols from Solution Pressurised Inhalers. International Journal of Pharmaceutics. 2014;465(1):42–51. [DOI] [PubMed] [Google Scholar]
- 71.Bur M, Huwer H, Muys L, and Lehr C-M: Drug Transport Across Pulmonary Epithelial Cell Monolayers: Effects of Particle Size, Apical Liquid Volume, and Deposition Technique. Journal of Aerosol Medicine and Pulmonary Drug Delivery. 2010;23(3):119–127. [DOI] [PubMed] [Google Scholar]
- 72.Illum L: Transport of Drugs from the Nasal Cavity to the Central Nervous System. European Journal of Pharmaceutical Sciences. 2000;11(1):1–18. [DOI] [PubMed] [Google Scholar]
- 73.Hanson LR and Frey WH: Intranasal Delivery Bypasses the Blood-Brain Barrier to Target Therapeutic Agents to the Central Nervous System and Treat Neurodegenerative Disease. BMC Neuroscience. 2008;9 Suppl 3:S5. [DOI] [PMC free article] [PubMed] [Google Scholar]
- 74.Suman JD, Laube BL, and Dalby R: Validity of in vitro Tests on Aqueous Spray Pumps as Surrogates for Nasal Deposition, Absorption, and Biologic Response. Journal of Aerosol Medicine. 2006;19(4):510–521. [DOI] [PubMed] [Google Scholar]
- 75.Li BV, Jin F, Lee SL, Bai T, Chowdhury B, Caramenico HT, and Conner DP: Bioequivalence for Locally Acting Nasal Spray and Nasal Aerosol Products: Standard Development and Generic Approval. The AAPS Journal. 2013;15(3):875–883. [DOI] [PMC free article] [PubMed] [Google Scholar]