

Abstract
Objectives
To assess the trend and decompose the determinants of delivery with no one present (NOP) at birth with an in-depth subnational analysis in Nigeria.
Design
Cross-sectional.
Setting
Nigeria, with five waves of nationally representative data in 1990, 2003, 2008, 2013 and 2018.
Participants
Women with at least one childbirth within 5 years preceding each wave of data collection.
Primary and secondary outcome measures
The outcome of interest is giving birth with NOP at delivery defined as childbirth assisted by no one. Data were analysed using Χ2 and multivariate decomposition analyses at a 5% significance level.
Results
The prevalence of having NOP at delivery was 15% over the studied period, ranges from 27% in 1990 to 11% in 2018. Overall, the prevalence of having NOP at delivery reduced significantly by 35% and 61% within 2003–2018 and 1990–2018, respectively (p<0.001). We found wide variations in NOP across the states in Nigeria. The highest NOP practice was in Zamfara (44%), Kano (40%) and Katsina (35%); while the practice was 0.1% in Bayelsa, 0.8% in Enugu, 0.9% in Osun and 1.1% in Imo state. The decomposition analysis of the changes in having NOP at delivery showed that 85.4% and 14.6% were due to differences in women’s characteristics (endowment) and effects (coefficient), respectively. The most significant contributions to the changes were the decision-maker of healthcare utilisation (49%) and women educational status (24%). Only Gombe experienced a significant increase (p<0.05) in the level of having NOP between 2003 and 2018.
Conclusion
A long-term decreasing secular trend of NOP at delivery was found in Nigeria. NOP is more prevalent in the northern states than in the south. Achieving zero prevalence of NOP at delivery in Nigeria would require a special focus on healthcare utilisation, enhancing maternal education and healthcare utilisation decision-making power.
Keywords: public health, health policy, epidemiology, general medicine (see internal medicine)
Strengths and limitations of this study.
The findings are generalisable and timely as the sample was nationally representative of the Nigerian population.
Our study is novel in addressing the neglected but important subpopulation group that are at greater risk of adverse maternal outcomes.
Sampling weights were applied to account for differentials in population sizes of each state.
We used cross-sectional data which limited our choice of explanatory variables and only established association but not causality.
Recall bias might have set in as some respondents may not recall past events accurately.
Background
The third theme of the United Nations Sustainable Development Goals (SDGs 3) seeks to ensure healthy lives and promote well-being for all.1 Two of the crucial targets to achieve this goal are to, by 2030, reduce the global maternal mortality ratio (MMR) to less than 70 per 100 000 live births and end preventable deaths of newborns and children under 5 years of age. Central to these targets is the call for the reduction in neonatal mortality and under-5 mortality to at least as low as 12 per 1000 and 25 per 1000 live births, respectively, across countries.1 Additionally, the WHO had advocated an increase in the proportion of births attended by skilled birth attendants (SBAs) (doctor, nurse or midwife).2 The presence of SBAs is vital to reducing maternal deaths and other unacceptable pregnancy and birth outcomes because of their proficiency in the skills needed to manage women during pregnancies, childbirth and postnatal period, including identification, management and referral of pregnancy-related complications.3 However, this has been a difficult task to achieve in sub-Saharan Africa (SSA) including Nigeria as the MMR has remained higher than the global average.
Maternal mortality and other adverse pregnancy outcomes remain a public health challenge and the burden is highest in SSA with 66% of global maternal deaths.4 The lifetime risk of a woman experiencing maternal death in SSA is 1 in 22 compared with 1 in 4900 in developed countries.5 Nigeria is among the top six countries of the world that contribute to more than 50% of global maternal death. Estimates from numerous studies conducted to ascertain the state of MMR in Nigeria showed that it ranges from 545 per 100 000 to 917 per 100 000 live births.3 6 7 High maternal death has been recognised to impact negatively on pregnancy outcomes, child survival and overall health of the family. However, adequate use of SBAs could improve these indicators. Research has documented that MMR and other delivery outcomes are better when SBAs are present at delivery.8–11 The outcomes of a systematic analysis of 181 countries by Hogan et al showed that the presence of SBAs contributed to a massive reduction in MMR globally between 1980 and 2008.12
In Nigeria as well as most SSA countries, the coverage of SBAs is less than 50% as most deliveries occur without SBAs or with attendants with limited skill and outside the health facilities. The proportion of women delivering alone with no one present (NOP) is particularly worrisome and is contrary to the WHO’s advocate for the presence of skilled personnel at every birth.13 In a survey by Doctor et al in Northern Nigeria, 86% of women delivered their babies at home with no skilled attendant.14 In another study in Southwest Nigeria, over 50% of deliveries were at home with NOP at birth.15 These births are mostly done by unskilled personnel and under unhygienic conditions with unsterilised equipment, exposing the woman and baby to risk of infections, birth complications and death.14 16 17 In Nigeria, differences in the level of NOP at delivery across the states have been reported.18–22
Austin et al16 have reported that women’s age, household wealth quintile, educational attainment, parity, religion and place of residence were significantly associated with NOP at delivery in Nigeria. Similarly, other studies have identified limited physical access to quality care, and residing in a household with no resources to afford care, religious practices, polygamy, women’s empowerment, maternal age, education and parity could greatly increase NOP.23–27 Women who were involved in decisions on their healthcare utilisation and use of antenatal care (ANC) services have been associated with NOP at delivery.25–27
While it is worse enough not to get help at delivery from SBAs as recommended by the WHO, the worst situation is having NOP at deliveries. The authors support the WHO guideline that all deliveries should be assisted by SBAs28 and this study was not to advocate otherwise. However, we were motivated to carry out this study by the proportion of deliveries with NOP in Nigeria. With one in every nine pregnant women in Nigeria having NOP at delivery, nearly 800 000 of the annual 7 million childbirths in the country are with NOP.29 This has made such women the most vulnerable of all vulnerable pregnant women in Nigeria.
The goal of this paper was to assess the trend in women delivering with NOP and explores factors that crossed individual, household, cultural and societal levels using five waves of the Nigeria Demographic Health Survey (NDHS). We evaluated changes in NOP at delivery from one period to another and across the period, and determined the contribution of these factors to the overall changes. The strength of this paper compared with previous related studies conducted in Nigeria is its ability to examine the trend in NOP using five waves of data (1990–2018) and simultaneously decomposed factors contributing to its changes over the period. It also assessed subnational analysis. Our findings of the level, trend and changes in NOP at delivery and the factors contributing to the changes and gaps will provide information for maternal healthcare programming with the view to attaining the SDG 31 in Nigeria.
Methods
Data
We used secondary data extracted from five successive NDHS conducted in 1990, 2003, 2008, 2013 and 2018.18–22 The NDHS is cross-sectional, population-based and nationally representative in design. The respondents were women aged 15–49 years. However, our analysis was restricted to respondents who reported at least one birth delivery within 5 years preceding each of the surveys. Geographically, Nigeria is divided into six geopolitical zones (regions), and these regions are further subdivided into states and Federal Capital Territory (FCT) for administrative purposes. As of 1990, Nigeria has 21 states. These were then divided and grouped into 30 states and the FCT in 1991. Additional six states were created in 1996 which resulted in the present number of 36 states (figure 1).
Figure 1.

Map of Nigeria showing the 36 states and the Federal Capital Territory, by the geopolitical zones.
Sampling procedure
A multistage cluster sampling technique was used where the clusters are the primary sampling unit. Local government areas (LGAs) were selected from each state and FCT in the first stage. Enumeration areas were then extracted from each LGA at the second stage, and households and household representatives were randomly selected for questioning in the last stage. For further details on the sampling methodology, please visit wwwdhsprogramcom. In all, 8781, 7620, 33 385, 38 984 and 41 821 women participated in 1990, 2003, 2008, 2013 and 2018, respectively.18–22 We used the data on the delivery of the last pregnant by any of these respondents within 5 years preceding the surveys. A total of 4874, 3761, 17 920, 20 100 and 21 792 eligible deliveries for 1990, 2003, 2008, 2013 and 2018 NDHS, respectively, were included in this study.
Outcome variable
The outcome variable was whether a birth delivery was assisted or not irrespective of who offered the assistance. The reported birth delivery assistants by the respondents are skilled (doctors, nurses and midwives), unskilled (traditional, community health worker, auxiliary nurses, family, friends) and having NOP at delivery.16–22 The outcome was categorised as NOP at delivery versus anyone present.
Explanatory variables
The explanatory variables used in this study consist of individual, household, community and societal factors. They were identified based on extensive literature search and review.16–19 21 22 Andersen behavioural model and healthcare utilisation30 was also used. In addition, we adopted and enlarged the behavioural–ecological framework of healthcare access and navigation to select the explanatory variables in this study.31 The variables are the following:
Demographic, cultural and societal factors: maternal age (15–24, 25–34, 35–49 years), mothers’/partners’ education (none, primary, secondary, tertiary), sex of household head (male, female), marital status (never married, cohabiting, married), and respondents’ and partners’ employment status.
Women health benefit/NOP purpose: wanted pregnancy (then, never, later), the sufficiency of ANC visit (none, <4, 4+ visits), health insurance (yes/no), birth order (1, 2, 3, 4 and 5), birth interval (first birth, <36 months, 36+ months).
Economic/household factors: mother/spouse work (unemployed, employed), household social economic status (poorest, poorer, average, richer, richest), media access (yes, no).
Corporal convenience: physical distance to healthcare centre (distance is a problem, distance is not a problem), who decides respondents’ healthcare use (self alone, spouse alone, jointly), getting permission for healthcare (a big problem, not a problem), family mobility expressed as years lived at place of residence (less than 5 years, more than 5 years).
Community factors: community illiteracy level (low (<50%), high), community unemployment level (low (<50%), high), community poverty level (low (<50%), high), community media inaccessibility level (low (<50%), high), community social economic status (SES) disadvantaged (least, 2, 3, 4, most), residential area (urban, rural) as used in earlier studies.32–34
Societal factors: percentage of the rural population (low (<50%), high) as described in the NDHS reports,16–22 ethnic group (Hausa, Igbo, Yoruba), religion (Islam, Christianity, traditional), geopolitical zone (north-central, northeast, northwest, south-south, southeast, southwest).
Statistical analysis
We used descriptive statistics to report the frequency distribution and prevalence of NOP at delivery as well as its percentage changes by the explanatory characteristics and state of residence. We examined trends in NOP at delivery for 1990–2003, 2003–2008, 2008–2013, 2013–2018, 2003–2018 and 1990–2018. The Χ2 analysis for trend was used to identify the significant changes across multiple time points. Multivariate decomposition analysis (MDA) was employed to decompose changes in NOP at delivery between 2003 and 2018. Data management and analysis were conducted using Stata V.16.0, R statistical software and Power BI were used for the visualisations. Samples were weighted using weighting factors included in the NDHS data to account for unequal group sizes, and all significance tests were at 5%.
The MDA
The MDA allows the quantification of the contributions of different factors to changes in outcome measurements over two time points or among two groups of people with different outcomes. Unlike the logistic regressions that identify the odds of an event occurring, the MDA uses different models including the logistic regression to identify the contributions of explanatory variables to the differentials in the probability of events occurring in different groups. In which case, the groups are mutually exclusive. In the decomposition analysis, we excluded 1990 data and considered only 2003–2018, as there were only 19 states in Nigeria as of 1990 and thereby would disallow full comparison across the current 36 states in Nigeria. The difference in respondents’ NOP at delivery is the response variable, 2003 constituted a ‘group’ while 2018 is another ‘group’, while predictor effects were partitioned into differences in characteristics (endowment) and differences in the effects (coefficient) in the regression decomposition.35 This enables the identification of the root of changes in NOP between 2003 and 2018 and evaluates how changes in NOP at delivery were affected by the explanatory characteristics.
The MDA technique is an improvement of the Oaxaca-Blinder decomposition,36 37 which has been extended to handle non-linear models including logit and probit models.35 38 In this study, the decomposition of the difference in the factors influencing NOP at delivery is a function of a linear combination of the predictors and regression coefficients and can be in general, additively decomposed into:
| (1) |
| (2) |
| (3) |
where Y is the n by 1 vector of the dependent variable, 0≤p≤1, X is the n by k matrices of the independent variables and β is the k by 1 vector of the regression coefficients in equation (1). The difference in the proportion of respondents with NOP was decomposed in equation (2) into two parts. In equation (3), the component {F()–F()} is the differential attributable to differences in endowment (otherwise called the explained component), while {F()–F()} is the differential attributable to differences in coefficients (unexplained component). Also, denotes the proportion of respondents with NOP at delivery (comparison group), while denotes the proportion of respondents with someone present at delivery (reference group). The method has been used elsewhere.39
Results
The distribution of the respondents’ characteristics is shown in table 1. In all, 26% were aged 15–24 years, while 47% were aged 25–34 years. The distribution of respondents by their states of residents and the survey years is shown in online supplemental file 1.
Table 1.
Distribution of mothers’ background characteristics by survey years
| Characteristics | 1990 | 2003 | 2008 | 2013 | 2018 | All |
| n | 4874 | 3761 | 17 920 | 20 100 | 21 792 | 68 447 |
| Respondent’s current age | % | % | % | % | % | |
| 15–24 | 1399 (28.7) | 1083 (28.8) | 4713 (26.3) | 5186 (25.8) | 5426 (24.9) | 17 807 (25.9) |
| 25–34 | 2340 (48) | 1756 (46.7) | 8333 (46.5) | 9387 (46.7) | 10 242 (47) | 32 058 (46.8) |
| 35–49 | 1136 (23.3) | 925 (24.6) | 4874 (27.2) | 5528 (27.5) | 6124 (28.1) | 18 586 (27.3) |
| Highest educational level | ||||||
| No education | 3114 (63.9) | 1877 (49.9) | 8799 (49.1) | 9427 (46.9) | 9654 (44.3) | 32 871 (47.7) |
| Primary | 1136 (23.3) | 910 (24.2) | 4032 (22.5) | 4020 (20) | 3378 (15.5) | 13 476 (19.2) |
| Secondary+ | 624 (12.8) | 974 (25.9) | 5089 (28.4) | 6633 (33) | 8739 (40.1) | 22 059 (33.2) |
| Husband/partner’s education level | ||||||
| No education | 2690 (55.2) | 1501 (39.9) | 7401 (41.3) | 7819 (38.9) | 7867 (36.1) | 27 278 (39.6) |
| Primary | 1204 (24.7) | 914 (24.3) | 3727 (20.8) | 3779 (18.8) | 3116 (14.3) | 12 740 (18.1) |
| Secondary+ | 980 (20.1) | 1346 (35.8) | 6774 (37.8) | 8502 (42.3) | 10 809 (49.6) | 28 411 (42.3) |
| Location | ||||||
| Urban | 1540 (31.6) | 1305 (34.7) | 4767 (26.6) | 6633 (33) | 7562 (34.7) | 21 807 (31.9) |
| Rural | 3334 (68.4) | 2456 (65.3) | 13 153 (73.4) | 13 467(67) | 14 230 (65.3) | 46 640 (68.1) |
| Employment status | ||||||
| Employed | 3144 (64.5) | 2392 (63.6) | 11 594 (64.7) | 13 909 (69.2) | 14 862 (68.2) | 45 901 (66.9) |
| Unemployed | 1730 (35.5) | 1369 (36.4) | 6326 (35.3) | 6191 (30.8) | 6930 (31.8) | 22 546 (33.1) |
| Spouse employment status | ||||||
| Employed | 4816 (98.8) | 3746 (99.6) | 17 705 (98.8) | 19 799 (98.5) | 21 095 (96.8) | 67 160 (97.9) |
| Unemployed | 58 (1.2) | 15 (0.4) | 215 (1.2) | 302 (1.5) | 697 (3.2) | 1287 (2.1) |
| Sex of household head | ||||||
| Male | 4547 (93.3) | 3407 (90.6) | 16 092 (89.8) | 17 869 (88.9) | 19 504 (89.5) | 61 420 (89.8) |
| Female | 327 (6.7) | 354 (9.4) | 1828 (10.2) | 2231 (11.1) | 2288 (10.5) | 7027 (10.2) |
| Marital status | ||||||
| Never married | 39 (0.8) | 98 (2.6) | 448 (2.5) | 523 (2.6) | 610 (2.8) | 1718 (2.5) |
| Living with spouse | 4674 (95.9) | 3513 (93.4) | 16 934 (94.5) | 18 954 (94.3) | 20 419 (93.7) | 64 495 (94.2) |
| Formerly | 161 (3.3) | 154 (4.1) | 538(3) | 623 (3.1) | 763 (3.5) | 2238 (3.3) |
| Media access | ||||||
| No | na | 1478 (39.3) | 8315 (46.4) | 10 854 (54) | 13 010 (59.7) | 33 657 (53.8) |
| Yes | na | 2283 (60.7) | 9605 (53.6) | 9246(46) | 8782 (40.3) | 29 916 (46.2) |
| Wealth index | ||||||
| Poorest | 1102 (22.6) | 854 (22.7) | 4731 (26.4) | 4563 (22.7) | 5143 (23.6) | 16 392 (24.1) |
| Poorer | 1102 (22.6) | 809 (21.5) | 4193 (23.4) | 4623 (23) | 4947 (22.7) | 15 673 (22.9) |
| Middle | 677 (13.9) | 763 (20.3) | 3512 (19.6) | 4000 (19.9) | 4576 (21) | 13 530 (19.9) |
| Richer | 877 (18) | 707 (18.8) | 3046 (17) | 3739 (18.6) | 3944 (18.1) | 12 314 (17.9) |
| Richest | 1111 (22.8) | 628 (16.7) | 2473 (13.8) | 3176 (15.8) | 3160 (14.5) | 10 548 (15.2) |
| Number of antenatal visits during pregnancy | ||||||
| None | 1920 (39.4) | 1275 (33.9) | 7007 (39.1) | 6935 (34.5) | 5448 (25) | 22 585 (31.9) |
| Inadequate | 531 (10.9) | 542 (14.4) | 1953 (10.9) | 2533 (12.6) | 3814 (17.5) | 9372 (14.2) |
| Adequate | 2422 (49.7) | 1941 (51.6) | 8942 (49.9) | 10 653 (53) | 12 552 (57.6) | 36 510 (53.9) |
| Religion | ||||||
| Islam | 2866 (58.8) | 2272 (60.4) | 9892 (55.2) | 11 839 (58.9) | 12 727 (58.4) | 39 595 (57.7) |
| Christian | 1818 (37.3) | 1425 (37.9) | 7580 (42.3) | 7960 (39.6) | 8891 (40.8) | 27 674 (40.7) |
| Others | 190 (3.9) | 64 (1.7) | 448 (2.5) | 281 (1.4) | 174 (0.8) | 1158 (1.6) |
| Tribe | ||||||
| Hausa/Fulani | na | 1504 (40) | 6559 (36.6) | 8141 (40.5) | 8826 (40.5) | 25 029 (39.3) |
| Yoruba | na | 410 (10.9) | 2132 (11.9) | 2332 (11.6) | 2310 (10.6) | 7184 (11.2) |
| Igbo | na | 436 (11.6) | 1810 (10.1) | 1970 (9.8) | 2811 (12.9) | 7027 (11.4) |
| Others | na | 1414 (37.6) | 7419 (41.4) | 7658 (38.1) | 7845 (36) | 24 336 (38.1) |
| Person who usually decides on respondent’s healthcare | ||||||
| Respondent | na | 519 (13.8) | 1362 (7.6) | 1045 (5.2) | 1939 (8.9) | 4866 (8.1) |
| Both | na | 399 (10.6) | 6003 (33.5) | 6251 (31.1) | 6908 (31.7) | 19 561 (31.2) |
| Spouse alone | na | 2843 (75.6) | 10 555 (58.9) | 12 804 (63.7) | 12 923 (59.3) | 39 125 (60.7) |
| Getting medical help for self: distance to health facility | ||||||
| No problem | na | 2779 (73.9) | 10 644 (59.4) | 13 568 (67.5) | 15 189 (69.7) | 42 180 (66.4) |
| Big problem | na | 982 (26.1) | 7276 (40.6) | 6533 (32.5) | 6603 (30.3) | 21 393 (33.6) |
| Getting medical help for self: getting permission to go | ||||||
| No problem | na | 3366 (89.5) | 15 124 (84.4) | 17 748 (88.3) | 19 112 (87.7) | 55 350 (86.9) |
| Big problem | na | 395 (10.5) | 2796 (15.6) | 2352 (11.7) | 2680 (12.3) | 8223 (13.1) |
| Wanted the last child | ||||||
| Wanted then | 4260 (87.4) | 3189 (84.8) | 16 056 (89.6) | 18 150 (90.3) | 19 133 (87.8) | 60 789 (88.6) |
| Wanted later | 473 (9.7) | 361 (9.6) | 1004 (5.6) | 1528 (7.6) | 1918 (8.8) | 5283 (7.8) |
| Wanted no more | 141 (2.9) | 211 (5.6) | 860 (4.8) | 422 (2.1) | 763 (3.5) | 2397 (3.7) |
| Family mobility | ||||||
| Less mobile | 4333 (88.9) | 2990 (79.5) | 13 297 (74.2) | na | 18 262 (83.8) | 38 881 (80.7) |
| Yes | 541 (11.1) | 771 (20.5) | 4623 (25.8) | na | 3530 (16.2) | 9466 (19.3) |
| Covered by health insurance | ||||||
| No | na | na | 17 687 (98.7) | 19 758 (98.3) | 21 313 (97.8) | 58 758 (98.2) |
| Yes | na | na | 233 (1.3) | 342 (1.7) | 479 (2.2) | 1054 (1.8) |
| Birth order | ||||||
| 1 | 799 (16.4) | 722 (19.2) | 3046 (17) | 3558 (17.7) | 3705 (17) | 11 830 (17.2) |
| 2 | 775 (15.9) | 572 (15.2) | 2921 (16.3) | 3236 (16.1) | 3770 (17.3) | 11 274 (16.6) |
| 3 | 697 (14.3) | 519 (13.8) | 2688 (15) | 2955 (14.7) | 3312 (15.2) | 10 171 (14.9) |
| 4 | 629 (12.9) | 474 (12.6) | 2365 (13.2) | 2633 (13.1) | 2920 (13.4) | 9021 (13.2) |
| 5 | 1969 (40.4) | 1474 (39.2) | 6917 (38.6) | 7718 (38.4) | 8085 (37.1) | 26 164 (38.1) |
| Preceding birth interval | ||||||
| 1st birth | 804 (16.5) | 726 (19.3) | 3046 (17) | 3578 (17.8) | 3705 (17) | 11 859 (17.2) |
| <36 months | 2422 (49.7) | 1760 (46.8) | 8530 (47.6) | 9407 (46.8) | 10 438 (47.9) | 32 558 (47.7) |
| 36+ months | 1647 (33.8) | 1275 (33.9) | 6344 (35.4) | 7115 (35.4) | 7649 (35.1) | 24 030 (35.1) |
| % rural proportion | ||||||
| Low | 1662 (34.1) | 1015 (27) | 4892 (27.3) | 5367 (26.7) | 6167 (28.3) | 19 104 (28.1) |
| High | 3212 (65.9) | 2746 (73) | 13 028 (72.7) | 14 733 (73.3) | 15 625 (71.7) | 49 344 (71.9) |
| Community poverty rate | ||||||
| Low | 2846 (58.4) | 1689 (44.9) | 7795 (43.5) | 7799 (38.8) | 13 511 (62) | 33 640 (52) |
| High | 2028 (41.6) | 2072 (55.1) | 10 125 (56.5) | 12 301 (61.2) | 8281 (38) | 34 807 (48) |
| Community illiteracy rate | ||||||
| Low | 1501 (30.8) | 1738 (46.2) | 8100 (45.2) | 7819 (38.9) | 14 644 (67.2) | 33 802 (53) |
| High | 3373 (69.2) | 2023 (53.8) | 9820 (54.8) | 12 281 (61.1) | 7148 (32.8) | 34 645 (47) |
| Community unemployment rate | ||||||
| Low | 1686 (34.6) | 763 (20.3) | 7276 (40.6) | 8482 (42.2) | 15 712 (72.1) | 33 920 (53.6) |
| High | 3188 (65.4) | 2998 (79.7) | 10 644 (59.4) | 11 618 (57.8) | 6080 (27.9) | 34 527 (46.4) |
| Community media access | ||||||
| High | 4445 (91.2) | 1726 (45.9) | 7634 (42.6) | 7015 (34.9) | 12 574 (57.7) | 33 394 (51.4) |
| Low | 429 (8.8) | 2035 (54.1) | 10 286 (57.4) | 13 085 (65.1) | 9218 (42.3) | 35 053 (48.6) |
| Community disadvantage | ||||||
| Least | 1413 (29) | 75 (2) | 2437 (13.6) | 3075 (15.3) | 6298 (28.9) | 13 299 (21.2) |
| 2 | 1326 (27.2) | 583 (15.5) | 3494 (19.5) | 3819 (19) | 4598 (21.1) | 13 820 (20.5) |
| 3 | 780 (16) | 1271 (33.8) | 4032 (22.5) | 3538 (17.6) | 4032 (18.5) | 13 652 (20) |
| 4 | 765 (15.7) | 1117 (29.7) | 4032 (22.5) | 4080 (20.3) | 3552 (16.3) | 13 547 (19.2) |
| Most | 590 (12.1) | 711 (18.9) | 3924 (21.9) | 5628 (28) | 3312 (15.2) | 14 165 (19.2) |
| Region | ||||||
| North-central | 760 (15.6) | 621 (16.5) | 3315 (18.5) | 2975 (14.8) | 3792 (17.4) | 11 463 (17.2) |
| Northeast | 561 (11.5) | 873 (23.2) | 3942 (22) | 4080 (20.3) | 4533 (20.8) | 13 988 (20.5) |
| Northwest | 1730 (35.5) | 1162 (30.9) | 4803 (26.8) | 6512 (32.4) | 6407 (29.4) | 20 614 (29.6) |
| Southeast | 492 (10.1) | 305 (8.1) | 1469 (8.2) | 1628 (8.1) | 2375 (10.9) | 6270 (9.5) |
| South-south | 395 (8.1) | 380 (10.1) | 2115 (11.8) | 2392 (11.9) | 2157 (9.9) | 7439 (10.6) |
| Southwest | 936 (19.2) | 429 (11.4) | 2276 (12.7) | 2533 (12.6) | 2528 (11.6) | 8701 (12.6) |
| Total | 4874 | 3761 | 17 920 | 20 100 | 21 792 | 68 447 |
na, not available in the survey year.
bmjopen-2021-054328supp001.pdf (51KB, pdf)
Trends and bivariate analysis of NOP at delivery in Nigeria
Table 2 shows the prevalence, percentage change and significance of changes in having NOP at delivery concerning women characteristics. The prevalence rates of having NOP at delivery in 1990, 2003, 2008, 2013 and 2018 were 27%, 16%, 19%, 13% and 11%, respectively, with an overall prevalence of 15% between 1990 and 2018 as shown in figure 2. On the average, between 1990 and 2018, NOP at delivery was most prevalent among women from a household in the poorest wealth quintile (26%) compared with those from the richest wealth quintiles (3.2%), higher among Muslims (23%) versus Christians (3%), higher among uneducated women (25%) compared with women with at least secondary education (2%), among rural women (18%) and urban women (6%), among mobile women (17%) and less mobile women (8%), among women with no health insurance (14%) and those with health insurance (2%).
Table 2.
Prevalence and trend of births with no one present at delivery by background characteristics of mothers
| Characteristics | 1990 | 2003 | 2008 | 2013 | 2018 | All | 1990–2003 | 2003–2008 | 2008–2013 | 2013–2018 | 1990–2018 | 2003–2018 | Trend p value |
| Prevalence (%) | Changes (%)* | ||||||||||||
| Respondent’s current age | |||||||||||||
| 15–24 | 24.9 | 12.9 | 15.9 | 9.5 | 7.7 | 12.1 | −48.2 | 23.3 | −40.3 | −18.9 | −69.1 | −40.3 | <0.001 |
| 25–34 | 26.2 | 16.9 | 17.7 | 12.4 | 10.5 | 14.4 | −35.5 | 4.7 | −29.9 | −15.3 | −59.9 | −37.9 | <0.001 |
| 35–49 | 30.7 | 18.7 | 22.6 | 16.2 | 12.9 | 17.8 | −39.1 | 20.9 | −28.3 | −20.4 | −58.0 | −31.0 | <0.001 |
| Highest educational level | |||||||||||||
| No education | 37.2 | 26.0 | 31.3 | 21.6 | 19.3 | 25.2 | −30.1 | 20.4 | −31.0 | −10.6 | −48.1 | −25.8 | <0.001 |
| Primary | 11.5 | 10.6 | 10.2 | 9.0 | 6.6 | 9.1 | −7.8 | −3.8 | −11.8 | −26.7 | −42.6 | −37.7 | 0.036 |
| Secondary+ | 3.3 | 2.5 | 3.2 | 2.4 | 2.2 | 2.5 | −24.2 | 28.0 | −25.0 | −8.3 | −33.3 | −12.0 | 0.003 |
| Husband/partner’s education level | |||||||||||||
| No education | 39.4 | 27.6 | 33.0 | 22.6 | 20.7 | 26.9 | −29.9 | 19.6 | −31.5 | −8.4 | −47.5 | −25.0 | <0.001 |
| Primary | 14.0 | 12.5 | 12.9 | 10.6 | 8.2 | 11.2 | −10.7 | 3.2 | −17.8 | −22.6 | −41.4 | −34.4 | 0.076 |
| Secondary+ | 9.7 | 7.2 | 6.8 | 5.3 | 4.6 | 5.7 | −25.8 | −5.6 | −22.1 | −13.2 | −52.6 | −36.1 | <0.001 |
| Place of residence | |||||||||||||
| Urban | 15.5 | 9.5 | 8.8 | 6.3 | 5.5 | 7.5 | −38.7 | −7.4 | −28.4 | −12.7 | −64.5 | −42.1 | <0.001 |
| Rural | 32.1 | 19.8 | 22.1 | 15.8 | 13.1 | 18.1 | −38.3 | 11.6 | −28.5 | −17.1 | −59.2 | −33.8 | <0.001 |
| Employment status | |||||||||||||
| Employed | 22.7 | 13.1 | 15.6 | 12.6 | 9.2 | 13.0 | −42.3 | 19.1 | −19.2 | −27.0 | −59.5 | −29.8 | <0.001 |
| Unemployed | 34.4 | 21.8 | 23.8 | 12.9 | 13.1 | 18.1 | −36.6 | 9.2 | −45.8 | 1.6 | −61.9 | −39.9 | <0.001 |
| Paternal employment status | |||||||||||||
| Employed | 27.2 | 16.6 | 18.9 | 13.1 | 10.4 | 15.1 | −39.0 | 13.9 | −30.7 | −20.6 | −61.8 | −37.3 | <0.001 |
| Unemployed | 19.0 | 8.2 | 20.9 | 6.4 | 24.1 | 18.8 | −56.8 | 154.9 | −69.4 | 276.6 | 26.8 | 193.9 | <0.001 |
| Sex of household head | |||||||||||||
| Male | 28.1 | 17.2 | 19.6 | 13.6 | 11.3 | 15.7 | −38.8 | 14.0 | −30.6 | −16.9 | −59.8 | −34.3 | <0.001 |
| Female | 10.1 | 6.5 | 9.3 | 5.7 | 3.6 | 6.2 | −35.6 | 43.1 | −38.7 | −36.8 | −64.4 | −44.6 | <0.001* |
| Marital status | |||||||||||||
| Never married | 0.0 | 0.8 | 2.1 | 0.7 | 1.4 | 1.3 | >100 | 162.5 | −66.7 | 100.0 | >100 | 75.0 | 0.789 |
| Living with spouse | 27.6 | 16.8 | 19.2 | 13.2 | 10.9 | 15.3 | −39.1 | 14.3 | −31.3 | −17.4 | −60.5 | −35.1 | <0.001 |
| Formerly | 11.6 | 11.8 | 11.3 | 7.9 | 6.5 | 8.8 | 1.7 | −4.2 | −30.1 | −17.7 | −44.0 | −44.9 | 0.003 |
| Media access | |||||||||||||
| No | na | 20.3 | 23.1 | 17.8 | 14.1 | 17.8 | na | 13.8 | −22.9 | −20.8 | >100 | −30.5 | <0.001 |
| Yes | na | 13.4 | 14.6 | 6.7 | 5.1 | 9.2 | na | 9.0 | −54.1 | −23.9 | >100 | −61.9 | <0.001 |
| Wealth index | |||||||||||||
| Poorest | 28.4 | 19.1 | 31.7 | 24.8 | 21.0 | 25.6 | −32.7 | 66.0 | −21.8 | −15.3 | −26.1 | 9.9 | 0.457 |
| Poorer | 35.1 | 21.8 | 24.9 | 17.3 | 12.4 | 19.2 | −37.9 | 14.2 | −30.5 | −28.3 | −64.7 | −43.1 | <0.001 |
| Middle | 34.9 | 20.1 | 14.1 | 9.9 | 7.9 | 12.1 | −42.4 | −29.9 | −29.8 | −20.2 | −77.4 | −60.7 | <0.001 |
| Richer | 27.6 | 14.1 | 7.1 | 4.6 | 4.3 | 7.3 | −48.9 | −49.6 | −35.2 | −6.5 | −84.4 | −69.5 | <0.001 |
| Richest | 11.7 | 2.7 | 3.0 | 1.7 | 1.6 | 3.2 | −76.9 | 11.1 | −43.3 | −5.9 | −86.3 | −40.7 | <0.001 |
| Number of antenatal visits during pregnancy | |||||||||||||
| None | 45.4 | 32.5 | 35.5 | 21.5 | 18.9 | 27.8 | −28.4 | 9.2 | −39.4 | −12.1 | −58.4 | −41.8 | <0.001 |
| Inadequate | 22.3 | 12.1 | 9.5 | 15.4 | 12.4 | 13.1 | −45.7 | −21.5 | 62.1 | −19.5 | −44.4 | 2.5 | 0.022 |
| Adequate | 13.6 | 6.6 | 7.3 | 6.3 | 6.2 | 7.0 | −51.5 | 10.6 | −13.7 | −1.6 | −54.4 | −6.1 | <0.001 |
| Religion | |||||||||||||
| Islam | 39.2 | 24.7 | 29.1 | 19.6 | 16.3 | 22.5 | −37.0 | 17.8 | −32.6 | −16.8 | −58.4 | −34.0 | <0.001 |
| Christian | 8.7 | 3.1 | 4.0 | 2.3 | 2.3 | 3.3 | −64.4 | 29.0 | −42.5 | 0.0 | −73.6 | −25.8 | <0.001 |
| Others | 14.9 | 5.8 | 30.8 | 16.3 | 2.0 | 18.9 | −61.1 | 431.0 | −47.1 | −87.7 | −86.6 | −65.5 | <0.001 |
| Tribe | |||||||||||||
| Hausa/Fulani | na | 30.8 | 39.1 | 25.2 | 20.4 | 27.5 | na | 26.9 | −35.5 | −19.0 | na | −33.8 | <0.001 |
| Yoruba | na | 1.5 | 3.7 | 1.4 | 1.2 | 2.0 | na | 146.7 | −62.2 | −14.3 | na | −20.0 | 0.306 |
| Igbo | na | 0.7 | 4.1 | 1.4 | 1.8 | 2.2 | na | 485.7 | −65.9 | 28.6 | na | 157.1 | 0.301 |
| Others | na | 9.7 | 8.2 | 5.8 | 5.2 | 6.6 | na | −15.5 | −29.3 | −10.3 | na | −46.4 | <0.001 |
| Person who usually decides on respondent’s healthcare | |||||||||||||
| Respondent | na | 8.4 | 8.6 | 4.0 | 14.8 | 9.9 | na | 2.4 | −53.5 | 270.0 | na | 76.2 | <0.001 |
| Both | na | 7.4 | 11.7 | 4.5 | 5.3 | 7.0 | na | 58.1 | −61.5 | 17.8 | na | −28.4 | <0.001 |
| Spouse alone | na | 19.7 | 24.9 | 18.2 | 13.3 | 18.5 | na | 26.4 | −26.9 | −26.9 | na | −32.5 | <0.001 |
| Getting medical help for self: distance to health facility | |||||||||||||
| No problem | na | 14.4 | 17.3 | 11.4 | 10.3 | 12.7 | na | 20.1 | −34.1 | −9.6 | na | −28.5 | <0.001 |
| Big problem | na | 21.5 | 20.3 | 15.4 | 10.9 | 16.0 | na | −5.6 | −24.1 | −29.2 | na | −49.3 | 0.430 |
| Getting permission to go for medical care | |||||||||||||
| No problem | na | 14.6 | 17.4 | 11.9 | 10.1 | 12.9 | na | 19.2 | −31.6 | −15.1 | na | −30.8 | <0.001 |
| Big problem | na | 29.9 | 24.8 | 18.5 | 12.7 | 19.3 | na | −17.1 | −25.4 | −31.4 | na | −57.5 | 0.001 |
| Wanted last child | |||||||||||||
| Wanted then | 27.9 | 17.8 | 19.2 | 13.5 | 11.1 | 15.5 | −36.2 | 7.9 | −29.7 | −17.8 | −60.2 | −37.6 | <0.001 |
| Wanted later | 20.3 | 8.4 | 13.4 | 4.5 | 4.3 | 7.8 | −58.6 | 59.5 | −66.4 | −4.4 | −78.8 | −48.8 | <0.001 |
| Wanted no more | 19.4 | 5.1 | 11.3 | 7.8 | 8.8 | 9.8 | −73.7 | 121.6 | −31.0 | 12.8 | −54.6 | 72.5 | 0.751 |
| Family mobility | |||||||||||||
| Less mobile | 28.9 | 17.7 | 21.1 | na | 11.8 | 17.3 | −38.8 | 19.2 | −100 | na | −59.2 | −33.3 | <0.001 |
| Yes | 10.3 | 10.5 | 11.1 | na | 3.4 | 8.1 | 1.9 | 5.7 | −100 | na | −67.0 | −67.6 | 0.100 |
| Covered by health insurance | |||||||||||||
| No | na | na | 18.7 | 12.9 | 10.7 | 13.8 | na | na | −31.0 | −17.1 | na | na | <0.001 |
| Yes | na | na | 3.3 | 2.0 | 2.0 | 2.3 | na | na | −39.4 | 0.0 | na | na | 0.366 |
| Birth order | |||||||||||||
| 1 | 19.4 | 5.7 | 9.3 | 3.6 | 2.7 | 6.0 | −70.6 | 63.2 | −61.3 | −25.0 | −86.1 | −52.6 | <0.001 |
| 2 | 25.0 | 12.9 | 14.4 | 9.5 | 6.3 | 10.9 | −48.4 | 11.6 | −34.0 | −33.7 | −74.8 | −51.2 | <0.001 |
| 3 | 30.3 | 15.7 | 16.2 | 9.5 | 7.5 | 12.3 | −48.2 | 3.2 | −41.4 | −21.1 | −75.2 | −52.2 | <0.001 |
| 4 | 29.3 | 16.7 | 17.7 | 12.0 | 10.9 | 14.6 | −43.0 | 6.0 | −32.2 | −9.2 | −62.8 | −34.7 | <0.001 |
| 5 | 28.7 | 22.7 | 25.6 | 19.6 | 17.0 | 21.2 | −20.9 | 12.8 | −23.4 | −13.3 | −40.8 | −25.1 | <0.001 |
| Preceding birth interval | |||||||||||||
| 1st birth | 19.4 | 5.7 | 9.3 | 3.6 | 2.7 | 6.0 | −70.6 | 63.2 | −61.3 | −25.0 | −86.1 | −52.6 | <0.001 |
| <36 months | 25.4 | 20.5 | 20.3 | 15.0 | 12.1 | 16.5 | −19.3 | −1.0 | −26.1 | −19.3 | −52.4 | −41.0 | <0.001 |
| 36+ months | 32.9 | 16.3 | 20.6 | 14.2 | 12.0 | 16.6 | −50.5 | 26.4 | −31.1 | −15.5 | −63.5 | −26.4 | <0.001 |
| % rural proportion | |||||||||||||
| Low | na | 1.8 | 5.7 | 1.7 | 1.8 | 2.8 | na | 216.7 | −70.2 | 5.9 | na | 0.0 | <0.001 |
| High | na | 21.5 | 23.4 | 16.7 | 13.9 | 17.9 | na | 8.8 | −28.6 | −16.8 | na | −35.3 | <0.001 |
| Community poverty rate | |||||||||||||
| Low | 26.3 | 19.4 | 17.6 | 7.8 | 9.8 | 13.0 | −26.2 | −9.3 | −55.7 | 25.6 | −62.7 | −49.5 | <0.001 |
| High | 27.7 | 13.6 | 19.2 | 15.8 | 11.5 | 16.3 | −50.9 | 41.2 | −17.7 | −27.2 | −58.5 | −15.4 | <0.001 |
| Community illiteracy rate | |||||||||||||
| Low | 18.0 | 20.6 | 18.0 | 7.7 | 9.7 | 12.1 | 14.4 | −12.6 | −57.2 | 26.0 | −46.1 | −52.9 | <0.001 |
| High | 30.9 | 12.4 | 19.0 | 15.9 | 12.0 | 17.2 | −59.9 | 53.2 | −16.3 | −24.5 | −61.2 | −3.2 | <0.001 |
| Community unemployment rate | |||||||||||||
| Low | 20.5 | 12.9 | 13.8 | 14.3 | 11.5 | 13.2 | −37.1 | 7.0 | 3.6 | −19.6 | −43.9 | −10.9 | <0.001 |
| High | 30.3 | 17.0 | 21.8 | 11.5 | 7.9 | 16.2 | −43.9 | 28.2 | −47.2 | −31.3 | −73.9 | −53.5 | <0.001 |
| Community media access | |||||||||||||
| High | 28.8 | 20.3 | 18.2 | 8.4 | 10.0 | 14.5 | −29.5 | −10.3 | −53.8 | 19.0 | −65.3 | −50.7 | <0.001 |
| Low | 6.5 | 12.7 | 18.8 | 15.0 | 11.2 | 14.9 | 95.4 | 48.0 | −20.2 | −25.3 | 72.3 | −11.8 | <0.001 |
| Community disadvantage | |||||||||||||
| Least | 13.2 | 12.7 | 2.7 | 2.1 | 3.3 | 4.1 | −3.8 | −78.7 | −22.2 | 57.1 | −75.0 | −74.0 | <0.001 |
| 2 | 30.8 | 9.0 | 8.0 | 5.4 | 12.5 | 10.9 | −70.8 | −11.1 | −32.5 | 131.5 | −59.4 | 38.9 | <0.001 |
| 3 | 33.8 | 19.0 | 18.7 | 8.7 | 13.0 | 15.1 | −43.8 | −1.6 | −53.5 | 49.4 | −61.5 | −31.6 | <0.001 |
| 4 | 27.7 | 13.6 | 25.9 | 16.0 | 11.9 | 18.3 | −50.9 | 90.4 | −38.2 | −25.6 | −57.0 | −12.5 | 0.467 |
| Most | 40.5 | 21.6 | 30.1 | 23.5 | 16.6 | 24.3 | −46.7 | 39.4 | −21.9 | −29.4 | −59.0 | −23.1 | 0.065 |
| Region | |||||||||||||
| North-central | 24.4 | 12.3 | 11.0 | 6.4 | 4.8 | 8.6 | −49.6 | −10.6 | −41.8 | −25.0 | −80.3 | −61.0 | <0.001 |
| Northeast | 19.2 | 19.9 | 17.8 | 10.9 | 15.0 | 15.1 | 3.6 | −10.6 | −38.8 | 37.6 | −21.9 | −24.6 | <0.001 |
| Northwest | 51.5 | 30.1 | 43.0 | 28.0 | 20.4 | 31.1 | −41.6 | 42.9 | −34.9 | −27.1 | −60.4 | −32.2 | <0.001 |
| Southeast | 3.9 | 0.4 | 4.6 | 1.5 | 2.0 | 2.5 | −89.7 | 1050.0 | −67.4 | 33.3 | −48.7 | 400.0 | 0.037 |
| South-south | 7.8 | 1.6 | 2.6 | 1.4 | 1.3 | 2.1 | −79.5 | 62.5 | −46.2 | −7.1 | −83.3 | −18.8 | <0.001 |
| Southwest | 7.8 | 0.4 | 3.1 | 1.5 | 1.2 | 2.6 | −94.9 | 675.0 | −51.6 | −20.0 | −84.6 | 200.0 | <0.001 |
| Total | 26.9 | 16.2 | 18.5 | 12.7 | 11.1 | 14.7 | −39.8 | 14.2 | −31.4 | −17.3 | −61.0 | −35.2 | <0.001 |
The values ‘>100’ depict percentage change from 0 to any number >0.
*Negative values depict reduction.
na, not available in that survey year.
Figure 2.
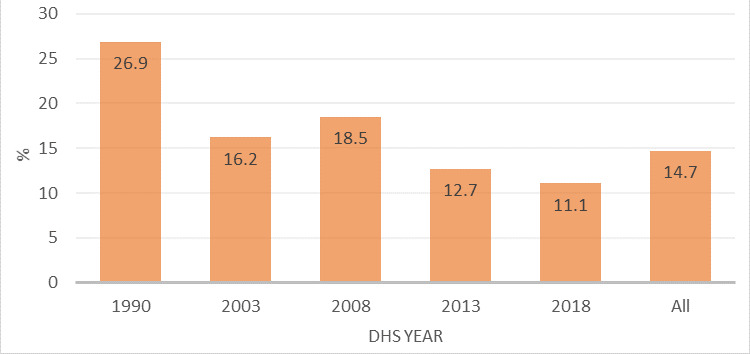
Prevalence of NOP by NDHS year. NDHS, Nigeria Demographic Health Survey; NOP, no one present.
The practice of having NOP at delivery reduced by 40% between 1990 and 2003, increased by 16% between 2003 and 2008, decreased by 31% between 2008 and 2013, and further by 17% between 2013 and 2018. Overall, NOP at delivery prevalence reduced by 61% between 1990 and 2018, and by 35% between 2003 and 2018. These reductions were significant (p<0.001) over the study period. Trends in having NOP at delivery were significant to all the women characteristics considered except among women without health insurance and if the spouse had only primary education, Yoruba tribe, big problem accessing healthcare and women whose family is mobile.
An increasing trend in the practice of having NOP at delivery was recorded among women who did not want the pregnancy, whose spouse was unemployed, the never-married women, those from households in the poorest wealth quintiles, those with inadequate ANC contacts, the Igbo tribe and when respondents decide about their healthcare utilisation.
Table 3 shows the prevalence and trend of NOP at delivery in the states. Overall, the highest practice of having NOP at delivery was in Zamfara (44%), Kano (40%) and Katsina (35%); while the practice was 0.1% in Bayelsa, 0.8% in Enugu, 0.9% in Osun and 1.1% in Imo. While NOP at delivery reduced across most states between 2003 and 2018, it increased by 38% in Yobe, 39% in Nasarawa and 87% in Gombe during the period.
Table 3.
Prevalence of NOP use by the states of residence of the mothers
| State of residence | 1990 | 2003 | 2008 | 2013 | 2018 | All | 1990–2003 | 2003–2008 | 2008–2013 | 2013–2018 | 1990–2018 | 2003–2018 | Trend test (p value) |
| Prevalence (%) | Changes (%)* | ||||||||||||
| Abia | na | 0.0 | 2.8 | 0.3 | 1.1 | 1.3 | na | 280 | −89.3 | 266.7 | na | >100 | 0.811 |
| Adamawa | 21.6 | 3.2 | 18.8 | 8.0 | 0.8 | 9.6 | −85.2 | 487.5 | −57.4 | −90.0 | −96.3 | −75.0 | 0.696 |
| Akwa Ibom | 6.7 | 3.0 | 0.3 | 0.0 | 2.5 | 1.7 | −55.2 | −90.0 | −100 | >100 | −62.7 | −16.7 | 0.270 |
| Anambra | 4.7 | 1.5 | 0.0 | 0.0 | 0.6 | 1.3 | −68.1 | −100 | >100 | >100 | −87.2 | −60.0 | 0.658 |
| Bauchi | 26.5 | 27.7 | 37.2 | 22.0 | 22.5 | 26.7 | 4.5 | 34.3 | −40.9 | 2.3 | −15.1 | −18.8 | 0.004 |
| Bayelsa | na | 0.0 | 0.0 | 0.2 | 0.0 | 0.1 | na | >100 | >100 | −100 | na | >100 | 0.303 |
| Benue | 14.6 | 4.0 | 2.6 | 6.3 | 1.1 | 4.6 | −72.6 | −35.0 | 142.3 | −82.5 | −92.5 | −72.5 | 0.002 |
| Borno | 12.0 | 8.6 | 7.7 | 2.8 | 5.5 | 6.5 | −28.3 | −10.5 | −63.6 | 96.4 | −54.2 | −36.0 | 0.378 |
| Cross River | 14.6 | 6.5 | 3.6 | 1.2 | 2.1 | 3.3 | −55.5 | −44.6 | −66.7 | 75.0 | −85.6 | −67.7 | 0.409 |
| Delta | na | 0.0 | 3.2 | 5.8 | 1.9 | 3.6 | na | >100 | 81.3 | −67.2 | na | >100 | 0.006 |
| Ebonyi | na | 0.0 | 13.1 | 5.2 | 5.3 | 7.2 | na | >100 | −60.3 | 1.9 | na | >100 | 0.755 |
| Edo | 6.3 | 0.0 | 2.7 | 0.8 | 1.0 | 2.0 | −100 | >100 | −70.4 | 25.0 | −84.1 | >100 | 0.236 |
| Ekiti | na | 0.0 | 2.9 | 0.5 | 2.1 | 1.7 | na | >100 | −82.8 | 320.0 | na | >100 | 0.734 |
| Enugu | na | 0.0 | 1.1 | 0.2 | 1.5 | 0.8 | na | >100 | −81.8 | 650.0 | na | >100 | 0.534 |
| FCT-Abuja | 8.3 | 20.7 | 5.0 | 4.2 | 2.8 | 4.3 | 149.4 | −75.8 | −16.0 | −33.3 | −66.3 | −86.5 | <0.001 |
| Gombe | na | 12.5 | 14.1 | 18.4 | 23.4 | 18.7 | na | 12.8 | 30.5 | 27.2 | na | 87.2 | 0.002 |
| Imo | 3.1 | 0.0 | 0.4 | 0.5 | 0.7 | 1.1 | −100 | >100 | 25.0 | 40.0 | −77.4 | >100 | 0.547 |
| Jigawa | na | 41.9 | 29.4 | 21.9 | 34.2 | 29.1 | na | −29.8 | −25.5 | 56.2 | na | −18.4 | 0.014 |
| Kaduna | 50.3 | 31.2 | 6.1 | 15.5 | 14.5 | 18.3 | −38.0 | −80.4 | 154.1 | −6.5 | −71.2 | −53.5 | <0.001 |
| Kano | 53.9 | 31.2 | 59.0 | 41.5 | 21.1 | 39.9 | −42.1 | 89.1 | −29.7 | −49.2 | −60.9 | −32.4 | <0.001 |
| Katsina | 37.8 | 24.7 | 60.7 | 27.5 | 20.4 | 34.7 | −34.7 | 145.7 | −54.7 | −25.8 | −46.0 | −17.4 | 0.004 |
| Kebbi | na | 17.3 | 53.7 | 26.7 | 2.1 | 24.2 | na | 210.4 | −50.3 | −92.1 | na | −87.9 | <0.001 |
| Kogi | na | 3.4 | 6.4 | 0.1 | 0.7 | 2.4 | na | 88.2 | −98.4 | 600.0 | na | −79.4 | 0.235 |
| Kwara | 33.0 | 12.1 | 28.8 | 1.2 | 5.4 | 12.8 | −63.3 | 138.0 | −95.8 | 350.0 | −83.6 | −55.4 | <0.001 |
| Lagos | 5.4 | 0.0 | 2.0 | 0.9 | 0.9 | 2.2 | −100 | >100 | −55.0 | 0.0 | −83.3 | >100 | 0.585 |
| Nasarawa | na | 10.6 | 9.3 | 10.7 | 14.7 | 11.7 | na | −12.3 | 15.1 | 37.4 | na | 38.7 | 0.206 |
| Niger | 31.0 | 27.7 | 19.8 | 7.6 | 5.4 | 12.2 | −10.6 | −28.5 | −61.6 | −28.9 | −82.6 | −80.5 | <0.001 |
| Ogun | 13.9 | 3.6 | 0.6 | 0.3 | 0.6 | 1.5 | −74.1 | −83.3 | −50.0 | 100 | −95.7 | −83.3 | <0.001 |
| Ondo | 10.7 | 0.0 | 6.2 | 3.4 | 3.3 | 4.6 | −100 | >100 | −45.2 | −2.9 | −69.2 | >100 | 0.854 |
| Osun | na | 0.0 | 1.4 | 0.5 | 0.8 | 0.9 | na | >100 | −64.3 | 60.0 | na | >100 | 0.760 |
| Oyo | 10.1 | 0.0 | 6.0 | 2.6 | 0.0 | 4.0 | −100 | >100 | −56.7 | −100 | −100 | >100 | 0.473 |
| Plateau | 32.7 | 5.4 | 5.1 | 12.6 | 3.2 | 9.6 | −83.5 | −5.6 | 147.1 | −74.6 | −90.2 | −40.7 | 0.203 |
| Rivers | 5.0 | 0.9 | 6.3 | 0.3 | 0.7 | 2.2 | −82.0 | 600.0 | −95.2 | 133.3 | −86.0 | −22.2 | 0.014 |
| Sokoto | 59.4 | 28.7 | 23.7 | 0.2 | 20.4 | 20.3 | −51.7 | −17.4 | −99.2 | 10 100 | −65.7 | −28.9 | <0.001 |
| Taraba | na | 30.4 | 10.1 | 8.0 | 6.9 | 9.3 | na | −66.8 | −20.8 | −13.8 | na | −77.3 | <0.001 |
| Yobe | na | 17.8 | 18.4 | 0.3 | 24.5 | 15.1 | na | 3.4 | −98.4 | 8066.7 | na | 37.6 | 0.005 |
| Zamfara | na | 30.7 | 62.3 | 46.2 | 29.8 | 44.1 | na | 102.9 | −25.8 | −35.5 | na | −2.9 | 0.011 |
| Total | 26.9 | 16.2 | 18.5 | 12.7 | 11.1 | 14.7 | −39.8 | 14.2 | −31.4 | −17.3 | −61.0 | −35.2 | <0.001 |
The values ‘>100’ depict percentage change from 0 to any number >0.
*Negative values depict a reduction.
FCT, Federal Capital Territory; na, not available in that survey year; NOP, no one present.
Multivariate decomposition of having NOP at delivery from 2003 to 2018
Decomposition analysis of factors associated with changes in NOP
Table 4 reports the effect of respondents’ characteristics on having NOP between 2003 and 2018. It also shows how much of the difference is attributable to changes in women’s characteristics (endowments), and how much to the effects of these characteristics (coefficients).
Table 4.
Decomposition of change in odds of having no one present child delivery in Nigeria, 2003–2018
| Characteristics | Difference due to characteristics (E) | Difference due to coefficients (C) | ||||
| Coefficient | P value | Per cent | Coefficient | P value | Per cent | |
| Respondent’s age | ||||||
| 15–24 | Reference | |||||
| 25–34 | 0.0001 | 0.051 | −0.2 | −0.0085 | 0.499 | 16.0 |
| 35–49 | 0.0013 | 0.037 | −2.5 | −0.0059 | 0.454 | 11.2 |
| Highest educational level | ||||||
| No education | Reference | |||||
| Primary | 0.0033 | 0.044 | −6.2 | −0.0123 | 0.131 | 23.2 |
| Secondary+ | −0.0124 | 0.051 | 23.4 | −0.0028 | 0.806 | 5.4 |
| Husband/partner’s education level | ||||||
| No education | Reference | |||||
| Primary | 0.0026 | 0.082 | −4.9 | −0.0085 | 0.234 | 16.1 |
| Secondary+ | −0.0019 | 0.243 | 3.6 | 0.0058 | 0.587 | −10.9 |
| Employment status | ||||||
| Employed | 0.0002 | 0.246 | −0.5 | −0.0556 | 0.096 | 105.1 |
| Sex of household head | ||||||
| Male | 0.0006 | 0.047 | −1.1 | −0.1202 | 0.079 | 127.1 |
| Media access | ||||||
| No | 0.0059 | 0.031 | −11.1 | 0.0066 | 0.430 | −12.5 |
| Wealth index | ||||||
| Poorest | 0.0013 | 0.019 | −2.5 | 0.0548 | 0.019 | −103.6 |
| Poorer | 0.0023 | 0.018 | −4.4 | 0.0290 | 0.063 | −54.7 |
| Middle | 0.0004 | 0.020 | −0.7 | 0.0146 | 0.241 | −27.6 |
| Richer | −0.0006 | 0.029 | 1.2 | 0.0000 | 0.997 | −2.3 |
| Richest | Reference | |||||
| Number of ANC visits during pregnancy | ||||||
| None (0) | Reference | |||||
| Inadequate (less than 4) | −0.0011 | 0.047 | 2.2 | 0.0112 | 0.056 | −21.2 |
| Adequate (4 or more) | −0.0028 | 0.033 | 5.2 | 0.0497 | 0.033 | −93.9 |
| Religion | ||||||
| Islam | Reference | |||||
| Christianity | −0.0012 | 0.028 | 2.3 | 0.0014 | 0.928 | −2.6 |
| Others | 0.0013 | 0.131 | −2.4 | −0.0020 | 0.363 | 3.8 |
| Tribe/ethnic group | ||||||
| Hausa/Fulani | Reference | |||||
| Yoruba | 0.0002 | 0.031 | −0.4 | 0.0017 | 0.857 | −3.1 |
| Igbo | −0.0005 | 0.060 | 0.9 | 0.0512 | 0.155 | −96.7 |
| Others | 0.0022 | 0.028 | −4.1 | −0.0076 | 0.440 | 14.4 |
| Person who usually decides on respondent’s healthcare (HC) | ||||||
| Respondent | ||||||
| Both | −0.0263 | 0.039 | 49.7 | −0.0175 | 0.038 | 33.1 |
| Spouse alone | 0.0242 | 0.029 | −45.6 | −0.1488 | 0.014 | 81.0 |
| Distance to HC is a big problem | ||||||
| Yes | −0.0019 | 0.039 | 3.5 | −0.0188 | 0.037 | 35.5 |
| Getting permission to go to HC is a big problem | ||||||
| Yes | 0.0000 | 0.939 | 0.0 | −0.0036 | 0.245 | 6.8 |
| Wanted last child | ||||||
| Wanted then | Reference | |||||
| Wanted later | 0.0002 | 0.561 | −0.4 | 0.0076 | 0.117 | −14.3 |
| Wanted no more | −0.0003 | 0.169 | 0.7 | 0.0041 | 0.205 | −7.8 |
| Family mobility | ||||||
| Mobile (<5 years) | 0.0017 | 0.081 | −3.2 | −0.0099 | 0.169 | 18.7 |
| Birth interval | ||||||
| 1st birth | Reference | |||||
| <36 months | 0.0023 | 0.030 | −4.3 | 0.0068 | 0.703 | −12.9 |
| 36+ months | −0.0003 | 0.029 | 0.6 | 0.0232 | 0.145 | −43.9 |
| Place of residence | ||||||
| Rural | 0.0000 | 0.435 | −0.0177 | 0.348 | 33.4 | |
| States’ rural population percentage | ||||||
| Low | Reference | |||||
| High | −0.0018 | 0.043 | 3.4 | 0.0326 | 0.434 | −61.5 |
| Community SES disadvantage | ||||||
| Least disadvantage | 0.0077 | 0.009 | −14.5 | −0.0009 | 0.598 | 1.8 |
| Less disadvantage | −0.0003 | 0.443 | 0.5 | 0.0116 | 0.153 | −22.0 |
| Disadvantage | 0.0003 | 0.837 | −0.5 | 0.0020 | 0.807 | −3.8 |
| More disadvantage | 0.0010 | 0.131 | −2.0 | 0.0027 | 0.680 | −5.0 |
| Most disadvantage | Reference | |||||
| Constant | 0.0635 | 0.591 | −119.9 | |||
| % total explained disparity | 0.0077 | 0.001 | 14.6 | −0.0607 | 0.000 | 85.4 |
ANC, antenatal care; SES, socioeconomic status.
The decomposition of the changes in having NOP at delivery from 2003 to 2018 revealed that 14.6% of the overall change can be attributed to differences in characteristics only (endowment component), while the 85.4% was due to differences in characteristics’ effects (coefficient). Generally, the decomposition result indicates that the decrease was mostly due to respondents’ behavioural changes, more than to change in the compositional differences among the respondents.
However, even though the overall decrease explained by the coefficients was higher than the decrease explained by the endowments, the contributions of the different explanatory variables varied substantially (table 4). Among the compositional factors, the most important contributors to the decrease are women’s education level, respondents’ age, women e employment status, sex of the head of households, household wealth status, ANC contacts, tribe, healthcare decision-maker, distances to healthcare, birth interval, and place of residence accounting for 30%, 27%, 105%, 127%, −188%, −115%, −86%, 114%, 36%, -56% and 33% respectively. The most significant contribution to changes in having NOP at delivery from 2003 to 2018 was the decision-maker of healthcare use with spousal sole decision-making accounting for 81%. Another main contributor is respondents’ education, with having secondary education reducing practice of having NOP at delivery by 23.4% compared with those with no education.
State-level decomposition analysis
In all, there was a reduction in the level of having no one at birth in FCT, Kogi, Kwara, Ogun, Benue, Kano, Kebbi, Niger, Bauchi, Kaduna and Taraba, and the only significant increase was in Gombe. Six states were excluded from the state-level decomposition analysis of the reduction in NOP at delivery because they had insufficient sample sizes and 0% for some of the categories of the explanatory variables considered. The states are Bayelsa, FCT, Kogi, Kwara and Ogun.
As shown in figure 3, the contributions to the changes are mostly differences in maternal age, neighbourhood SES disadvantage, spousal educational attainment, preceding birth interval, unemployment, household wealth index and who decides women healthcare utilisation. All these greatest contributors formed a cluster while other factors formed another cluster. The differences across the states have a unique pattern. Benue formed a cluster alone while there are similarities across Kano, Kebbi, Niger, Bauchi, Kaduna and Taraba as they formed another cluster. In Benue, maternal age and neighbourhood SES disadvantage are the greatest contributors in opposite direction with 543% and −553%, respectively. The leading contributors to the changes in Kano are who decides healthcare use (−88%), and wealth index and media access (−30%). In Kebbi, the greatest contributors are neighbourhood SES disadvantage (−101%), media access (33%) and ANC use (22%).
Figure 3.
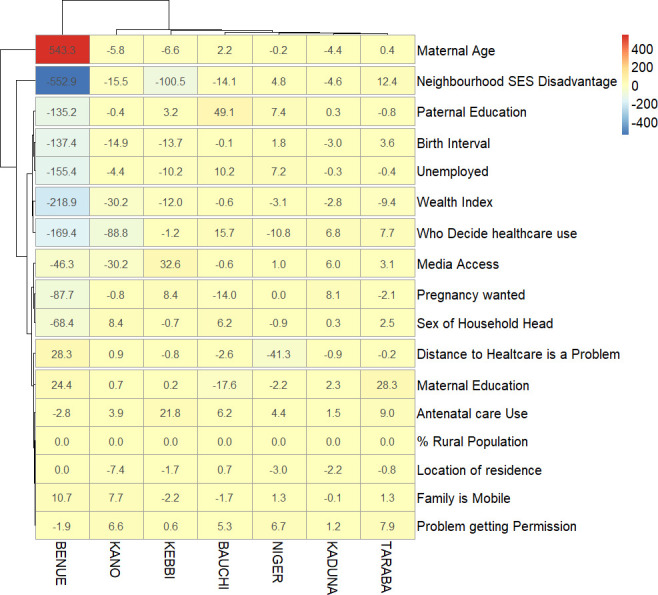
Factors associated with a reduction in having ‘no one at birth’ from 2003 to 2018 by states in Nigeria. SES, socioeconomic status.
The decomposition analysis of the factors contributing to the increments in having NOP at delivery between 2003 and 2018 is shown in figure 4. There were significant increments only in Gombe state. The leading contributors to the increments are insufficient ANC use (44%), poor maternal education (38%), <36 months preceding birth interval (35%), who decides women healthcare utilisation (−30%) and neighbourhood SES disadvantage (18%).
Figure 4.
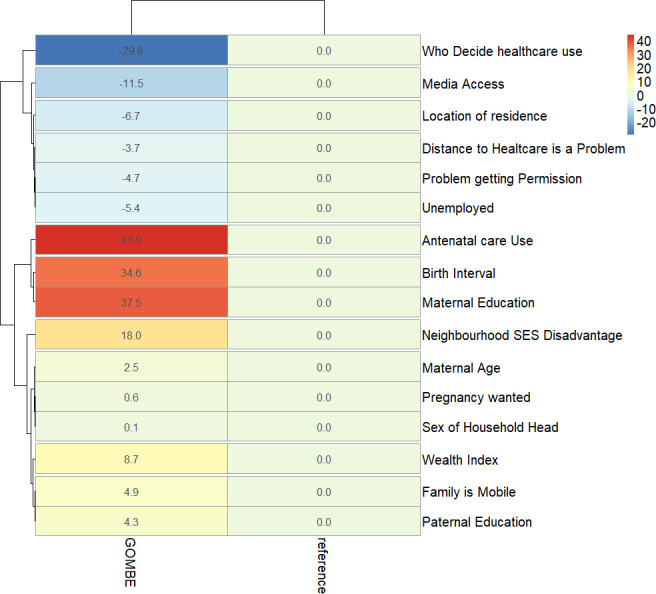
Factors associated with an increase in having ‘no one at birth’ from 2003 to 2018 by states in Nigeria. SES, socioeconomic status.
Discussions
While it is unacceptable to have unskilled personnel present at delivery, it is worse not to have anyone to guide or assist a delivery. This has put nearly a million pregnant women at risk of adverse pregnancy outcomes annually in Nigeria and some other developing countries. This study was aimed at identifying levels, changes and drivers of the practice of NOP at birth in Nigeria in the last two decades. Overall, the prevalence of NOP at delivery showed a long-term decreasing secular trend. NOP at delivery was most prevalent among households in the poorest wealth quintile, Muslims, the uneducated, rural women, less mobile women and women with no health insurance cover. NOP at delivery was also more prevalent among women who did not want the pregnancy at the time of conception, whose spouse was unemployed, the never-married women, women with inadequate ANC contacts, the Igbo ethnic groups and when respondents do not contribute to decisions about their healthcare. Notably, the practice of NOP at delivery was highest in the northern states, especially in Zamfara, Kano, Katsina, Bauchi and Gombe where about 4 in 10 reported NOP at delivery. The practice also increased considerably in Yobe, Nasarawa and Gombe between 2003 and 2018 in contrast to the experience of some other states in the southern part of the country which showed a general decreasing trend.
The process of childbirth may be accompanied by unanticipated challenges such as prolonged labour, postpartum haemorrhage, and other obstetric complications that require prompt attention and management by an SBA or immediate referral to appropriate quarters.2 3 40–42 To prevent, or at least to lower maternal and newborn deaths, the presence of a skilled attendant at birth is imperative.43–45 Over centuries, the standard of who is required to be present at birth has evolved and to date, changes are still continually made to birth protocols and guidelines including those provided by WHO.46 Today, the WHO advocates for skilled attendance at every child delivery. This recommendation is still far from being achievable in resource-limited settings like Nigeria and other SSA countries. This region is the only part of the world where the rates of births assisted by a medically trained professional had not shown impressive results in the last two to three decades.47 Regardless of the level of medical skills, the presence of an assistant during child delivery is desirable. However, several thousands of childbirths happen in Nigeria with NOP. The NDHS 2018 showed that 1 in 10 pregnant women goes through deliveries with NOP.22
The decomposition analysis conducted in this study has brought some important factors to the fore. Age 35–49 years had a significant impact on reducing the trend of NOP at delivery. This may imply a shift towards the younger pregnant women which could be associated with inexperience in birth preparedness. Compared with women with no education, there was a reduction in the composition of respondents with primary and secondary or higher education which contributed 23% and 5% to the reduction of NOP at delivery over the study period. It appears the shift in education was towards an increase in the contribution of respondents with education which exerted a decreasing trend on the prevalence of NOP at delivery, although marginally, not statistically significant. The continuous advocacy for girl child education might have contributed to this finding. Education remains a key way to increasing ANC utilisation as well as having SBA.17 48 49 Therefore, educating the girl child may be an effective way to practise having NOP at delivery in Nigeria.16 23
The gender of the household heads contributed significantly to the reduction of NOP. Living in a male-headed household was associated with a reducing trend in NOP at delivery. The absence of a male household head could be associated with a decline in the economic stability of the household.50 The absence or death of a male household could cause attendant socioeconomic challenges to household members, including pregnant women. This could have limited the capacities of women from such households in using SBAs.
There was a significant contribution of media access to a reduction in NOP at delivery. Media access and exposure improve access to educational health programmes and social/behavioural change messages. A positive influence of mass media exposure on ANC attendance and consequent use of SBAs has been demonstrated in Nepal.51 Increased birth preparedness and skilled birth deliveries were specifically demonstrated with access to a newspaper in Uganda.52 Our study, therefore, showed that access to radio, newspaper and/or television remains one of the antidotes for ending NOP at birth in Nigeria.
This study demonstrated a general shift and increase in the composition of the rich which was associated with a reduction in the trend of NOP at delivery. Paradoxically, there was a reduction in the composition of the poorest, the poor and the middle, with all being associated with an increasing trend in NOP at delivery. Overall, the richer the household wealth quintile of the women, the higher the reduction in NOP at delivery over the years. It is prudent to suspect that there might have been regional differences in changes in the composition of wealth index and the associated influence on the trend of NOP at delivery thus, distorting the expected relationship. It is therefore right to conclude that the combined interlinks of household wealth quintile, media access and educational attainment, depending on a woman’s characteristics, could lower the incidence of NOP at delivery.
There were significant changes among Yoruba and other ethnic minorities, except for the Igbos, compared with Hausa/Fulani across the study period. This exerted a decreasing influence on the trend of NOP at delivery. This may be related to differences in sociocultural practices among ethnic nationalities and other socioeconomic inequalities. The northern part of Nigeria houses the bulk of the poverty burden of the country,53 and this study has shown that the region accounted for a disproportionately large share of the burden of NOP at delivery to the extent that some of the states (Gombe, Nasarawa and Yobe) in the region continued to demonstrate an increasing trend in NOP at delivery in contrast to the southern states. The implication is that the northern region of the country would need special focus and intervention in improving maternal and child healthcare if SDGs 3, 5 and 10 are to be achieved.1 The poorer outcomes in the northern part of the country can be attributed to lower educational and household wealth levels compared with the south. Fagbamigbe et al had established an association between household wealth and health-seeking behaviour and healthcare utilisation in Nigeria.53
There was a significant contribution by ANC attendance which expectedly exerted a reducing trend on NOP at delivery. ANC attendance could be expected to increase the exposure of women to birth preparedness and reinforced health education on best practices. An increase in ANC attendance would, therefore, increase the woman’s awareness and understanding of having SBAs especially skilled medical personnel during delivery. Several studies had established a linkage between ANC access to SBA.17 49 54 The women who had a timely and adequate number of contacts with ANC providers are at higher odds of having institutional delivery and consequently attended to by an SBA.
Regarding the decision-maker on respondents’ healthcare, both partners deciding on healthcare had significantly increased having NOP at delivery over the study period. Furthermore, the composition of respondents whose spouses were the sole decision-takers had a reducing impact on NOP at delivery. These interesting changes could be ascribed to increasing awareness of the need to use SBAs among male partners. Decisions on life activities including healthcare are influenced by the marriage culture in Nigeria and many parts of African societies.55 56 This influence is age-long and forms part of the traditional norms, culture and religious practices among many ethnic nationalities. The female partners are often required to seek permission from the male partners in decision-making, even in life-threatening emergencies.57 This is a known cause of delays in seeking healthcare and sometimes outright cancellation of hospital appointments especially in instances where the male partners are not at home and decisions would have to wait for their arrival.57 The increasing composition of women with a birth interval exceeding 36 months significantly reduced the trend of NOP at delivery. This finding may be associated with the demographic gains of the increasing use of family planning and contraceptive methods. The spacing of birth interval may have impacted NOP at delivery by its influence on improved birth preparedness generally. In all, we found that 5% of the changes over time are attributed to the observable explanatory variables (characteristics), while the remaining 85% were due to inherent coefficients that are not due to the listed characteristics. This implied that a further 15% reduction could be achieved if the identified variables/factors are further improved on and that an 85% reduction could also be achieved indirectly from the characteristics over time.
Our study showed some strengths that cannot be overlooked. First, this study shed light on changes in delivery with no one present between 1990 and 2018 in Nigeria, and decomposed factors contributing to these changes to reduce mortality levels in the country. The decomposition method used in this study is more robust in handling dichotomous outcomes than the Oaxaca-Blinder and the Fairlie methods. We have used national data collected using appropriate probability sampling, which makes our findings generalisable across the country. Nonetheless, we might have underestimated the actual burden of NOP at delivery in Nigeria as the data might have suffered recall bias. Besides, we could not draw a causal relationship between the explanatory and the outcome variables as the study design was cross-sectional. Information on some variables was collected in 2000 but not in 2008 and other NDHS. In addition, the definitions of some variables might have changed or be modified over the years. Six states were excluded from the state-level decomposition analysis due to insufficient sample sizes.
Recommendations
There is a dire need for the government including all maternal and child health stakeholders to increase sensitisation about the dangers inherent in deliveries with NOP among the population, especially among Muslims, the poorest and uneducated women. In addition, the socioeconomic statuses of the women should be improved on. This could be achieved via town hall meetings, community symposiums and enlightenment campaigns with community members including the community leaders, religious leaders, pregnant women and their families. This will not only reduce NOP but will also reduce child and maternal deaths in the country. For the practice of having NOP at delivery to be eradicated, there is a need to enrol all pregnant women into ANC and that they remain under the continuum of care. It has become expedient to empower women in terms of education and healthcare decision-making power. States with slow progress in the eradication of NOP at delivery and those with a high prevalence of NOP at delivery should benchmark the states with appreciable fast reduction rates and low prevalence, respectively. In particular, some states such as Gombe, Yobe and Nasarawa should develop interventions to turn around the trend by designing appropriate interventions to encourage the use of SBA. Achieving zero prevalence of NOP at delivery in Nigeria would require a special focus on healthcare utilisation, enhancing maternal education and healthcare utilisation decision-making power among others.
Conclusions
This study assessed the trend in women delivering with NOP over five waves of data in Nigeria and at the same time decomposed factors contributing to the changes at national and subnational levels. At the subnational level, the practice of having NOP at delivery was highest in Zamfara, Katsina and Kano states but lowest in Enugu and Osun states. While most states achieved a reduction in having NOP at delivery, Gombe, Yobe and Nasarawa had an increasing trend. Different factors have different levels of contribution across the different states. Our findings revealed that delivery with NOP in Nigeria declined between 1990 and 2018 but was more prevalent among Muslims, poorest and uneducated women. In addition, the decision-maker of healthcare use and women’s educational level were found to be the most significant contributors to changes in having NOP at delivery from 2003 to 2018 in the country. The leading contributors to the increments in NOP at delivery include insufficient ANC use, poor education, short preceding birth interval, spouse being the sole decision-maker of healthcare utilisation and neighbourhood SES disadvantage. There is a need for further studies such as a qualitative study to explore the influence of norms and sociocultural practices. This will enhance the design and implementation of socially and culturally acceptable programmes and interventions.
Supplementary Material
Acknowledgments
The authors thank the ICF for granting access to the dataset.
Footnotes
Contributors: AFF conceptualised and designed the study, analysed the data and provided the visualisations. AFF, SB, MMS, RFA, BMG and ASA contributed to literature search, data interpretation and writing of the manuscript. AFF is the guarantor of this work. All authors read and approved the manuscript.
Funding: The authors have not declared a specific grant for this research from any funding agency in the public, commercial or not-for-profit sectors.
Map disclaimer: The inclusion of any map (including the depiction of any boundaries therein), or of any geographic or locational reference, does not imply the expression of any opinion whatsoever on the part of BMJ concerning the legal status of any country, territory, jurisdiction or area or of its authorities. Any such expression remains solely that of the relevant source and is not endorsed by BMJ. Maps are provided without any warranty of any kind, either express or implied.
Competing interests: None declared.
Provenance and peer review: Not commissioned; externally peer reviewed.
Supplemental material: This content has been supplied by the author(s). It has not been vetted by BMJ Publishing Group Limited (BMJ) and may not have been peer-reviewed. Any opinions or recommendations discussed are solely those of the author(s) and are not endorsed by BMJ. BMJ disclaims all liability and responsibility arising from any reliance placed on the content. Where the content includes any translated material, BMJ does not warrant the accuracy and reliability of the translations (including but not limited to local regulations, clinical guidelines, terminology, drug names and drug dosages), and is not responsible for any error and/or omissions arising from translation and adaptation or otherwise.
Data availability statement
Data are available in a public, open access repository. The anonymised data are available in the public domain. The data supporting this article are available on request at www.dhsprogram.com. Extra data are available by emailing Bridgette Wellington (thedhsprogram@gmail.com), the data archivist.
Ethics statements
Patient consent for publication
Not required.
Ethics approval
Ethics approval was obtained from the ICF Institutional Review Board, USA (number FWA000008450) by the ICF International, the owners of the population-based secondary DHS datasets. The study did not involve any experiments. We were granted full access to use the data by ICF International with authorisation letter 144644. Duly signed informed consent to participate was obtained from all consenting participants before the interview started. Further information on the data and ethical considerations are available at dhsprogram.com. All methods were carried out in accordance with relevant guidelines and regulations.
References
- 1.United Nations . Sustainable development goals (SDG). Washington, DC, 2015. Available: http://www.un.org/sustainabledevelopment/sustainable-development-goals/
- 2.WHO . Making pregnancy safer: the critical role of the skilled attendant. WHO, 2014: 1–3. [Google Scholar]
- 3.WHO . Maternal health in Nigeria: generating information for action. WHO, 2019: 1. http://www.who.int/reproductivehealth/maternal-health-nigeria/en/ [Google Scholar]
- 4.WHO . Maternal mortality. Matern. mortal, 20151. Available: https://www.who.int/news-room/fact-sheets/detail/maternal-mortality [Accessed 19 Jan 2021].
- 5.Vogel JP, Fawole B, Adeniran AS, et al. The burden of severe maternal outcomes and indicators of quality of maternal care in Nigerian hospitals: a secondary analysis comparing two large facility-based surveys. BJOG 2019;126 Suppl 3:49–57. 10.1111/1471-0528.15698 [DOI] [PubMed] [Google Scholar]
- 6.Oladapo OT, Adetoro OO, Ekele BA, et al. When getting there is not enough: a nationwide cross-sectional study of 998 maternal deaths and 1451 near-misses in public tertiary hospitals in a low-income country. BJOG 2016;123:928–38. 10.1111/1471-0528.13450 [DOI] [PMC free article] [PubMed] [Google Scholar]
- 7.Souza JP. The Nigeria near-miss and maternal death survey: collaborative research generating information for action. BJOG 2019;126 Suppl 3:5–6. 10.1111/1471-0528.15749 [DOI] [PubMed] [Google Scholar]
- 8.Uneke CJ, Sombie I, Uro-Chukwu HC, et al. Developing equity-focused interventions for maternal and child health in Nigeria: an evidence synthesis for policy, based on equitable impact sensitive tool (EQUIST). Pan Afr Med J 2019;34:158. 10.11604/pamj.2019.34.158.16622 [DOI] [PMC free article] [PubMed] [Google Scholar]
- 9.Kongsri S, Limwattananon S, Sirilak S, et al. Equity of access to and utilization of reproductive health services in Thailand: national reproductive health survey data, 2006 and 2009. Reprod Health Matters 2011;19:86–97. 10.1016/S0968-8080(11)37569-6 [DOI] [PubMed] [Google Scholar]
- 10.Limwattananon S, Tangcharoensathien V, Sirilak S. Trends and inequities in where women delivered their babies in 25 low-income countries: evidence from demographic and health surveys. Reprod Health Matters 2011;19:75–85. 10.1016/S0968-8080(11)37564-7 [DOI] [PubMed] [Google Scholar]
- 11.Barros AJD, Ronsmans C, Axelson H, et al. Equity in maternal, newborn, and child health interventions in countdown to 2015: a retrospective review of survey data from 54 countries. Lancet 2012;379:1225–33. 10.1016/S0140-6736(12)60113-5 [DOI] [PubMed] [Google Scholar]
- 12.Hogan MC, Foreman KJ, Naghavi M, et al. Maternal mortality for 181 countries, 1980-2008: a systematic analysis of progress towards millennium development goal 5. Lancet 2010;375:1609–23. 10.1016/S0140-6736(10)60518-1 [DOI] [PubMed] [Google Scholar]
- 13.WHO . Skilled birth attendants. Sex Reprod Heal 2014. [Google Scholar]
- 14.Doctor HV, Findley SE, Ager A, et al. Using community-based research to shape the design and delivery of maternal health services in northern Nigeria. Reprod Health Matters 2012;20:104–12. 10.1016/S0968-8080(12)39615-8 [DOI] [PubMed] [Google Scholar]
- 15.Prata N, Ejembi C, Fraser A, et al. Community mobilization to reduce postpartum hemorrhage in home births in northern Nigeria. Soc Sci Med 2012;74:1288–96. 10.1016/j.socscimed.2011.11.035 [DOI] [PubMed] [Google Scholar]
- 16.Austin A, Fapohunda B, Langer A, et al. Trends in delivery with no one present in Nigeria between 2003 and 2013. Int J Womens Health 2015;7:345–56. 10.2147/IJWH.S79573 [DOI] [PMC free article] [PubMed] [Google Scholar]
- 17.Fagbamigbe A, Hurricane-Ike E, Yusuf O, et al. Trends and drivers of skilled birth attendant use in Nigeria (1990-2013): policy implications for child and maternal health. Int J Womens Health 2017;9:843–53. 10.2147/IJWH.S137848 [DOI] [PMC free article] [PubMed] [Google Scholar]
- 18.National Population Commission(NPC)[Nigeria], ICF International . Nigeria Demograhic health survey, 1990. Abuja, 1990. Available: www.dhsprogram.com
- 19.National Population Commission(NPC)[Nigeria], ICF International . Nigeria Demograhic health survey, 2003, 2003. Available: www.dhsprogram.com
- 20.20 National Population Commission(NPC)[Nigeria] & ICF Macro . National demographic and health survey. Niger Demogr Heal Surv 2009;2008:187–96 www.dhsprogram.com [Google Scholar]
- 21.National Population Commission(NPC)[Nigeria], ICF International . Nigeria Demograhic health survey, 2013. Abuja, 2014. Available: www.dhsprogram.com
- 22.National Population Commission(NPC)[Nigeria] and ICF . Nigeria demographic and health survey 2018. Abuja, Nigeria, And Rockville, Maryland, USA: NPC and ICF, 20192019. www.dhsprogram.com [Google Scholar]
- 23.Fapohunda BM, Orobaton NG. When women deliver with no one present in Nigeria: who, what, where and so what? PLoS One 2013;8:e69569. 10.1371/journal.pone.0069569 [DOI] [PMC free article] [PubMed] [Google Scholar]
- 24.Fapohunda B, Orobaton N. Factors influencing the selection of delivery with no one present in northern Nigeria: implications for policy and programs. Int J Womens Health 2014;6:171–83. 10.2147/IJWH.S54628 [DOI] [PMC free article] [PubMed] [Google Scholar]
- 25.Faye A, Niane M, Ba I. Home birth in women who have given birth at least once in a health facility: contributory factors in a developing country. Acta Obstet Gynecol Scand 2011;90:1239–43. 10.1111/j.1600-0412.2011.01163.x [DOI] [PubMed] [Google Scholar]
- 26.Singh K, Bloom S, Haney E, et al. Gender equality and childbirth in a health facility: Nigeria and MDG5. Afr J Reprod Health 2012;16:123–9. [PMC free article] [PubMed] [Google Scholar]
- 27.Corroon M, Speizer IS, Fotso J-C, et al. The role of gender Empowerment on reproductive health outcomes in urban Nigeria. Matern Child Health J 2014;18:307–15. 10.1007/s10995-013-1266-1 [DOI] [PMC free article] [PubMed] [Google Scholar]
- 28.WHO . Who recommendations on antenatal care for a positive pregnancy experience. Geneva, Switzerland, 2016. Available: https://www.who.int/reproductivehealth/publications/maternal_perinatal_health/anc-positive-pregnancy-experience/en/ [PubMed]
- 29.UNICEF . Situation of women and children in Nigeria | UNICEF Nigeria. Situat. women child. niger, 20201. Available: https://www.unicef.org/nigeria/situation-women-and-children-nigeria [Accessed 27 Dec 2020].
- 30.Andersen RM. Revisiting the behavioral model and access to medical care: does it matter? J Health Soc Behav 1995;36:1–10. 10.2307/2137284 [DOI] [PubMed] [Google Scholar]
- 31.Ryvicker M. A conceptual framework for examining healthcare access and navigation: a behavioral-ecological perspective. Soc Theory Health 2018;16:224–40. 10.1057/s41285-017-0053-2 [DOI] [PMC free article] [PubMed] [Google Scholar]
- 32.Ndwandwe D, Uthman OA, Adamu AA, et al. Decomposing the gap in missed opportunities for vaccination between poor and non-poor in sub-Saharan Africa: a multicountry analyses. Hum Vaccin Immunother 2018;14:2358–64. 10.1080/21645515.2018.1467685 [DOI] [PMC free article] [PubMed] [Google Scholar]
- 33.Sambala EZ, Uthman OA, Adamu AA, et al. Mind the gap: what explains the education-related inequality in missed opportunities for vaccination in sub-Saharan Africa? compositional and structural characteristics. Hum Vaccin Immunother 2018;14:2365–72. 10.1080/21645515.2018.1460985 [DOI] [PMC free article] [PubMed] [Google Scholar]
- 34.Fagbamigbe AF, Kandala NB, Uthman OA. Severe acute malnutrition among under-five children in low- and middle-income countries: a hierarchical analysis of associated risk factors. Nutrition 2020;75–76:110768. [DOI] [PubMed] [Google Scholar]
- 35.Powers DA, Yoshioka H, Yun M-S. mvdcmp: multivariate decomposition for nonlinear response models. Stata J 2011;11:556–76. 10.1177/1536867X1201100404 [DOI] [Google Scholar]
- 36.Blinder AS. Wage discrimination: reduced form and structural estimates. J Hum Resour 1973;8:436–55. 10.2307/144855 [DOI] [Google Scholar]
- 37.Oaxaca R. Male-Female wage differentials in urban labor markets. Int Econ Rev 1973;14:693–709. 10.2307/2525981 [DOI] [Google Scholar]
- 38.Filmer D, Pritchett LH. Estimating wealth effects without expenditure data--or tears: an application to educational enrollments in states of India. Demography 2001;38:115–32. 10.1353/dem.2001.0003 [DOI] [PubMed] [Google Scholar]
- 39.Worku AG, Tessema GA, Zeleke AA. Trends of modern contraceptive use among young married women based on the 2000, 2005, and 2011 Ethiopian demographic and health surveys: a multivariate decomposition analysis. PLoS One 2015;10:1–14. 10.1371/journal.pone.0116525 [DOI] [PMC free article] [PubMed] [Google Scholar]
- 40.Lincetto O, Mothebesoane-anoh S, Gomez P. Antenatal Care: Opportunities for Africa’s Newborns. Int J Sci Technol Res 2013;2:51–62. [Google Scholar]
- 41.Kuhnt J, Vollmer S. Antenatal care services and its implications for vital and health outcomes of children: evidence from 193 surveys in 69 low-income and middle-income countries. BMJ Open 2017;7:e017122. 10.1136/bmjopen-2017-017122 [DOI] [PMC free article] [PubMed] [Google Scholar]
- 42.Ganle JK, Parker M, Fitzpatrick R, et al. Inequities in accessibility to and utilisation of maternal health services in Ghana after user-fee exemption: a descriptive study. Int J Equity Health 2014;13:89. 10.1186/s12939-014-0089-z [DOI] [PMC free article] [PubMed] [Google Scholar]
- 43.Yaya S, Bishwajit G, Ekholuenetale M, et al. Factors associated with maternal utilization of health facilities for delivery in Ethiopia. Int Health 2018;10:310–7. 10.1093/inthealth/ihx073 [DOI] [PubMed] [Google Scholar]
- 44.Olakunde BO, Adeyinka DA, Mavegam BO, et al. Factors associated with skilled attendants at birth among married adolescent girls in Nigeria: evidence from the multiple indicator cluster survey, 2016/2017. Int Health 2019;11:545–50. 10.1093/inthealth/ihz017 [DOI] [PubMed] [Google Scholar]
- 45.Negero MG, Mitike YB, Worku AG, et al. Skilled delivery service utilization and its association with the establishment of women's health development Army in Yeky district, South West Ethiopia: a multilevel analysis. BMC Res Notes 2018;11:83. 10.1186/s13104-018-3140-0 [DOI] [PMC free article] [PubMed] [Google Scholar]
- 46.Sibley LM, Sipe TA. Transition to skilled birth attendance: is there a future role for trained traditional birth attendants? J Health Popul Nutr 2006;24:472–8. [PMC free article] [PubMed] [Google Scholar]
- 47.Stanton C. Steps towards achieving skilled attendance at birth. Bull. WHO, 2008: 241–320. https://www.who.int/bulletin/volumes/86/4/08-052928/en/ [DOI] [PMC free article] [PubMed] [Google Scholar]
- 48.Fagbamigbe AF, Olaseinde O, Setlhare V. Sub-national analysis and determinants of numbers of antenatal care contacts in Nigeria: assessing the compliance with the who recommended standard guidelines. BMC Pregnancy Childbirth 2021;21:1–19. 10.1186/s12884-021-03837-y [DOI] [PMC free article] [PubMed] [Google Scholar]
- 49.Fagbamigbe AF, Idemudia ES. Barriers to antenatal care use in Nigeria: evidences from non-users and implications for maternal health programming. BMC Pregnancy Childbirth 2015;15:1–10. 10.1186/s12884-015-0527-y [DOI] [PMC free article] [PubMed] [Google Scholar]
- 50.Fakir AMS, Abedin N. Empowered by absence: does male Out-migration empower female household heads left behind? J Int Migr Integr 2020:1–25. [Google Scholar]
- 51.Acharya D, Khanal V, Singh JK, et al. Impact of mass media on the utilization of antenatal care services among women of rural community in Nepal. BMC Res Notes 2015;8:345. 10.1186/s13104-015-1312-8 [DOI] [PMC free article] [PubMed] [Google Scholar]
- 52.Asp G, Odberg Pettersson K, Sandberg J, et al. Associations between mass media exposure and birth preparedness among women in southwestern Uganda: a community-based survey. Glob Health Action 2014;7:22904. 10.3402/gha.v7.22904 [DOI] [PMC free article] [PubMed] [Google Scholar]
- 53.Fagbamigbe AF, Bamgboye EA, Yusuf BO, et al. The Nigeria wealth distribution and health seeking behaviour: evidence from the 2012 national HIV/AIDS and reproductive health survey. Health Econ Rev 2015;5:e1–10. 10.1186/s13561-015-0043-9 [DOI] [PMC free article] [PubMed] [Google Scholar]
- 54.Fagbamigbe AF, Idemudia ES. Wealth and antenatal care utilization in Nigeria: policy implications. Health Care Women Int 2017;38:17–37. 10.1080/07399332.2016.1225743 [DOI] [PubMed] [Google Scholar]
- 55.Fagbamigbe AF, Akintayo AO, Oshodi OC, et al. Survival analysis and prognostic factors of time to first domestic violence after marriage among Nigeria, Kenya, and Mozambique women. Public Health 2020;181:122–34. 10.1016/j.puhe.2019.12.003 [DOI] [PubMed] [Google Scholar]
- 56.Mashau TS, Kone LR, Mutshaeni HN. Diversity in Africa: a cause for Disunity? J Sociol Soc Anthropol 2015;6:235–45. 10.1080/09766634.2015.11885663 [DOI] [Google Scholar]
- 57.Ganle JK, Obeng B, Segbefia AY, et al. How intra-familial decision-making affects women's access to, and use of maternal healthcare services in Ghana: a qualitative study. BMC Pregnancy Childbirth 2015;15:173. 10.1186/s12884-015-0590-4 [DOI] [PMC free article] [PubMed] [Google Scholar]
Associated Data
This section collects any data citations, data availability statements, or supplementary materials included in this article.
Supplementary Materials
bmjopen-2021-054328supp001.pdf (51KB, pdf)
Data Availability Statement
Data are available in a public, open access repository. The anonymised data are available in the public domain. The data supporting this article are available on request at www.dhsprogram.com. Extra data are available by emailing Bridgette Wellington (thedhsprogram@gmail.com), the data archivist.