

Abstract
Purpose:
Post-hemorrhage period after aneurysmal subarachnoid hemorrhage (aSAH) has several systemic manifestations including prothrombotic and pro-inflammatory states. Inter-relationship between these states using established/routine laboratory biomarkers and its long-term effect on clinical outcome is not well-defined.
Materials and methods:
Retrospective analysis of prospective cohort of 44 aSAH patients. Trend of procoagulant biomarkers [coated-platelets, mean platelet volume to platelet count (MPV:PLT)] and peripheral inflammatory biomarkers [platelet-lymphocyte ratio (PLR), neutrophil-platelet ratio (NLR)] were analyzed using regression analysis. Occurrence of delayed cerebral ischemia (DCI), modified Rankin score (mRS) of 3–6 and Montreal cognitive assessment (MoCA) of <26 at 1-year defined adverse clinical outcome.
Results:
Patients with worse mRS and MoCA score had higher rise in coated-platelet compared to those with better scores [20.4 (IQR: 15.6, 32.9) vs. 10.95 (IQR: 6.1, 18.9), p = 0.003] and [16.9 (IQR: 13.4, 28.1) vs. 10.95 (IQR: 6.35, 18.65), p = 0.02] respectively. NLR and PLR trends showed significant initial decline followed by a gradual rise in NLR among those without DCI as compared to persistent low levels in those developing DCI (0.13 units/day vs. −0.07 units/day, p = 0.06).
Conclusions:
Coated-platelet rise after aSAH is associated with adverse long-term clinical outcome. NLR and PLR trends show an early immune-depressed state after aSAH.
Keywords: Hemorrhagic stroke, Long-term stroke morbidity, Neutrophil-lymphocyte ratio, Platelet-lymphocyte ratio, Reactive platelets
1. Introduction
Aneurysmal subarachnoid hemorrhage (aSAH), affecting predominantly middle-aged women, is associated with both short-term and long-term morbidity and mortality [1,2]. Although, delayed cerebral ischemia (DCI) is reported as the major contributor for such adverse outcomes but recent evidence suggest early brain injury (EBI) phase of aSAH most likely triggers such downstream events. Several pathological derangement occur during EBI period, including acute hydrocephalus, transient cerebral oligemia, systemic inflammatory response (SIRS), while DCI involves cortical spreading ischemia, thrombosis, inflammation and vasospasm involving cerebral macro- and microvasculature [3]. Occurrence of DCI is often dependent on clinical and radiological severity at the time of presentation. The disease severity not only causes local brain injury in the form of EBI/DCI but also mounts SIRS [3] and often has an additive effect towards adverse outcome. Radiological, serological and clinical effects of such prothrombotic events after aSAH are reported [4-8]. Derangements in thrombotic and fibrinolysis pathways in aSAH are also described and frequently dependent on presenting acuity of aSAH as mentioned above [8-10]. The association between systemic rise in procoagulant platelets during EBI period and its association with DCI is described in our previous studies [8,11].
Such systemic responses with increased population of procoagulant platelets allude to either a neurohumoral effect on bone marrow with increased megakaryocytosis or de-novo activation of circulating platelets. Such rise in coated-platelets is associated with adverse short-term clinical outcome [8]. In addition to prothrombotic state, higher levels of admission serological systemic inflammatory biomarkers (e.g. neutrophil-lymphocyte-ratio, NLR and platelet-lymphocyte-ratio, PLR) are also associated with DCI and adverse clinical outcome at 3 months [12]. Similarly, quantitative radiological features on admission computed tomography (CT) scans of brain shows positive correlation with occurrence of DCI [13,14] and “dose-dependent” systemic metabolic derangement like stress induced hyperglycemia [15]. Our previous study demonstrated higher rise in coated-platelets during the early brain injury (EBI) period in patients with higher modified Fisher scale (mFS) scores as compared to low grade patients. However, it is to be noted that commonly used radiological scales like Fisher scale and mFS are assessor dependent and are not able to provide quantitative parameters to assess radiological severity or attribute “dose-effect” response after aSAH. It is also unknown whether such quantitative radiological features are linked to systemic prothrombotic and inflammatory response in aSAH patients.
Hence, in this exploratory study we investigated whether quantitative CT scan parameters at the time of aSAH occurrence can predict DCI and systemic procoagulant (using coated-platelet and MPV:PLT) and inflammatory (using NLR/PLR) response after aSAH. Establishing such association is aimed to identify and link systemic neurohumoral response after aSAH and its contributory pathophysiological role in DCI. We further report if such radiological parameters and coated-platelet trends determine clinical outcome at 1-year after aSAH. Results of this study would provide baseline data regarding systemic procoagulant and inflammation in response to quantitative radiological severity parameters after aSAH. These data can be used for future development of targeted therapeutic interventions to reduce or modify DCI burden related morbidity and also facilitate development of predictive tools for long-term clinical outcome.
2. Materials and methods
The present study was approved by Institutional Review Board at the University of Oklahoma Health Sciences Center in accordance with ethical standards for medical research laid down in the 1964 Declaration of Helsinki and its later amendments.
2.1. Patient screening, enrollment, characteristics
Enrollment, clinical characteristics of the present study is the same as our previously reported cohort [8]. Patients returning for their 1-year clinic follow-up were re-consented for their participation in the long-term follow-up portion of the study. A patient without appropriate CT scan was excluded from analysis. There were 7 additional patients from the original cohort who were lost to follow-up. Refer to Fig. 1 for patients enrolled, followed and analyzed.
Fig. 1.
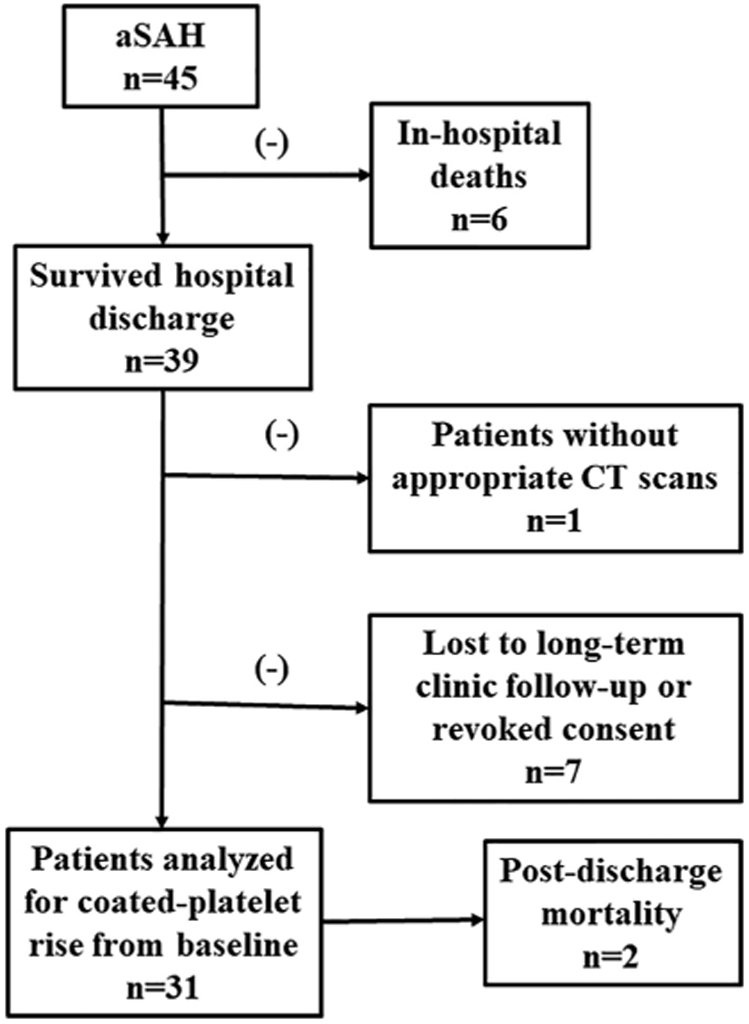
Flowchart illustrating patients included for the study.
2.2. Image analysis
CT scans of the cohort used for analyses were acquired within 24 h of symptom onset. The sensitivity of detecting blood after aSAH during this period, using modern CT scanner approaches ~100% [16]. An interactive computer-aided detection (CAD) tool was developed (by FA, GD and BZ) and tested to automatically segment brain tissue, detect and quantify brain parenchymal/subarachnoid hemorrhage and ventricular/subarachnoid cerebrospinal fluid (CSF) on non-contrast brain CT images. Details regarding the segmentation software has been described in our earlier publication [15]. Additional features to subcategorize location of blood products were added to an updated version of the existing software (by GD and BZ). In brief, the algorithm automatically segments brain regions by removing bony skull regions using a threshold of >96 Hounsfield Unit (HU). Subsequently, intracranial content is subcategorized into three regions namely, brain tissue (light grey), hemorrhage (white, TH1 ≥ 51 HU) and fluid (dark grey, TH2 ≤ 16 HU), respectively. Then, CAD scheme applied a multiple thresholding algorithm with two different values of (TH1 > TH2) to detect desired regions. Pixels with CT number greater than TH1 are segmented as blood region, while pixels with CT number smaller than TH2 are segmented as fluid region. Any pixels between TH1 and TH2 are classified as normal brain tissue. CAD scheme then computed a number of quantitative features or data. First, CAD scheme computes volumes of blood, CSF and brain tissue (in ml). Intracranial volume is determined as a combined volume of the above 3 parameters. Next, a ratio of intracranial blood volume, which is expressed as a ratio of blood volume to intracranial volume, is used to quantify and assess amount of intracranial bleeding in reference to the respective individual's intracranial volume. Similarly, total of the computed blood volume and CSF estimates fluid volume and this volume was regarded as a surrogate objective indicator for hydrocephalus. The second ratio namely, blood volume + CSF to intracranial volume is used as imaging biomarker to provide quantitative estimation of hydrocephalus.
2.3. Outcome measures
Clinical outcome measures included modified Rankin scale (mRS) to assess physical disability and Montreal cognitive assessment (MoCA) to assess cognitive disability at 1-year after aSAH. Definition for DCI was retained from our previous study [8] as a new hypodensity (excluding periprocedural hypodensities) on computed tomography (CT) scans located in a vascular or other territories and/or associated symptoms, including a decrease of consciousness and focal deficits, due to cerebral vasospasm and not explained by other causes (e.g., re-bleeding, hydrocephalus, cardio-embolic sources of emboli, hypoxia, electrolyte disturbances, or seizures).
2.4. Sample collection and analysis
Blood sample were collected during the 1-year follow-up clinic visit for measurement of coated-platelet level that was determined as patient's baseline. Coated-platelet levels (expressed as percentages of total platelet count) were measured using flow cytometry as previously described [17]. Individuals performing the coated-platelet assay were not aware of clinical diagnoses or outcomes corresponding to the sample analyzed. Coated-platelet levels obtained during acute hospitalization were retrospectively matched to analyze their trends and associative effects.
One of our previous studies [11] demonstrated that mean platelet volume: platelet count (MPV:PLT) showed a similar trend as coated-platelets in patients developing DCI. Hence, in this present study we investigated if MPV:PLT ratio has any significant association with coated-platelet levels. Corresponding available results of MPV:PLT (n = 41) - a procoagulant biomarker, NLR (n = 40), PLR (n = 40) - systemic inflammatory biomarkers retrospectively matched with the same day of coated-platelet level measurement.
2.5. Follow-up assessment
Clinic follow-up was performed by blinded certified evaluators and conducted approximately 1 year after the occurrence of aSAH. The mean follow-up was 13.3 ± 2.8 months and median 12.0 months (interquartile range, IQR 12.0, 14.0 months). During this visit investigators assessed physical status using mRS and cognitive status using MoCA test. A score of 3–6 on mRS and <26 on MoCA were considered as poor clinical outcomes. Patients (n = 2) who expired by 1-year follow-up were considered to have MoCA score of <26. Of note, the respective patients at 3-months' clinic follow-up one patient was in minimal conscious state while the other patient was aphasic and wheelchair-bound. A blood sample was collected to determine coated-platelet level. This sample being remote from ictus was considered as the patient's baseline coated-platelet level.
2.6. Statistical analysis
Non–linear mixed regression models were used to estimate the rate of change in coated-platelet levels (in percent per day) during the acute phase for each clinical outcome measure and each biomarker (i.e. MPV: PLT, NLR, PLR). We used the same assumptions as previously described for these models [8]. In brief, we hypothesized (based on our previous study) that a period of EBI and a subsequent DCI period could also be reflected in NLR, PLR trends similar to coated-platelet levels and MPV: PLT ratio [8,11]. To explore these trends, we constructed non-linear mixed regression models (SAS PROC NLMIXED v9.4) that included patient-specific random effects. The models' parameters were designed to estimate the slope of the two linear trends before a day of transition. The model also estimated the day of transition, along with a 95% confidence interval for that estimate. The non-linear regression models found consistent evidence of a transition or change in trend at around 4 days (range 3–5 days). In cases where the nonlinear model failed to converge (due to small subgroup sample sizes) we constructed segmented mixed linear regression models (SAS PROC MIXED v9.4) with an assumed day of transition from the nonlinear model results. Covariates for regression analysis included measures of clinical outcomes like the presence or absence of DCI, mRS of 0–2 or 3–6 and MoCA score of ≥26 or < 26. For each patient who attended clinic follow-up visit, we calculated the maximum change in coated-platelet levels as the difference between baseline, recorded at the time of follow-up visit, and the highest level recorded during hospitalization. Between-group differences in mean maximum change in coated-platelet levels were assessed using non-parametric exact permutation tests. A p-value of <0.05 was determined to be significant.
Using DCI as the outcome of interest, a receiver operating curve (ROC) analysis was used to determine the threshold that determined high and low intracranial fluid volumes. The maximum change in coated-platelet level (i.e. degree of rise) was calculated as the difference between baseline (defined as coated-platelet level obtained at post-discharge clinic follow-up) and the highest level recorded during the acute phase or hospitalization. The change in coated-platelets was compared between each clinical outcome measure using a non-parametric exact permutation test. Linear regression analysis was used to determine if there was a relationship between coated-platelet levels and each biomarker. Association of NLR, PLR, MPV:PLT with 1-year clinical outcome and effect of intervention to secure aneurysm (i.e. coiling or clipping) also studied using non-linear regression models.
3. Results
Forty-four patients with aSAH of our previously reported cohort and who had appropriate CT scan that could be quantified using our image analysis software were included in the present study. Blood samples from all 29 patients who completed 1-year clinic follow-up was drawn to determine their respective baseline coated-platelet levels (see Fig. 1). Baseline levels for additional 2 patients who expired between short-term and long-term follow-up were also available for data analysis. Baseline characteristic of the studied cohort is enumerated in Table 1.
Table 1.
Baseline demographic and clinical characteristics of patients (n = 44).
| Characteristics | n (%) |
|---|---|
| No. of women (%) | 31 (70.5) |
| Age: | |
| Mean ± SD (min. 26; max 83) | 54.7 ± 12.8 |
| Median (IQR) | 54.0 (46.5, 63.0) |
| Mean coated-platelet levels during clinic visit (n = 31) | 35.6 ± 10.4 |
| Hypertension | 27 (61.4) |
| Diabetes mellitus | 4 (9.1) |
| Hyperlipidemia | 10 (22.7) |
| Smoking | 32 (72.7) |
| Location of aneurysm | |
| Anterior circulation | 36 (81.8) |
| Posterior circulation | 8 (18.2) |
| Procedure for securing ruptured aneurysms | |
| Clip ligation | 32 (72.7) |
| Coil embolization | 12 (27.3) |
| Clinical characteristics Modified Fisher | |
| 1,2 | 15 (34.1) |
| 3,4 | 29 (65.9) |
| Hunt & Hess | |
| Grade I-III | 36 (81.8) |
| Grade IV, V | 8 (28.2) |
| World Federation of Neurological Surgeons Scale | |
| Grade 1–3 | 27 (61.4) |
| Grade 4,5 | 17 (38.6) |
| Delayed cerebral ischemia | |
| Yes | 29 (65.9) |
| No | 15 (34.1) |
| mRS at 1 year (n = 37) | |
| 0–2 | 22 (59.4) |
| 3–6 | 15 (40.5) |
| MoCA at 1 year (n = 37) | |
| ≥26 | 16 (43.2) |
| <26 | 21 (56.8) |
IQR – Interquartile range; MoCA - Montreal Cognitive Assessment; mRS - modified Rankin scale; SAH – Subarachnoid hemorrhage; SD – Standard deviation.
Average baseline coated-platelet level was 35.6 ± 10.4. Coated-platelet, MPV:PLT ratio, NLR, and PLR trends of these patients were retrospectively investigated to determine if there was a relationship with various clinical outcomes (i.e. DCI during hospitalization, mRS and MoCA at 1 year). Two hundred and one coated-platelet measurements were used to construct the regression model (Fig. 2). Similarly, 712 MPV:PLT, 539 NLR and 522 PLR values over 21 days of hospitalization were used to construct the regression model of the respective laboratory parameter to analyze their trends in predicting DCI. Estimated mean intracranial volume of the cohort was 1237.8 ± 157.4 ml with mean cisternal (subarachnoid) blood volume 21.3 ± 26.3 ml per 1000 ml intracranial volume, mean intraventricular blood volume 2.1 ± 5.2 ml per 1000 ml intracranial volume and mean CSF of 44.1 ± 30.1 ml per 1000 ml intracranial volume. Estimated median intracranial fluid volume (i.e. blood+CSF) was 47.8 (IQR 36.9–62.0).
Fig. 2.

Trend of coated-platelet levels after aneurysmal subarachnoid hemorrhage. Regression analysis shows trend of coated-platelet levels during hospitalization segregated as per 1-year mRS (a), MoCA (b), post-hemorrhagic blood (c) and blood+ CSF volumes. CSF - cerebrospinal fluid; MoCA - Montreal cognitive assessment; mRS - modified Rankin scale.
Patients who developed DCI during the acute phase and had worse mRS and MoCA had significantly higher volumes of intracranial blood or blood+CSF volumes (see Table 2 for details). The estimated rise in coated-platelets up to day 4.8 was steeper for those with mRS 3–6 as compared to those with mRS (0–2), however not statistically significant (p = 0.42) [Fig. 2a]. Similarly, the degree of rise in coated-platelets during acute phase was associated with worse mRS scores at 1 year (Fig. 3a; Table 3). Rate of rise in coated-platelet levels among those with poor MoCA score was similar prior to their transition day 4.6 (Fig. 2b). However, degree of rise in coated-platelet levels during hospitalization was associated with lower MoCA scores (Fig. 3b; Table 3).
Table 2.
Immediate and long-term clinical outcome in relation to intracranial blood and CSF volumes after aSAH.
| Clinical outcome |
n | Blood volume (in ml/ 1000 ml intracranial volume) Median (IQR) |
p-value | Blood + CSF volume (in ml/1000ml intracranial volume) Median(IQR) |
p-value |
|---|---|---|---|---|---|
| DCI (n = 44) | |||||
| Yes | 29 | 41.2 (24.7, 59.8) | 0.0008* | 72.9 (59.6, 93.2) | 0.003* |
| No | 15 | 9.0 (7.7, 23.1) | 55.4 (33.2, 73.6) | ||
| MoCA (n = 37) | |||||
| ≥26 | 16 | 23.9 (8.4, 41.3) | 0.1 | 52.6 (36.7, 72.3) | 0.01* |
| <26 | 21 | 39.7 (23.0, 60.0) | 80.1 (66.8, 96.3) | ||
| mRS (n = 37) | |||||
| 0–2 | 22 | 22.2 (8.0, 41.2) | 0.01* | 87.7 (73.6, 104.2) | 0.002* |
| 3–6 | 15 | 45.7 (33.5, 68.5) | 56.0 (37.4, 72.9) | ||
aSAH - aneurysmal subarachnoid hemorrhage; CSF - cerebrospinal fluid; DCI – delayed cerebral ischemia; IQR - interquartile range; MoCA - Montreal cognitive assessment test; mRS - modified Rankin scale; SD - standard deviation.
Indicates a significant difference at a significance level of 0.05.
Fig. 3.

Rise in coated-platelet levels above baseline after aneurysmal subarachnoid hemorrhage. Box-plots shows rise in coated-platelets above baseline segregated as per physical (a), cognitive (b) and intracranial blood (c) and blood+CSF volumes.
Table 3.
Rate and degree of rise in coated-platelet levels after aSAH.
| Clinical/Radiological Characteristic | Rate of rise in coated-platelets prior to decline |
Coated-platelet rise above baseline (n = 31) |
||||
|---|---|---|---|---|---|---|
| Estimated change (95% CI) | p-value | Median (IQR) | p-value | |||
| mRS | n | n | ||||
| 0–2 | 22 | 1.1 (−1.6, 3.9) | 0.42 | 22 | 10.95 (6.1, 18.9) | 0.003* |
| 3–6 | 15 | 2.3 (−0.7, 5.4) | 9 | 20.4 (15.6, 32.9) | ||
| MoCA | ||||||
| ≥26 | 16 | 1.87 (−1.2, 5.0) | 0.98 | 16 | 10.95 (6.35, 18.65) | 0.02* |
| <26 | 21 | 1.86 (−1.0, 4.7) | 15 | 16.9 (13.4, 28.1) | ||
| Blood volume/Tot. intracranial vol.a | ||||||
| Low | 20 | 1.2 (−1.7, 4.0) | 0.34 | 13 | 9.1 (6.1, 21.5) | 0.47 |
| High | 24 | 2.6 (0.2, 5.1) | 18 | 16.25 (11.0, 20.3) | ||
| Blood+CSF volume/Tot. intracranial vol.b | ||||||
| Low | 15 | 0.8 (−1.8, 3.4) | 0.15 | 11 | 13.9 (7.1, 20.3) | 0.77 |
| High | 29 | 3.3 (0.5, 6.0) | 20 | 15.5 (7.25, 20.9) | ||
aSAH - Aneurysmal subarachnoid hemorrhage; CSF - Cerebrospinal fluid; MoCA - Montreal cognitive assessment test; mRS - modified Rankin scale.
Indicates a significant difference between groups in the rate of change of coated-platelets before and after the transition day (at a significance level of 0.05).
ROC analysis determined threshold of 24 ml of blood volume per 1000 ml of intracranial volume with 81 % sensitivity and 76% specificity to dichotomize groups into low and high.
ROC analysis determined threshold of 56 ml of combined blood and CSF volume per 1000 ml of intracranial volume with 81% sensitivity and 76% specificity to dichotomize groups into low and high.
The cohort was subdivided into those with high intracranial blood (n = 24) and blood+CSF volumes (n = 29) and those with low intracranial blood (n = 20) and blood+CSF volume (n = 16). A threshold of 24 ml of blood per 1000 ml intracranial volume and 54 ml blood+CSF per 1000 ml intracranial volume segregated the respective subgroups. Although the rate of rise in coated-platelets was noted to be steeper during the EBI period in patients with higher intracranial blood and blood+CSF volumes they were not statistically significant. Similarly, the degree of rise in coated-platelet levels among those with higher and lower blood and CSF volumes were also not significant (Table 3; Fig. 2c, d and 3c, d). Using the blood+CSF threshold, thus controlling for hydrocephalus, we analyzed trends of coated-platelets as per location of blood (i.e. cisternal only vs. cisternal + intraventricular) and were unable to demonstrate a difference in trends (Supplemental Fig. S1). Coated-platelet trends also did not differ among those undergoing clip ligation or coil embolization as an aneurysm securing procedure.
Peripheral blood indices, MPV:PLT was analyzed to compare its concordance with coated-platelet levels and systemic procoagulant potency while PLR and NLR trends were studied as a biomarker for systemic inflammation. Average admission MPV:PLT was not significantly different among those developing DCI as compared to those without DCI (4.9 ± 1.3 vs. 3.9 ± 1.8, p =0.41). There was a significant rise in MPV:PLT among those developing DCI [0.76 units/day (95% CI: 0.24 to 1.27, p = 0.005)] as compared to those without DCI [0.45 units/day (95% CI: 0.22 to 0.69, p = 0.004)]. Intergroup slope difference during the EBI period in MPV:PLT was 0.3 (95% CI: −0.6 to 0.01, p = 0.06) [Fig. 4a]. There was a significant positive linear correlation between MPV:PLT and coated-platelets (r = +0.36; p < 0.0001). As MPV:PLT increases by 1 unit, coated-platelets increase by 0.04 (Fig. 4b). Average admission PLR was although higher in patients developing DCI as compared to those without DCI (399.4 vs. 297.4, p = 0.16) but where not significantly different. There was significant fall in PLR during the EBI period both among those with and without DCI until post-bleed day, PBD 4 followed by a gradual rise (Fig. 4c, Table 4). However, intergroup trends were not significantly different. PLR and coated-platelets collected on the same day showed a significant inverse correlation between PLR and coated-platelets (r = −0.28; p =0.0001) (Fig. 4d). As PLR increases by 1 unit, coated-platelets decrease by 2.06. Similar to PLR trends, NLR trends during EBI period among those with and without DCI showed significant initial decline until around PBD 6 (Table 4) followed by a slow rise in NLR among those without DCI as compared to persistent low levels in those developing DCI [0.13 units/day vs. −0.07 units/day, p = 0.06] (Fig. 4e). However, no correlation was noted between coated-platelets and NLR (Fig. 4f). There was a significant rise in MPV:PLT ratio during the EBI period among patients undergoing coil embolization that persisted during hospitalization as compared to clip ligation (Supplmental Fig. 2a). On the contrary, NLR and PLR trend showed more immunosuppression among those undergoing clip ligation (Supplemental Fig. S2 b, c). Trends of MPV:PLT, NLR and PLR are segregated as per 1-year mRS and MoCA scores are summarized in Supplemental Fig. S3 and Table 4.
Fig. 4.

Trends of peripheral blood indices in comparison to coated-platelets after aneurysmal subarachnoid hemorrhage. (a) MPV:PLT trends segregated as per DCI status; (b) association of MPV:PLTwith coated-platelet trends during hospitalization; (c) PLR trends as per DCI status; (d) association of PLR with coated-platelets during hospitalization; (e) NLR trends as per DCI status; (f) scatter plot shows absence of association between NLR and coated-platelet levels. DCI - delayed cerebral ischemia; MPV:PLT - mean platelet volume-platelet count ratio; NLR - neutrophil-to-lymphocyte ratio; PLR - platelet-to-lymphocyte ratio.
Table 4.
Rate of change in peripheral blood indices after aneurysmal subarachnoid hemorrhage.
| Laboratory parameter | DCI |
No DCI |
||||
|---|---|---|---|---|---|---|
| n | Estimated rise in biomarker (95% CI) | p-value | n | Estimated rise in biomarker (95% CI) | P-value | |
| MPV:PLT | 28 | 0.76 (0.24, 1.27) | 0.005* | 13 | 0.45 (0.22, 0.69) | 0.0004* |
| PLR | 27 | −35.4 (−59.0, −11.7) | 0.004* | 13 | −30.0 (−41.6, −18.5) | 0.007* |
| NLR | 27 | −0.78 (−1.42, −0.13) | 0.02* | 13 | −1.13 (−1.47, −0.78) | <0.0001* |
| mRS 3–6 | mRS 0–2 | |||||
| MPV:PLT | 15 | 0.54 (−0.21, 1.29) | 0.15 | 20 | 0.16 (−0.37, 0.67) | 0.55 |
| PLR | 15 | −44.5 (−87.3, 1.65) | 0.04* | 19 | −57.9 (−91.3, −24.5) | 0.001* |
| NLR | 15 | −0.28 (−1.12, 0.55) | 0.49 | 19 | −2.11 (−2.96, −1.27) | <0.0001* |
| MoCA < 26 | MoCA ≥ 26 | |||||
| MPV:PLT | 21 | 0.79 (0.14, 1.43 | 0.02* | 14 | 0.50 (0.19, 0.80) | 0.002* |
| PLR | 20 | −25.5 (−39.2, −11.8) | <0.0001* | 14 | −47.9 (−63.3, −32.5) | 0.0003* |
| NLR | 20 | −0.31 (−1.08, 0.45) | 0.42 | 14 | −2.32 (−3.28, −1.36) | < 0.0001* |
CI - confidence interval; DCI – delayed cerebral ischemia; MoCA – Montreal cognitive assessment; MPV:PLT - mean platelet volume-to-platelet count ratio; mRS – modified Rankin scale; NLR - neutrophil-lymphocyte ratio; PLR - platelet count-lymphocyte ratio.
Indicates a significant increase/decline between presentation and transition day (at a significance level of 0.05).
4. Discussion
The present study is a retrospective analysis of our earlier reported prospective cohort of aSAH patients enrolled between July 2014 and April 2016 [8]. We have now evaluated the role of quantitative radiological parameters and systemic procoagulant state in determination of long-term outcomes. Our study reports rise in coated-platelets during EBI phase to be associated with adverse clinical outcome at 1-year clinic follow-up. Patients with higher quantitative radiological parameters show a trend of steeper rise in coated-platelets during the EBI period [Fig. 2c, d; Table 3]. Similarly, the noted rise in MPV:PLT during the EBI period allude to a period of increased procoagulant activity that strongly correlates with coated-platelet trends. Of note, coated-platelets are a subpopulation of platelets that retains prothrombotic substances on their surfaces, when stimulated simultaneously with convulxin and thrombin, and is used as a surrogate marker to determine platelet-related thrombogenicity in aSAH [8,18]. The coated-platelet and MPV: PLT trends' correlation supports potential use of MPV:PLT as a surrogate biomarker for activated platelets in aSAH. Using similar commonly available ratios, PLR and NLR trends show a period of early immune-depression during the EBI period, similar to those reported previously [19,20]. Identification of such patterns is opined to be more important for biological samples rather than a mathematical p-value to designate significance [21]. Thus, our study results objectively show EBI period of aSAH to be associated with increased thrombogenicity and early immune-depression that are closely related to presence of increased subarachnoid blood products and CSF (i.e. hydrocephalus), alluding to a brain injury and SIRS cross-talk.
4.1. Systemic inflammatory response after aSAH and its radiological correlate
Occurrence of DCI and adverse clinical outcome at 3-month clinic follow-up is reported with SIRS resulting in rise of systemic interleukin-6 (IL-6) levels after aSAH [22]. Higher volume of cisternal and intraventricular blood is associated with increased incidence of DCI and worse 3-month outcome [14]. Similarly, recent segmentation analysis of aSAH patients showed highest correlation for occurrence of DCI with cisternal blood [13]. Pathophysiological mechanisms that are postulated to account for SIRS after aSAH includes release of catecholamines, direct effect on hypothalamus (resulting in hypothalamic-pituitary-adrenal, HPA axis activation) and acute rise in intracranial pressure (ICP) [3,23]. Moreover, radiological parameters assessing cerebral autoregulation and perfusion are dependent on clinical severity and may or may not result in cerebral infarctions [24]. Our study confirms contributory role of “dose-dependent” relationship of intracranial blood products and CSF volume with DCI occurrence. Higher volume of blood + CSF is likely representative of increased ICP. However, since concurrent ICP values at the time of extraventricular drain (EVD) placement are not available, we are unable to confirm this hypothesis. Although, a steeper rise in coated-platelets (Fig. 2c, d) during EBI period and its strong correlation with MPV:PLT was noted in patients with higher intracranial fluid volume we are unable to establish a “dose-dependent” prothrombotic neurohumoral effect. Similar, prothrombotic state is described previously [8,25].
4.2. Role of activated platelets in prothrombotic state and long-term outcome after aSAH
Long-term cognitive effects of aSAH were recently reviewed [26]. Although using MoCA to measure cognitive impairment (as used in our study) is a validated scale in aSAH population, its sensitivity in identifying patients attaining physical independence at 1-year is debated [27-30]. A radiological study evaluating cognitive deficits at 1-year after aSAH showed positive association with single photon emission tomography index despite poor correlation with infarction on CT scans [30]. Such findings possibly allude to a persistence of non-ischemic, global neurovascular phenomenon involving brain network disruption, persistent neuroinflammation and neuronal communication dysfunction as described after traumatic brain injury [31]. The role of platelets in neuroinflammation and cognitive impairment is described and our previous study in the same cohort showed strong association between rise in coated-platelets and adverse short-term clinical outcome [8,32,33]. Our present study shows that significant rise in coated-platelets during acute phase is associated with worse mRS and MoCA (Fig. 3a, b). These clinical outcomes are positively associated with amount of intracranial blood and CSF volumes. Consistent with existing literature, of the 29 patients who attended clinic follow-up at 1-year 22 (75.9%) were independent with mRS 0–2 while 21 (72.4%) had cognitive impairment with MoCA score of <26. Patient having worse mRS 3–6 had a relatively steeper rise in coated-platelets during the EBI period (Fig. 2a) while no difference in trends was observed for those with or without cognitive outcome at 1-year. Hence, it may be speculated although coated-platelets trends after aSAH may not be an independent determinant of cognitive outcome but degree of rise from its baseline (Fig. 3b) may have a contributory role. It is noteworthy that platelets also have immunomodulatory and “disease resolution” effects in addition to its prothrombotic role [34]. Hence, it is difficult to predict with our study design, which of these functions the platelets are sub-serving in our persistent observation of high coated-platelet levels during the EBI period in both DCI and non-DCI subgroups after aSAH. We also observed significant rise in MPV:PLT ratio in patients undergoing coil embolization during the EBI period (Supplemental Fig. S2 a) as compared to those with clip ligation. Such association may make us speculate that coil embolization induces an early and persistent period of prothrombotic state significance of it is unknown. It is uncertain if platinum coils to secure ruptured aneurysms might have resulted in systemic prothrombotic response in addition to local inflammatory response in the aneurysm [35].
4.3. Role of immune-suppression in DCI and long-term clinical outcome after aSAH
Unlike other peripheral organs, brain injury does not mount usual inflammatory response through recruitment of inflammatory cells like neutrophils and monocytes [20]. Similarly, detrimental effect of acute brain injury on peripheral cells is also reviewed [36]. Although increased NLR and PLR (indicating proinflammatory state) after aSAH is reported to be associated with DCI and adverse clinical outcome [12], persistence of immune-depression is also reported in symptomatic patient and those having increased incidence of infections [37]. PLR and NLR in our cohort at the time of ictus are similar to those reported by Tao et al. [12]. However, as their study only analyzed admission PLR and NLR they were unable to report the state of immune-depression as reported by an earlier study [37]. Hence, our regression analysis model conforms to previous reports. In addition, we are able to demonstrate that monitoring easily available laboratory test results like NLR and PLR, we can study temporal disease activity in aSAH. Significance of greater degree of immune-depression observed in patients undergoing clip ligation in our cohort as compared to coil embolization remains speculative. We believe acknowledging this immune depressed state after aSAH is important observation for researchers as therapies targeting SIRS response is developed. Higher ictal PLR in patients developing DCI was observed as compared to those without DCI but our dataset was unable to segregate their trends during hospitalization in predicting DCI (Fig. 4a). Similarly, there was no difference in regression analysis model for NLR among those developing DCI as compared to those without DCI during the EBI period. However, a trend towards persistent immune-depression was noted with NLR trends among those with DCI while a gradual recovery in NLR among those without DCI (Fig. 4e). Such trends are often associated with increased risk of infection in patients developing DCI [37].
4.4. Study limitations and future directions
We acknowledge several limitations with our present study including a small cohort size and single center study design. Although this is a retrospective analysis of our prospective cohort the radiological part was not pre-planned hence we had to exclude a patient as we could not analyze the admission CT scan using our image analysis software. Similarly, analysis of MPV:PLT, PLR and NLR was also not pre-planned leading to exclusion of patients. Data of two patients who expired during 3-month and 1-year follow-up was included to the adverse outcome arm of MoCA analysis. However, it is to be noted that both the patients had clinical disability precluding them to participate in MoCA testing at 3-months. Hence, it is extremely unlikely that these two patients, if they survived, would have scored MoCA ≥26 at 1-year follow-up. But we acknowledge the possibility of such bias in our study results. In addition, the segmentation software developed to estimate the blood and CSF volumes was based on predetermined HU-dependent pixel thresholds. Our estimation of volume may vary depending on software developed at other institutions or commercially available versions. Hence, values obtained in our study may not be comparable to other similar studies; however, intra-study validity is maintained. There is a possibility that SIRS observed in this study can reflect elevated intracranial pressure that cannot be verified due to retrospective nature and absence of documentation of opening pressure at the time of EVD insertion. Future studies need to be designed to verify principles of this study using predetermined inclusion and exclusion criteria.
5. Conclusions
The present study, despite above-mentioned limitations, is able to demonstrate presence of an early neurohumoral response, especially during the EBI period of aSAH. Such an event is noted to cause increased prothrombotic and immune-depressive states during EBI phase that also have long-term clinical effects. Our study also provides valuable baseline data necessary to verify if these commonly available peripheral blood biomarkers can be used to predict clinical outcomes after aSAH.
Supplementary Material
Acknowledgments
Authors would like to acknowledge D. M. Thompson, PhD for initially developing the statistical regression model for data-set during our previous publication [8]. We also acknowledge contribution of research assistants, Ms. Blair Apple, BS and Ms. Chanel Seraphin, LPN with Department of Neurology, OUHSC for their help with sample collection and data management during the study.
Financial support
This study was supported in part by the US Department of Veterans Affairs Clinical Science Research & Development Service (CX000340) and Oklahoma Centre for Neuroscience & Oklahoma University Biomedical Engineering Centre Interdisciplinary Research Grant Program, 2016.
Abbreviations:
- aSAH
Aneurysmal subarachnoid hemorrhage
- CAD
Computer-aided detection
- CI
Confidence interval
- CSF
Cerebrospinal fluid
- CT
Computed tomography
- DCI
Delayed cerebral ischemia
- EBI
Early brain injury
- EVD
External ventricular drain
- H&H
Hunt and Hess
- HU
Hounsfield units
- ICFV
Intracranial fluid volume
- ICHV
Intracranial hemorrhage volume
- IL
Interleukin
- IQR
Interquartile range
- MoCA
Montreal cognitive assessment
- mFS
Modified Fisher scale
- MPV
Mean platelet volume
- mRS
Modified Rankin scale
- NLR
Neutrophil-lymphocyte ratio
- PLR
Platelet-lymphocyte ratio
- PLT
Platelet count
- ROC
Receiver operator characteristic
- SAH
Subarachnoid hemorrhage
- SIRS
Systemic inflammatory response syndrome
- TH
Threshold hounsfield
- WFNS
World federation of neurological surgeon
Footnotes
Author disclosures and conflict of interests
Bappaditya Ray - Declares no relevant conflicts of interests. He received local grant to conduct this study. He received consultancy reimbursement from Minnetronix Inc., Minneapolis, MN and Coleman Research, New York, NY in the past 1 year.
Stephen R Ross - Declares no relevant conflicts of interests.
Gopichand Danala - Declares no relevant conflicts of interests.
Faranak Aghaei - Declares no relevant conflicts of interests.
Claire Delpirou Nouh - Declares no relevant conflicts of interests.
Lance Ford - Declares no relevant conflicts of interests.
Kimberly M Hollabaugh - Declares no relevant conflicts of interests.
Brittany N Karfonta - Declares no relevant conflicts of interests.
Joshua A Santucci - Declares no relevant conflicts of interests.
Benjamin O Cornwell - Declares no relevant conflicts of interests.
Bradley N Bohnstedt - Declares no relevant conflicts of interests. He received consultancy and speaker reimbursement fees from Penumbra Inc., Alameda, CA in the past 1 year.
Bin Zheng - Declares no relevant conflicts of interests. He received local grant to conduct this study.
George L Dale - Declares no relevant conflicts of interests.
Calin I Prodan - Declares no relevant conflicts of interests.
Ethical approval and compliance with ethical standards
All procedures performed in studies involving human participants were in accordance with the ethical standards of the institutional and/ or national research committee and with the 1964 Helsinki declaration and its later amendments or comparable ethical standards.
Supplementary data to this article can be found online at https://doi.org/10.1016/j.jcrc.2019.03.003.
Informed consent
Informed consent was obtained from all individual participants and/ or their next-to-kin included in the study.
Availability of data and materials
The datasets generated and/or analyzed during the current study are not publicly available due institutional IRB policies but are available from the corresponding author on reasonable request.
Competing interests
The author(s) declare(s) that they have no competing interests in regards to the work included in the present manuscript.
References
- [1].Brinjikji W, Kallmes DF, Lanzino G, Cloft HJ. Hospitalization costs for endovascular and surgical treatment of ruptured aneurysms in the United States are substantially higher than Medicare payments. AJNR Am J Neuroradiol 2012;33(6):1037–40. [DOI] [PMC free article] [PubMed] [Google Scholar]
- [2].Taylor TN, Davis PH, Torner JC, Holmes J, Meyer JW, Jacobson MF. Lifetime cost of stroke in the United States. Stroke J Cereb Circ 1996;27(9):1459–66. [DOI] [PubMed] [Google Scholar]
- [3].Macdonald RL. Delayed neurological deterioration after subarachnoid haemorrhage. Nat Rev Neurol 2014;10(1):44–58. [DOI] [PubMed] [Google Scholar]
- [4].Romano JG, Forteza AM, Concha M, Koch S, Heros RC, Morcos JJ, et al. Detection of microemboli by transcranial Doppler ultrasonography in aneurysmal subarachnoid hemorrhage. Neurosurgery 2002;50(5):1026–30 [discussion 30-1]. [DOI] [PubMed] [Google Scholar]
- [5].Frontera JA, Provencio JJ, Sehba FA, McIntyre TM, Nowacki AS, Gordon E, et al. The role of platelet activation and inflammation in early brain injury following subarachnoid hemorrhage. Neurocrit Care 2017;26(1):48–57. [DOI] [PMC free article] [PubMed] [Google Scholar]
- [6].Frontera JA, Aledort L, Gordon E, Egorova N, Moyle H, Patel A, et al. Early platelet activation, inflammation and acute brain injury after a subarachnoid hemorrhage: a pilot study. J Thromb Haemost 2012;10(4):711–3. [DOI] [PubMed] [Google Scholar]
- [7].Frontera JA, Ahmed W, Zach V, Jovine M, Tanenbaum L, Sehba F, et al. Acute ischaemia after subarachnoid haemorrhage, relationship with early brain injury and impact on outcome: a prospective quantitative MRI study. J Neurol Neurosurg Psychiatry 2015;86(1):71–8. [DOI] [PubMed] [Google Scholar]
- [8].Ray B, Pandav VM, Mathews EA, Thompson DM, Ford L, Yearout LK, et al. Coated-platelet trends predict short-term clinical OutcomeAfter subarachnoid hemorrhage. Transl Stroke Res 2018;9(5):459–70. [DOI] [PMC free article] [PubMed] [Google Scholar]
- [9].Ikeda K, Asakura H, Futami K, Yamashita J. Coagulative and fibrinolytic activation in cerebrospinal fluid and plasma after subarachnoid hemorrhage. Neurosurgery 1997;41(2):344–9 [discussion 9-50]. [DOI] [PubMed] [Google Scholar]
- [10].Fujii Y, Takeuchi S, Sasaki O, Minakawa T, Koike T, Tanaka R. Hemostasis in spontaneous subarachnoid hemorrhage. Neurosurgery 1995;37(2):226–34. [DOI] [PubMed] [Google Scholar]
- [11].Ray B, Tinsley L, Ford L, Thompson DM, Sidorov EV, Bohnstedt BN. Trends of platelet volume index predicts delayed cerebral ischemia after subarachnoid hemorrhage. World Neurosurg 2018;111:e624–31. [DOI] [PubMed] [Google Scholar]
- [12].Tao C, Wang J, Hu X, Ma J, Li H, You C. Clinical value of neutrophil to lymphocyte and platelet to lymphocyte ratio after aneurysmal subarachnoid hemorrhage. Neurocrit Care 2017;26(3):393–401. [DOI] [PubMed] [Google Scholar]
- [13].van der Steen WE, Zijlstra IA, Verbaan D, Boers AMM, Gathier CS, van den Berg R, et al. Association of Quantified Location-Specific Blood Volumes with delayed cerebral ischemia after aneurysmal subarachnoid hemorrhage. AJNR Am J Neuroradiol 2018;39(6):1059–64. [DOI] [PMC free article] [PubMed] [Google Scholar]
- [14].Ko SB, Choi HA, Carpenter AM, Helbok R, Schmidt JM, Badjatia N, et al. Quantitative analysis of hemorrhage volume for predicting delayed cerebral ischemia after subarachnoid hemorrhage. Stroke J Cereb Circu 2011;42(3):669–74. [DOI] [PubMed] [Google Scholar]
- [15].Santucci JA, Ross SR, Greenert JC, Aghaei F, Ford L, Hollabaugh KM, et al. Radiological estimation of intracranial blood volume and occurrence of hydrocephalus determines stress-induced hyperglycemia after aneurysmal subarachnoid hemorrhage. Transl Stroke Res 2018. July 11. 10.1007/s12975-018-0646-7 (in press). [DOI] [PubMed] [Google Scholar]
- [16].Cortnum S, Sorensen P, Jorgensen J. Determining the sensitivity of computed tomography scanning in early detection of subarachnoid hemorrhage. Neurosurgery 2010;66(5):900–2 [discussion 3]. [PubMed] [Google Scholar]
- [17].Prodan CI, Vincent AS, Kirkpatrick AC, Hoover SL, Dale GL. Higher levels of coated-platelets are observed in patients with subarachnoid hemorrhage but lower levels are associated with increased mortality at 30 days. J Neurol Sci 2013;334(1–2): 126–9. [DOI] [PubMed] [Google Scholar]
- [18].Dale GL. Coated-platelets: an emerging component of the procoagulant response. J Thromb Haemost 2005;3(10):2185–92. [DOI] [PubMed] [Google Scholar]
- [19].Dirnagl U, Klehmet J, Braun JS, Harms H, Meisel C, Ziemssen T, et al. Stroke-induced immunodepression: experimental evidence and clinical relevance. Stroke J Cereb Circu 2007;38(2 Suppl):770–3. [DOI] [PubMed] [Google Scholar]
- [20].Meisel C, Schwab JM, Prass K, Meisel A, Dirnagl U. Central nervous system injury-induced immune deficiency syndrome. Nat Rev Neurosci 2005;6(10):775–86. [DOI] [PubMed] [Google Scholar]
- [21].Betensky RA. Is this significant? Ann Neurol 2017;81(3):344–7. [DOI] [PMC free article] [PubMed] [Google Scholar]
- [22].Muroi C, Hugelshofer M, Seule M, Tastan I, Fujioka M, Mishima K, et al. Correlation among systemic inflammatory parameter, occurrence of delayed neurological deficits, and outcome after aneurysmal subarachnoid hemorrhage. Neurosurgery 2013;72(3):367–75 [discussion 75]. [DOI] [PubMed] [Google Scholar]
- [23].Gao C, Liu X, Shi H, Xu S, Ji Z, Wang C, et al. Relationship between sympathetic nervous activity and inflammatory response after subarachnoid hemorrhage in a perforating canine model. Auton Neurosci 2009;147(1–2):70–4. [DOI] [PubMed] [Google Scholar]
- [24].Griffiths PD, Wilkinson ID, Mitchell P, Patel MC, Paley MNJ, Romanowski CAJ, et al. Multimodality MR imaging depiction of hemodynamic changes and cerebral ischemia in subarachnoid hemorrhage. Am J Neuroradiol 2001;22(9):1690–7. [PMC free article] [PubMed] [Google Scholar]
- [25].Hirashima Y, Nakamura S, Endo S, Kuwayama N, Naruse Y, Takaku A. Elevation of platelet activating factor, inflammatory cytokines, and coagulation factors in the internal jugular vein of patients with subarachnoid hemorrhage. Neurochem Res 1997;22(10):1249–55. [DOI] [PubMed] [Google Scholar]
- [26].Zaki Ghali MG, Srinivasan VM, Wagner K, Rao C, Chen SR, Johnson JN, et al. Cognitive sequelae of subarachnoid hemorrhage, cerebral aneurysm treatment, and neuropsychological assessment. World neurosurgery; 2018. [DOI] [PubMed] [Google Scholar]
- [27].Wallmark S, Ronne-Engstrom E, Lundstrom E. Predicting return to work after subarachnoid hemorrhage using the Montreal cognitive assessment (MoCA). Acta Neurochir 2016;158(2):233–9. [DOI] [PubMed] [Google Scholar]
- [28].Orbo M, Waterloo K, Egge A, Isaksen J, Ingebrigtsen T, Romner B. Predictors for cognitive impairment one year after surgery for aneurysmal subarachnoid hemorrhage. J Neurol 2008;255(11):1770–6. [DOI] [PubMed] [Google Scholar]
- [29].Wong GK, Lam SW, Wong A, Lai M, Siu D, Poon WS, et al. MoCA-assessed cognitive function and excellent outcome after aneurysmal subarachnoid hemorrhage at 1 year. Off J Eur Fed Neurol Soc 2014;21(5):725–30. [DOI] [PubMed] [Google Scholar]
- [30].Egge A, Waterloo K, Sjoholm H, Ingebrigtsen T, Forsdahl S, Jacobsen EA, et al. Outcome 1 year after aneurysmal subarachnoid hemorrhage: relation between cognitive performance and neuroimaging. Acta Neurol Scand 2005;112(2):76–80. [DOI] [PubMed] [Google Scholar]
- [31].Sharp DJ, Scott G, Leech R. Network dysfunction after traumatic brain injury. Nat Rev Neurol 2014;10(3):156–66. [DOI] [PubMed] [Google Scholar]
- [32].Prodan CI, Ross ED, Stoner JA, Cowan LD, Vincent AS, Dale GL. Coated-platelet levels and progression from mild cognitive impairment to Alzheimer disease. Neurology 2011;76(3):247–52. [DOI] [PMC free article] [PubMed] [Google Scholar]
- [33].Langer HF, Chavakis T. Platelets and neurovascular inflammation. Thromb Haemost 2013;110(5):888–93. [DOI] [PubMed] [Google Scholar]
- [34].Herter JM, Rossaint J, Zarbock A. Platelets in inflammation and immunity. J Thromb Haemost 2014;12(11):1764–75. [DOI] [PubMed] [Google Scholar]
- [35].Byrne JV, Hope JK, Hubbard N, Morris JH. The nature of thrombosis induced by platinum and tungsten coils in saccular aneurysms. AJNR Am J Neuroradiol 1997;18(1): 29–33. [PMC free article] [PubMed] [Google Scholar]
- [36].Catania A, Lonati C, Sordi A, Gatti S. Detrimental consequences of brain injury on peripheral cells. Brain Behav Immun 2009;23(7):877–84. [DOI] [PubMed] [Google Scholar]
- [37].Sarrafzadeh A, Schlenk F, Meisel A, Dreier J, Vajkoczy P, Meisel C. Immunodepression after aneurysmal subarachnoid hemorrhage. Stroke J Cereb Circ 2011;42(1):53–8. [DOI] [PubMed] [Google Scholar]
Associated Data
This section collects any data citations, data availability statements, or supplementary materials included in this article.