Abstract
Purpose:
Quantitative assessment of prospective motion correction (PMC) capability at 7T MRI for compliant healthy subjects to improve high resolution images in the absence of intentional motion.
Methods:
21 healthy subjects were imaged at 7T. They were asked not to move, in order to consider only unintentional motion. An in-bore optical tracking system was used to monitor head motion and consequently update the imaging volume. For all subjects, high resolution T1 (3D-MPRAGE), T2 (2D-TSE), Proton-Density (PD, 2D-TSE) and T2* (2D-GRE) weighted images were acquired with and without PMC. The images were evaluated through subjective and objective analysis.
Results:
Subjective evaluation overall has shown a statistically significant improvement (5.5%) in terms of image quality with PMC ON. In a separate evaluation of every contrast three out of the four contrasts, T1, T2 and PD, have shown a statistically significant improvement (9.62, 9.85 and 9.26%), whereas the fourth one (T2*) has shown improvement although not statistically significant. In the evaluation with objective metrics, average edge strength has shown an overall improvement of 6% with PMC ON, which was statistically significant; and gradient entropy has shown an overall improvement of 2%, which did not reach statistical significance.
Conclusion:
Based on subjective assessment, PMC improved image quality in high resolution images of healthy compliant subjects in the absence of intentional motion for all contrasts except T2*, where no significant differences were observed. Quantitative metrics showed an overall trend for an improvement with PMC, but not all differences were significant.
Keywords: PMC, Optical Motion Tracking System (OMTS), high resolution structural MRI, ultra-high field, image quality assessment
1 |. INTRODUCTION
With the growing use of ultra-high field MRI, higher spatial resolutions can be achieved. With increasing resolution, more phase encoding steps are required while at the same time the available signal-to-noise ratio decreases. Thus, high resolution imaging (isotropic voxel size ≤ 0.5 mm) can require longer scan time (several tens of minutes). During these lengthy high-resolution acquisitions, even compliant subjects move unintentionally, i.e. due to breathing and muscle relaxation [1, 2]. For high-resolution imaging, the amplitude of these unintentional motions is on the scale of the voxel size, hence, can introduce image artifacts, which effectively negate the advantage of high resolution. With prospective motion correction (PMC) [3], it is possible to limit the image degradation caused by head motion [1, 4, 5]. PMC uses position and orientation tracking data of the head in 3D space to update the imaging volume in real time [6]. The tracking data can be obtained in various ways, differing in terms of accuracy and precision [4, 7–11]. For high-resolution MRI, prospective motion correction with Moiré phase tracking (MPT) — an external, in-bore, optical tracking system — is currently considered the gold standard [12, 13] and was therefore used in this study. This MPT system was used in several high-resolution studies and showed image improvements, both qualitatively and quantitatively, when motion is corrected prospectively [1, 14–16]. However, these studies focused on a single contrast and included only small cohorts (1 to 11 subjects). Thus, a comprehensive assessment of the performance of PMC for high resolution MRI in a larger cohort is missing. To that end, we acquired data of twenty-one healthy subjects for four different sequences at 7T. To mimic a routine research setting, subjects were asked not to move (unlike most motion correction studies that correct for intentional motion). The images were assessed subjectively through expert ratings and objectively with image metrics. The aim of this work was to verify and quantify if PMC can significantly improve image quality at 7T, for healthy compliant subjects and in the regime of “quasi-no-motion” as introduced by Stucht et al. [1]. This study is not meant to assess the performance of PMC for a broader population of subjects inexperienced with MRI.
2 |. METHODS
Twenty-one healthy subjects (14 males, 31.5 ± 6.1 years, and 7 females, 27.3 ± 3.4 years), were scanned in two separate sessions, each with a duration of 75 minutes. The procedures were approved by the local ethics committee and all subjects provided informed written consent prior to participation. Scanning was performed with a 7T whole-body MRI scanner (Siemens Healthineers, Erlangen, Germany), using a 32-channel head coil (Nova Medical, Wilmington, MA, USA) and an optical motion tracking system (OMTS) that consisted of an MR compatible camera (MT384i, Metria Innovation Inc., Milwaukee, WI, USA) and a Moiré Phase Tracking (MPT) marker (Metria Innovation Inc., Milwaukee, WI, USA), Figure 1.
FIGURE 1. Optical Motion Tracking System.
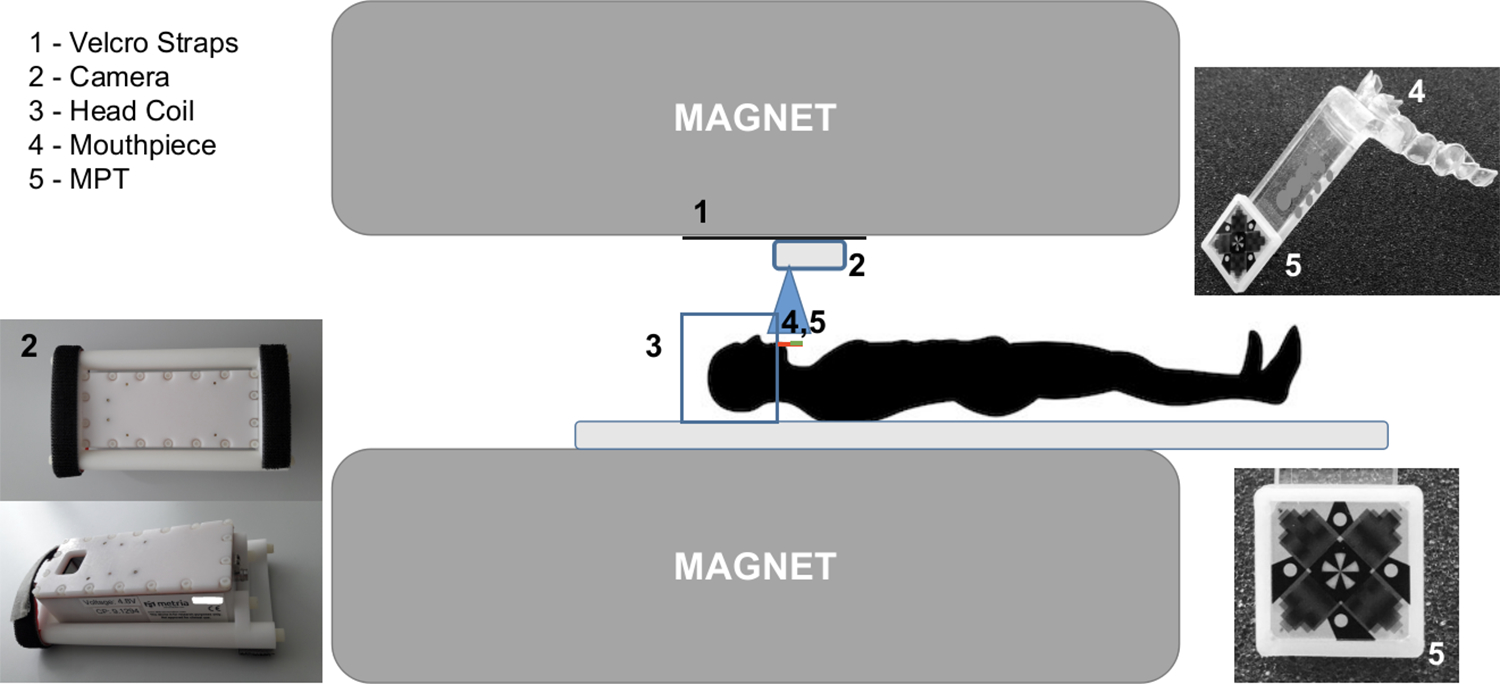
The camera (2) has two Velcro straps. Additional Velcro straps (1) are permanently glued to the bore of the scanner, enabling the mounting and unmounting of the camera when necessary. The blue square (3) represents the head coil, the red line the (4) Mouthpiece and (5) Moiré Phase Tracking (MPT) marker.
2.1 |. Optical Motion Tracking System and MR Sequences
The operational principle of the Optical Motion Tracking System (OMTS) is the detection of the 3D position (X, Y, Z) and orientation (Pitch, Yaw, Roll) based on the Moiré phase patterns generated by the MPT marker, see Figure 1. A dental impression was tailor-made for each subject in order to produce a personalized mouthpiece to which the MPT marker was attached [1], Figure 1. The utilization of personal mouthpieces facilitates a rigid coupling and thus, prevents pseudo motion. All participants were previously imaged at 3T MRI and at least 66% of the participants were also imaged at 7T. Four subjects had also a precedent experience with PMC. None of the subjects ever reported any kind of problem with the mouthpiece, nor has there been any kind of complaint during or after the scan sessions. The in-bore camera was mounted and unmounted for each session using Velcro straps, Figure 1. The optical camera was set to acquire 80 frames/s and the marker was tracked with a precision of 0.01 mm and 0.01°, for translations (x, y, z) and rotations (α, β, γ, corresponding to Pitch, Yaw and Roll), respectively [17]. Tracking data, position, and orientation, once extracted from each frame (with a separate control PC), were continuously sent to the MRI scanner to update the imaging volume once per repetition time (TR), prior to each excitation.
Before use in human subjects, the tracking system was calibrated following the procedure proposed by Zaitsev et al. [8].
All the sequences were tested on a phantom in order to check the image quality for a non-moving object. In addition, we evaluated the impact of mechanical vibrations produced by gradients during scans on the OMTS. This was done by scanning a stationary phantom with the same sequences used in vivo and motion correction enabled.
The sequences used in this study were developed in previous studies which made use of PMC [1]. The contrasts acquired were: PD (Proton-Density), T2, T1 and T2*. The PD and T2 were acquired using a 2D-Turbo Spin Echo sequence (TSE), both with an in-plane resolution of 0.28×0.28 mm2 and a slice thickness of 1.0 mm. The T1-weighted images were acquired using a 3D-MPRAGE sequence with an isotropic resolution of 0.45 mm. The T2*-weighted images were acquired with a 2D-GRE (FLASH) sequence with three different in-plane resolutions: 0.25×0.25, 0.35×0.35 and 0.5×0.5 mm2, keeping the slice thickness constant at 1.5 mm, referred henceforth as T2*−w (025), T2*−w (035) and T2*−w (05). All the sequences and respective parameters used are summarized in Table 1. As mentioned above, there were two separate sessions on different dates: the first one for the acquisition of T1, T2 and PD scans; and the second for the remaining T2* scans. Within each session, the order of acquired sequences and of application of PMC was randomized. The subjects were explicitly instructed to remain as stationary as possible during every scan. For the entire cohort, the total number of image volumes acquired was 252. The motion tracking information, both with PMC OFF and ON, was stored in separate log files. For each contrast, separately for PMC OFF and ON, the tracking information was averaged to calculate the global mean and standard deviation for every degree of freedom. Statistical analyses of displacements and rotations were calculated using the following equations:
| (1) |
ΔX, ΔY, ΔZ, ΔA, ΔB and ΔΓ are arrays containing the displacements and rotations completed in the time δt = 1 sec, and n is the number of time points of each sequence. The histograms for each of the above arrays were calculated and a statistical analysis was performed using the Mann–Whitney U test [18].
TABLE 1.
Sequence parameters. T2* Iso is the abbreviation of isotropic
| Sequence | 3D-MPRAGE | 2D-TSE | 2D-TSE | 2D-GRE | 2D-GRE | 2D-GRE |
|---|---|---|---|---|---|---|
| Contrast | T1 | T2 | PD | T2* | T2* | T2* |
| Motion correction (PMC) | On/Off | On/Off | On/Off | On/Off | On/Off | On/Off |
| In-plane resolution (mm) | 0.45 iso* | 0.28 iso* | 0.28 iso* | 0.5 iso* | 0.35 iso* | 0.25 iso* |
| Slice thickness (mm) | 0.45 | 1.0 | 1.0 | 1.5 | 1.5 | 1.5 |
| Matrix size (voxel) | 496×496 | 690×704 | 690×704 | 336×448 | 480×640 | 672×896 |
| Voxel volume (mm3) | 0.091 | 0.078 | 0.078 | 0.375 | 0.184 | 0.094 |
| slices | 416 | 15 | 15 | 30 | 30 | 30 |
| TR (ms) | 2820 | 6000 | 6000 | 680 | 680 | 680 |
| TE (ms) | 2.82 | 59.0 | 9.9 | 16.6 | 15.1 | 16.6 |
| TI (ms) | 1050 | - | - | - | - | - |
| Flip angle (°) | 5 | 130 | 130 | 30 | 30 | 30 |
| Bandwidth (Hz/px) | 170 | 473 | 473 | 60 | 60 | 60 |
| Total ADC duration (ms) | 5.88 | 2.11 | 2.11 | 16.67 | 16.67 | 16.67 |
| TA (mm:ss) | 12:12 | 5:12 | 5:12 | 8:21 | 11:37 | 15:58 |
| Parallel imaging | GRAPPA 2 | GRAPPA 2 | GRAPPA 2 | GRAPPA 2 | GRAPPA 2 | GRAPPA 2 |
To avoid possible bias in the assessment between PMC OFF vs. ON, the scans (Off/On) that presented strongly different motion patterns in the same subject were excluded, i.e., if the subject moved much more or much less during one of the acquisitions. Figure 2 portrays the workflow followed to exclude scans that showed different motion:
Motion patterns recorded by the OMTS;
Calculation of the distributions, see Equation 1, mean and standard deviation values for each degree of freedom;
Average of standard deviations for displacements and rotations;
Calculation of the motion parameter ratio between scans: , selection of subjects with similar motion patterns (i.e. ratio of 1±0.5), and exclusion of subjects where this ratio was smaller than 0.5 or larger than 1.5.
FIGURE 2. An example of motion pattern analysis and exclusion of volumes:
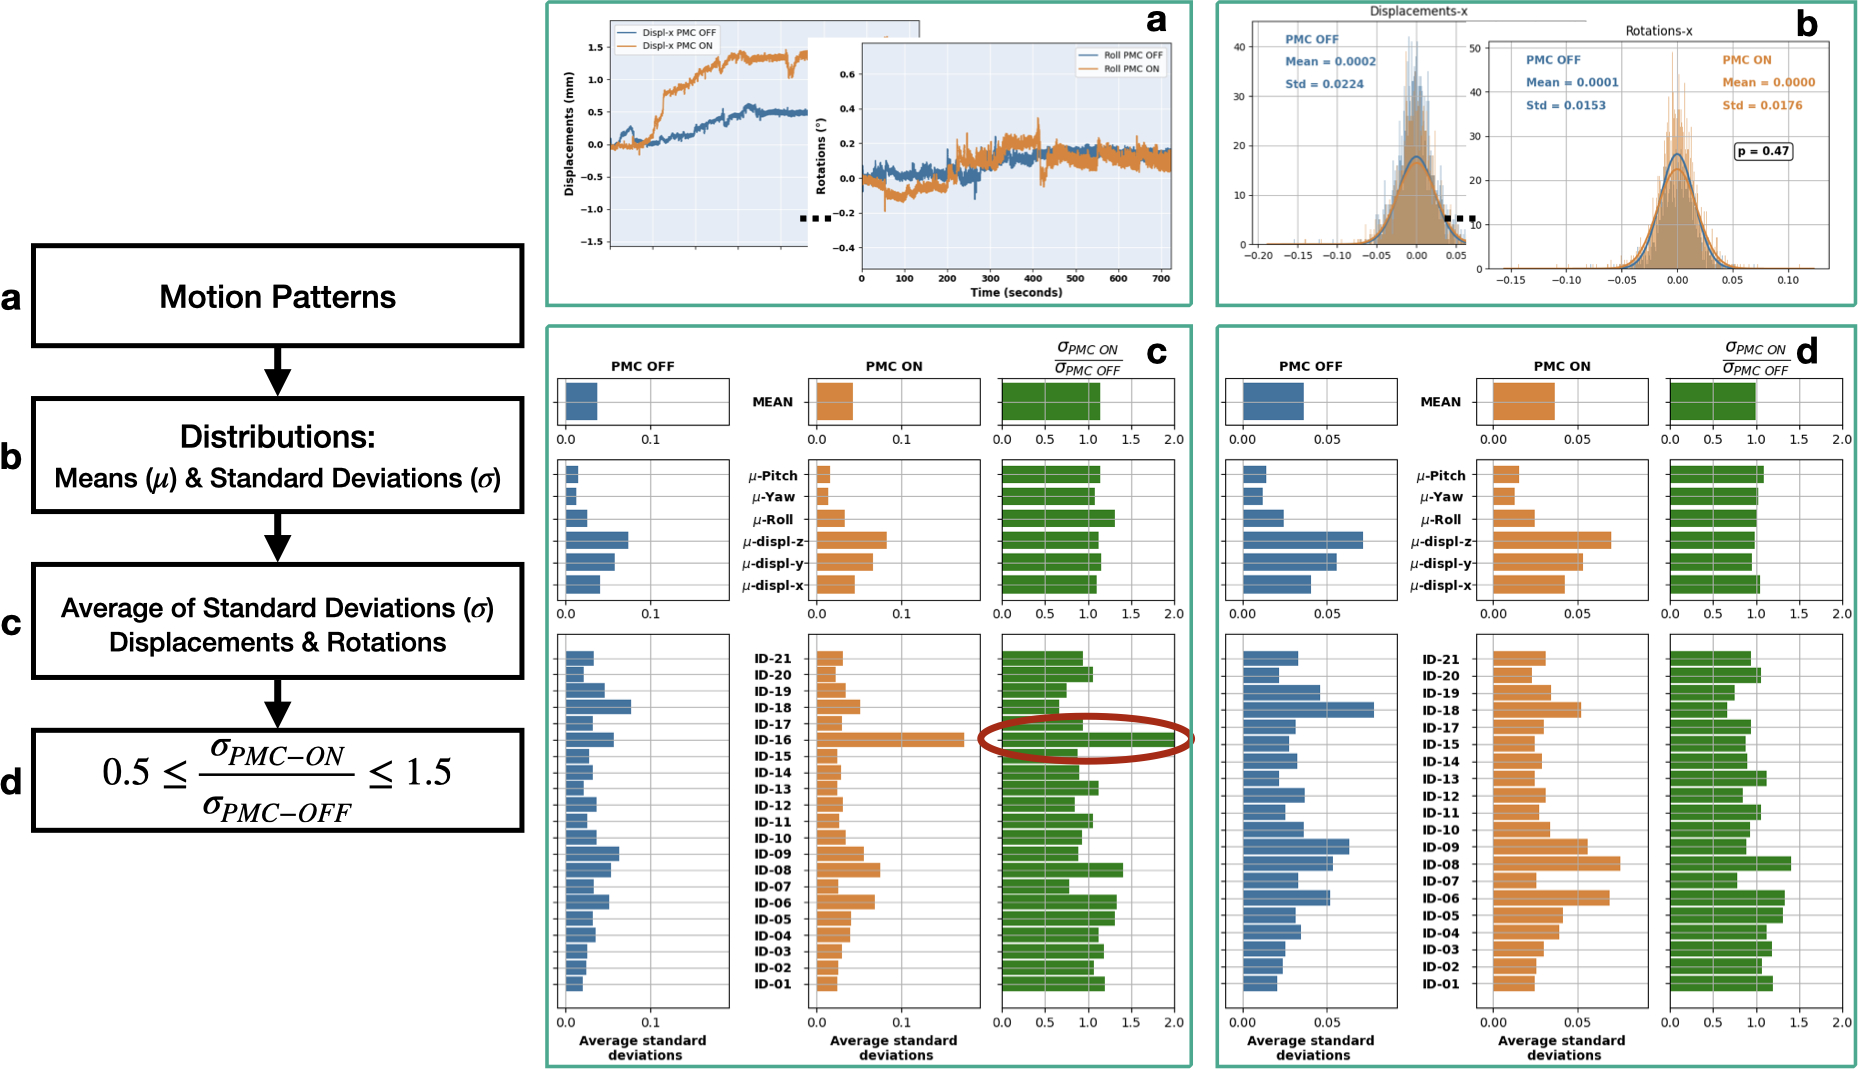
a) motion tracking data; b) calculation of distributions, Equation 1; c) average of standard deviation values of displacements and rotations for each subject/acquisition; d) filtered volumes, as explained in section 2.
2.2 |. Subjective Image Quality Assessment
Subjective assessments of image quality were performed by four neuroscientists, having at least five years of experience in working with MR image processing and image quality assessment. The raters scored the image quality, looking in particular at the level of corruption due to motion artifacts. Scans were subdivided into six different groups, one for each contrast and for each in-plane resolution as in the case of T2*-w images. A blinded side-by-side comparison (the order of presentation of two images with and without PMC was randomized) was done by each rater. The raters scored every scan by answering the following question: “Please rate the image quality considering the presence of motion artifacts from 1 to 10”, where 1 corresponds to the worst image quality (highest presence of motion artifacts), and 10 to the best image quality (no motion artifacts). The only instruction given to the raters was to score the image quality in a paired (side-by-side) comparison, assigning the scores to both image volumes. To assess the agreement across raters, the intra-class correlation coefficient (ICC) was calculated [19, 20] using Pingouin [21], Figure 3.
FIGURE 3. Intra-class correlation coefficient (ICC).
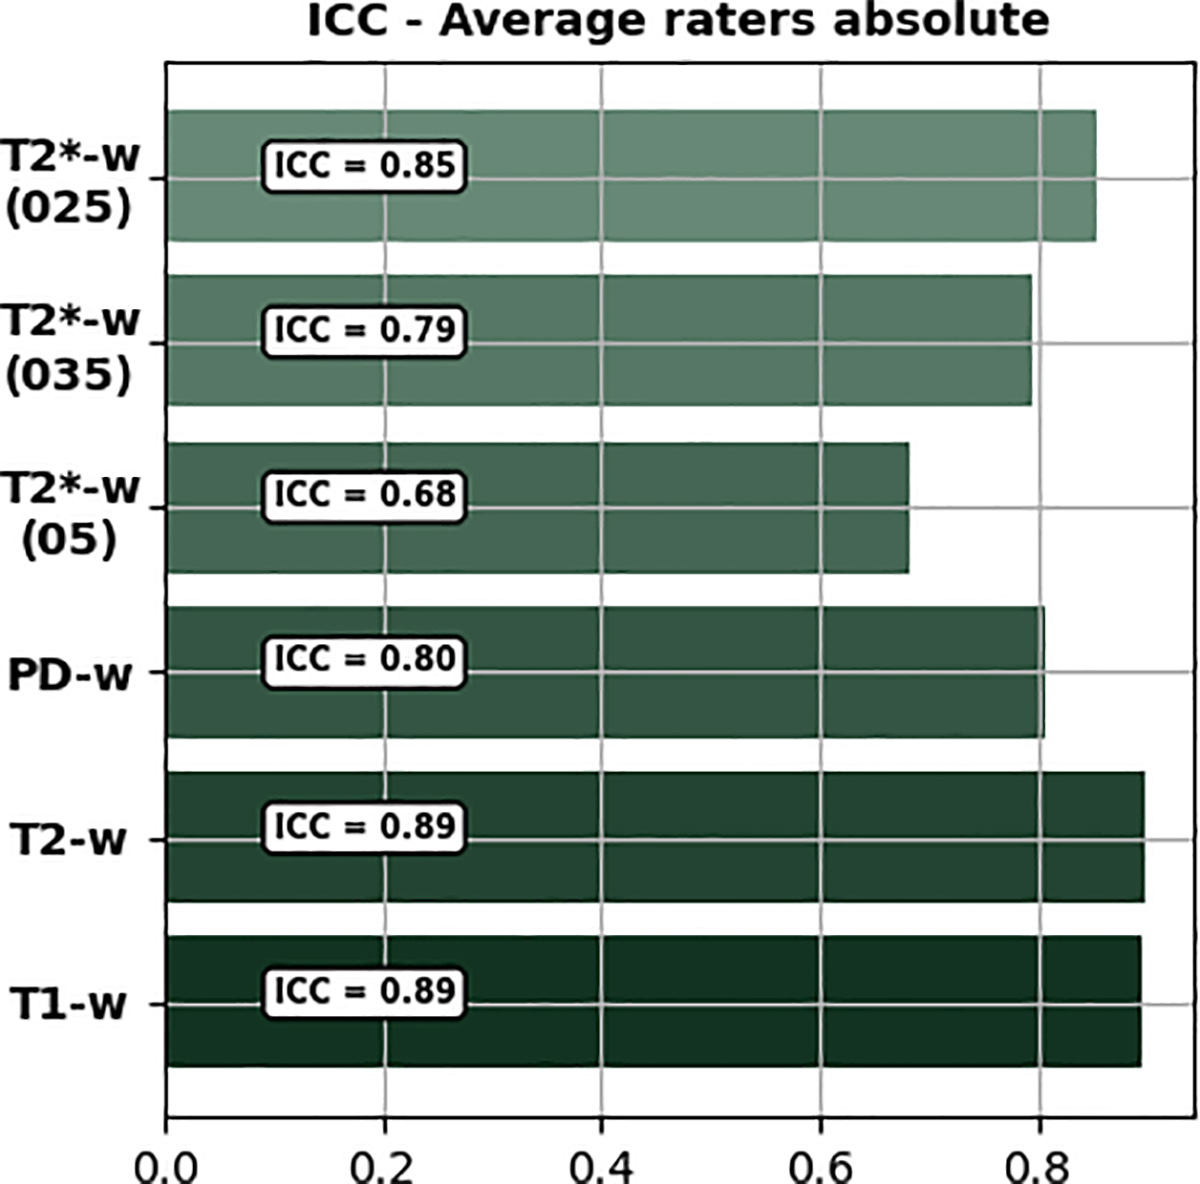
Average raters absolute ICC per group.
2.3 |. Objective Image Quality Assessment
Several metrics for quantitative MR image quality assessment or to evaluate the presence of motion artifacts have been proposed [5, 22–24]. The MRIQC tool [22] is a valuable resource for automated quality assessment, but, it mainly addresses T1 and T2 contrast image volumes acquired at lower magnetic fields (1.5T and 3.0T). The framework proposed by Pannetier et al. for PMC evaluation makes use of two indicators, the average edge strength (AES) that quantifies the image blurring at edges and a Haralick texture-based indicator [5]. Gradient entropy is also commonly used to quantify differences in terms of quality for MR images [23]. In this study, AES and gradient entropy were used as metrics to judge the image quality quantitatively. The AES values decrease with increasing motion artifacts, and the gradient entropy values increase with an increasing level of corruption [5, 23]. The Mann–Whitney U test was applied for the statistical analysis of the results [18].
3 |. RESULTS
For each of the quality assessments, there were three possible scenarios. First, the images acquired with PMC were visibly better than the images of the same subject obtained with the same sequence but acquired without PMC; second, images acquired with and without PMC had the same or nearly the same image quality; third, the images acquired with PMC were worse than those acquired without PMC support. In Figure 4, examples of the results obtained with and without PMC illustrate these three possible scenarios.
FIGURE 4. Sample images:
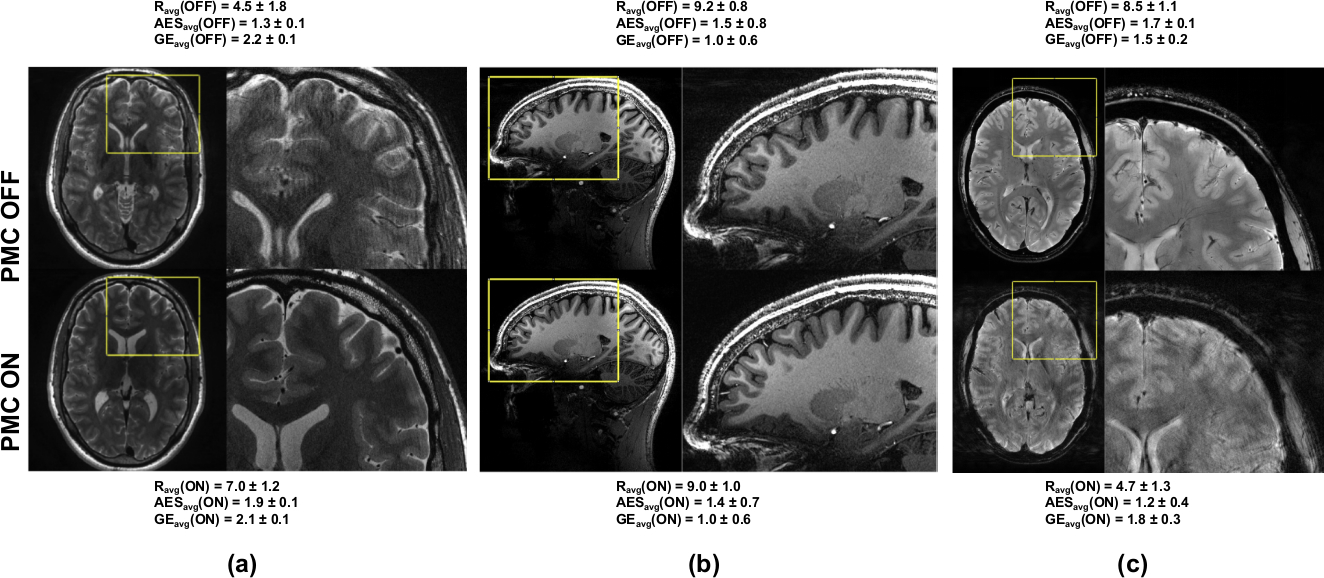
All three possible scenarios. (a) PMC OFF worse performance than PMC ON, T2-w images with resolution 0.28×0.28×1.0 mm3; (b) PMC OFF similar performance as PMC ON, T1-w images, isotropic resolution over all slices in the volume for AES and gradient entropy metrics respectively. 0.45 mm3; (c) PMC OFF better performance than PMC ON (reflections in the OMTS system, explained in Fig.5), T2∗-w images, resolution 0.25×0.25×1.5 mm3. Ravg is the average subjective score, while AESavg and GEavg, the average scores over all slices in the volume for AES and gradient entropy metrics respectively.
Following the scheme discussed earlier (see Sec. 2.1, Figure 2), few subjects were excluded from each group. For example, T1-w images of Sub-ID 16 were excluded because the subject moved too much during the acquisition with PMC ON, as shown in Figure 2. Similarly, Sub-IDs 4, 6, 13 and 18 for T2−w, 4, 6, 15 and 18 for PD, 6 for T2*−w (05), 6, 15 and 16 for T2*−w (035); and finally, 20 for T2*−w (025) were also excluded. Additionally, T2*−w (025) of Sub-ID 16 was excluded because of the presence of reflections of the marker, leading to erroneous tracking, shown in Figure 5 - which is a limitation of such systems. Reflections occur if the marker is oriented exactly perpendicular to the camera and thus the marker illumination is reflected into the camera by the marker surface.
FIGURE 5. Motion patterns in the event of reflections of the MPT marker:
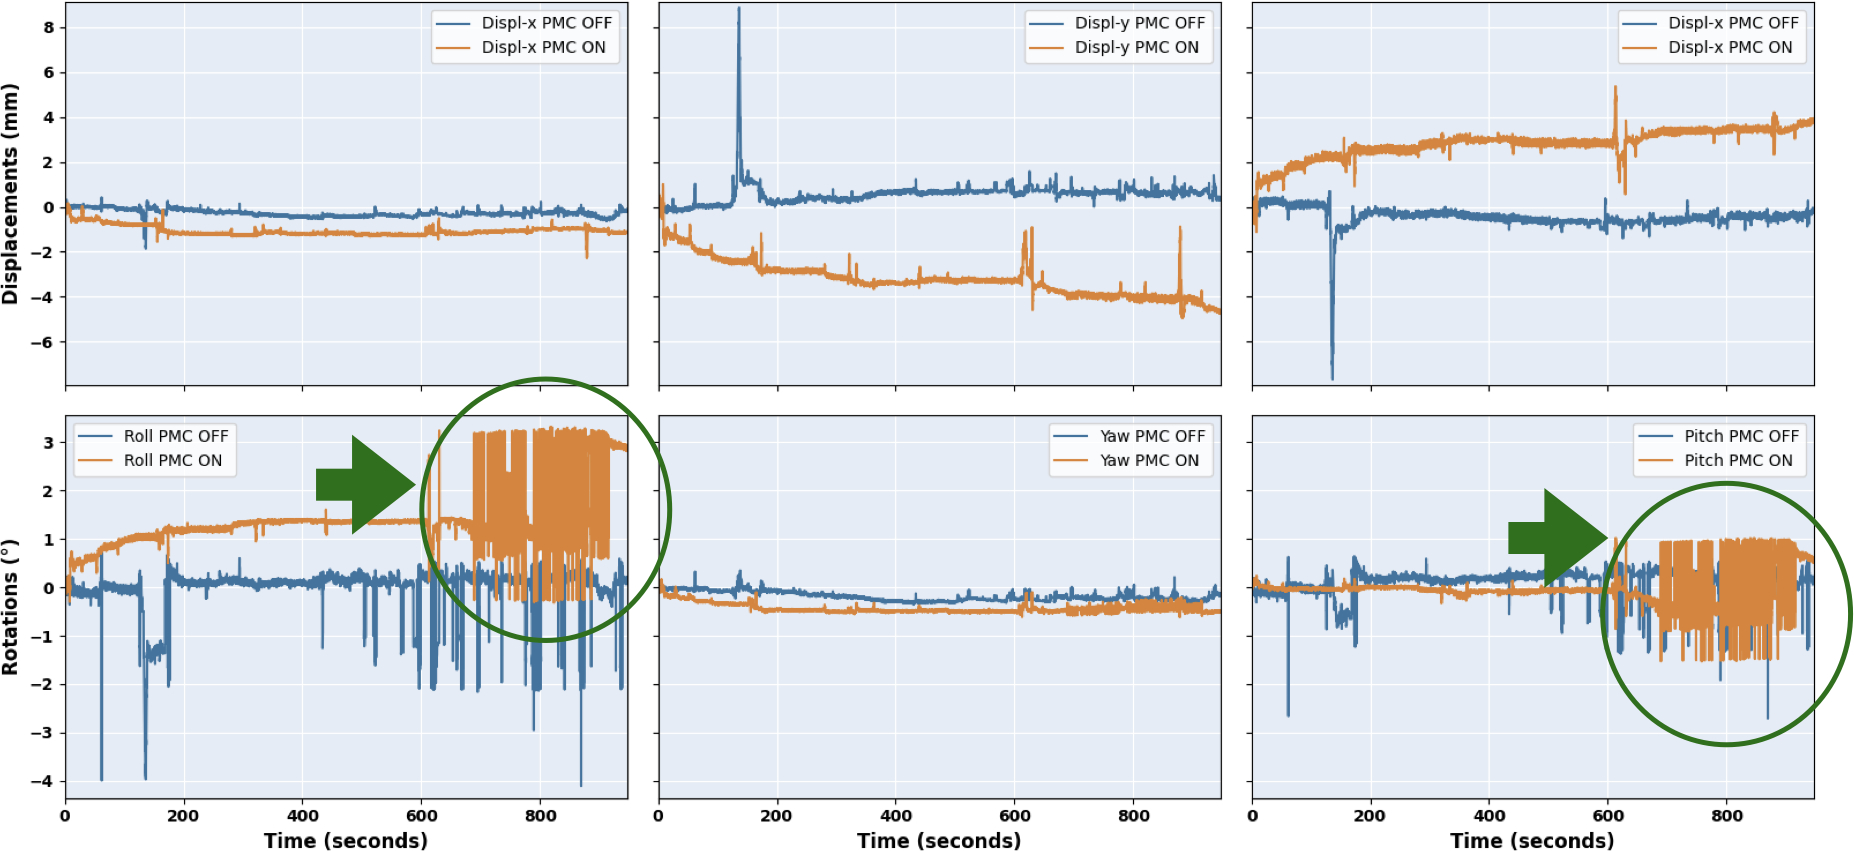
false pose data marked with a green circle.
3.1 |. Subjective Image Quality Assessment
For each of the 252 image volumes, the four raters assessed the image quality, looking specifically for the presence of motion artifacts. Intra-class coefficient (ICC, shown in Figure 3) portrayed that the agreement among the raters were between 0.68 (for T2∗ (05)) and 0.89 (for T 1). Considering all contrasts and resolutions together, PMC ON has shown a statistically significant improvement (5.5%) over PMC off. The total averaged score and standard deviation were 8.21 ± 0.36 for PMC OFF and 8.77 ± 0.24 for PMC ON, respectively. Details for each group of contrast are reported in Figure 6. The results are shown for each rater and each contrast including the different resolutions of T2*-w images. Moreover, the average scores across all raters are shown. Regarding the T1, T2 and PD-w images, the experts awarded a higher score to PMC ON in all cases. For these groups, the PMC ON scans increased in terms of image quality by 9.6, 9.8 and 9.2% respectively. The T2*-w images did not show statistically significant differences. However, it is to be noted that the ratings provided to the images without PMC were already very high (between 8 and 10), hence, the scope for improvement was small.
FIGURE 6. Results of the subjective assessment.
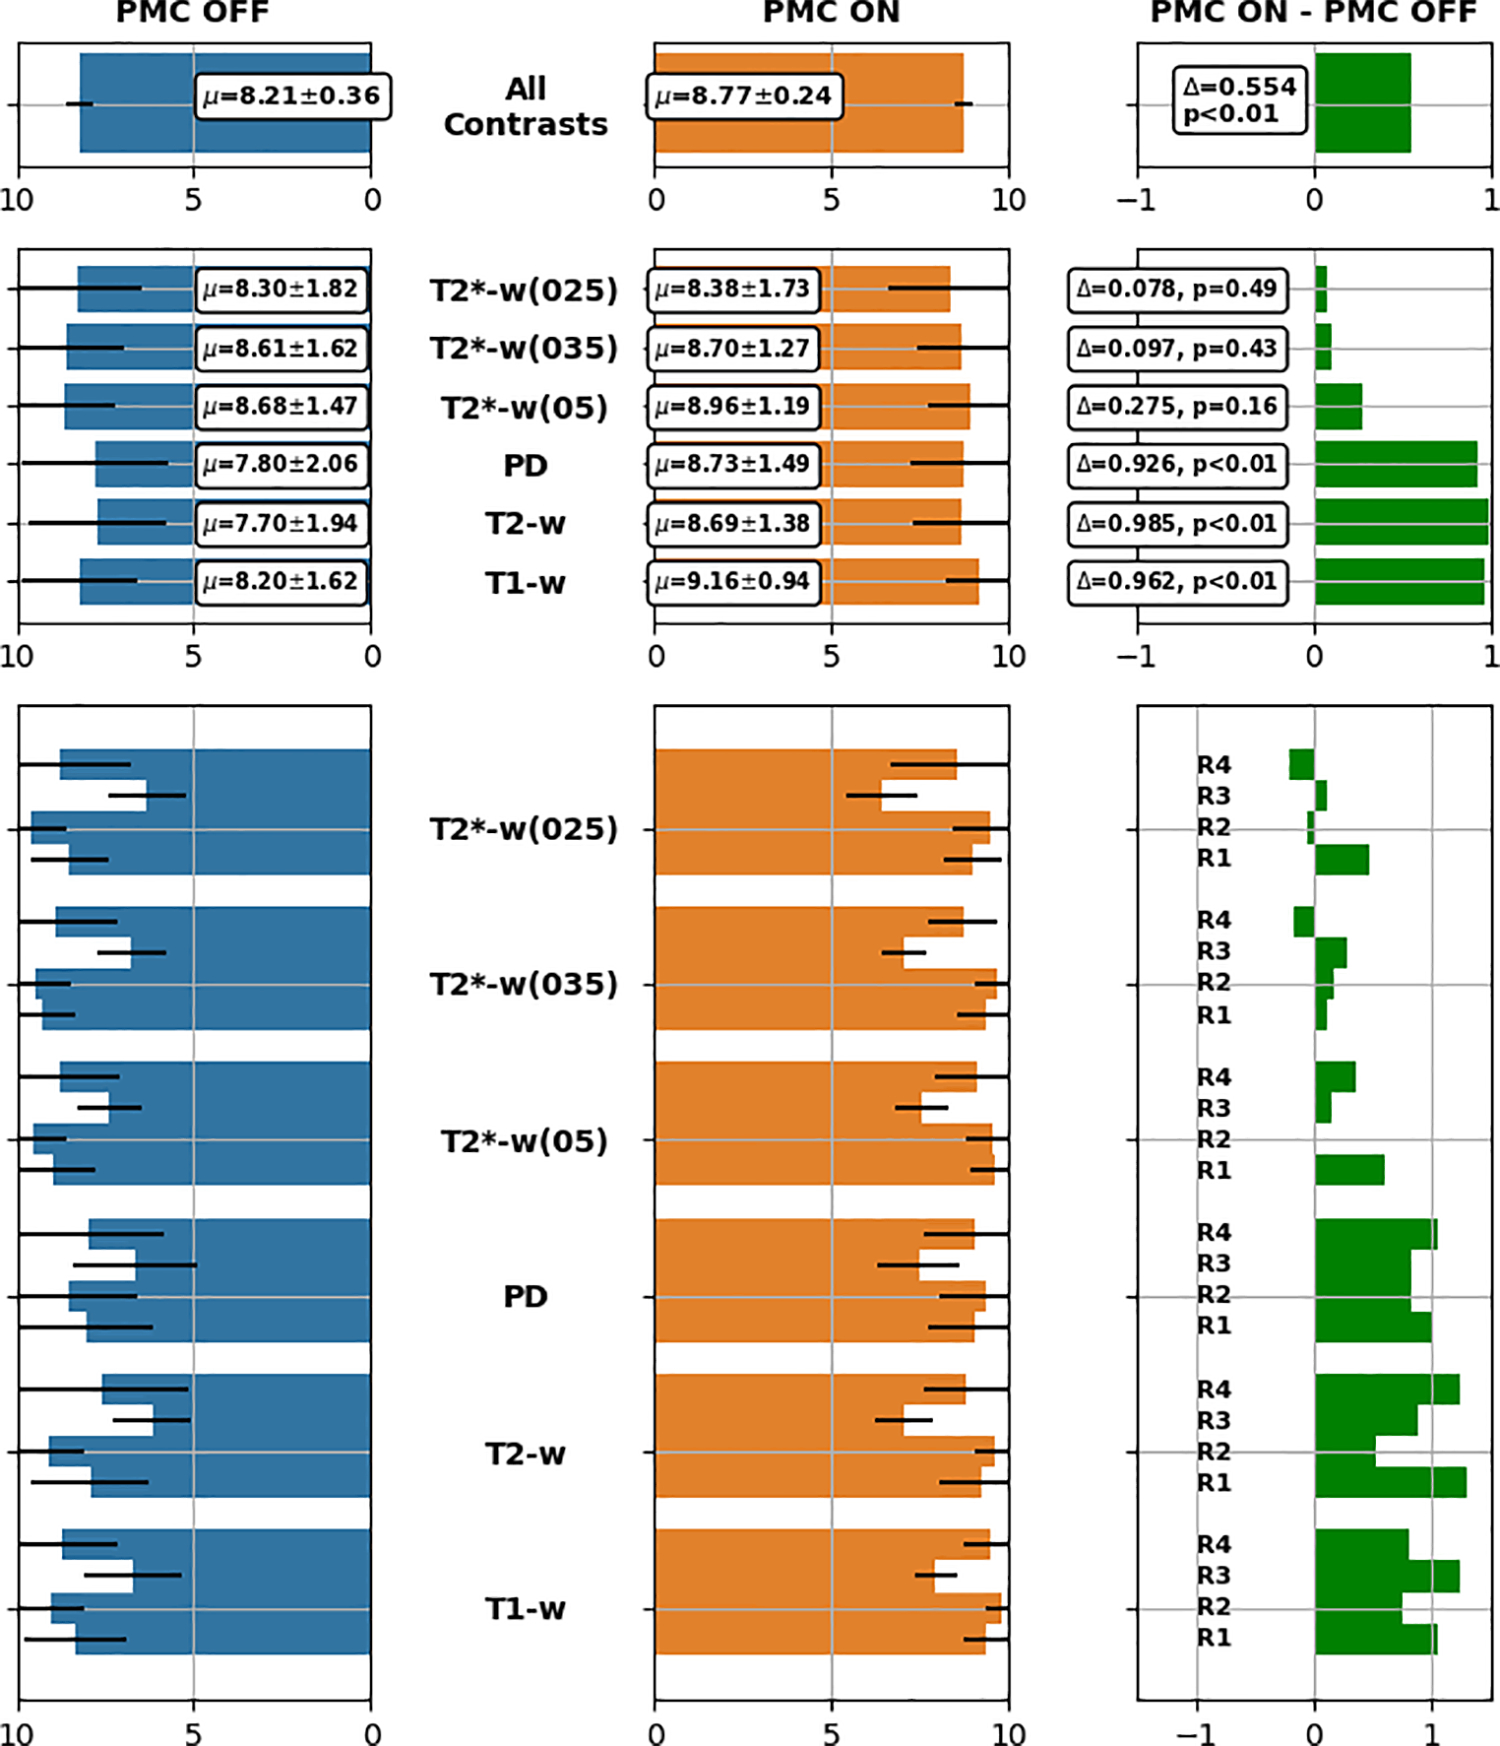
Bar plots containing average scores calculated for each group and for all groups together. R1, ..., R4 refer to Reader 1 to Reader 4.
3.2 |. Objective Image Quality Assessment
For the objective assessment, as described in Section 2.3, we utilized two metrics: the average edge strength (AES) and the gradient entropy; Results are shown in Figure 7.
FIGURE 7. Results of the objective assessment.
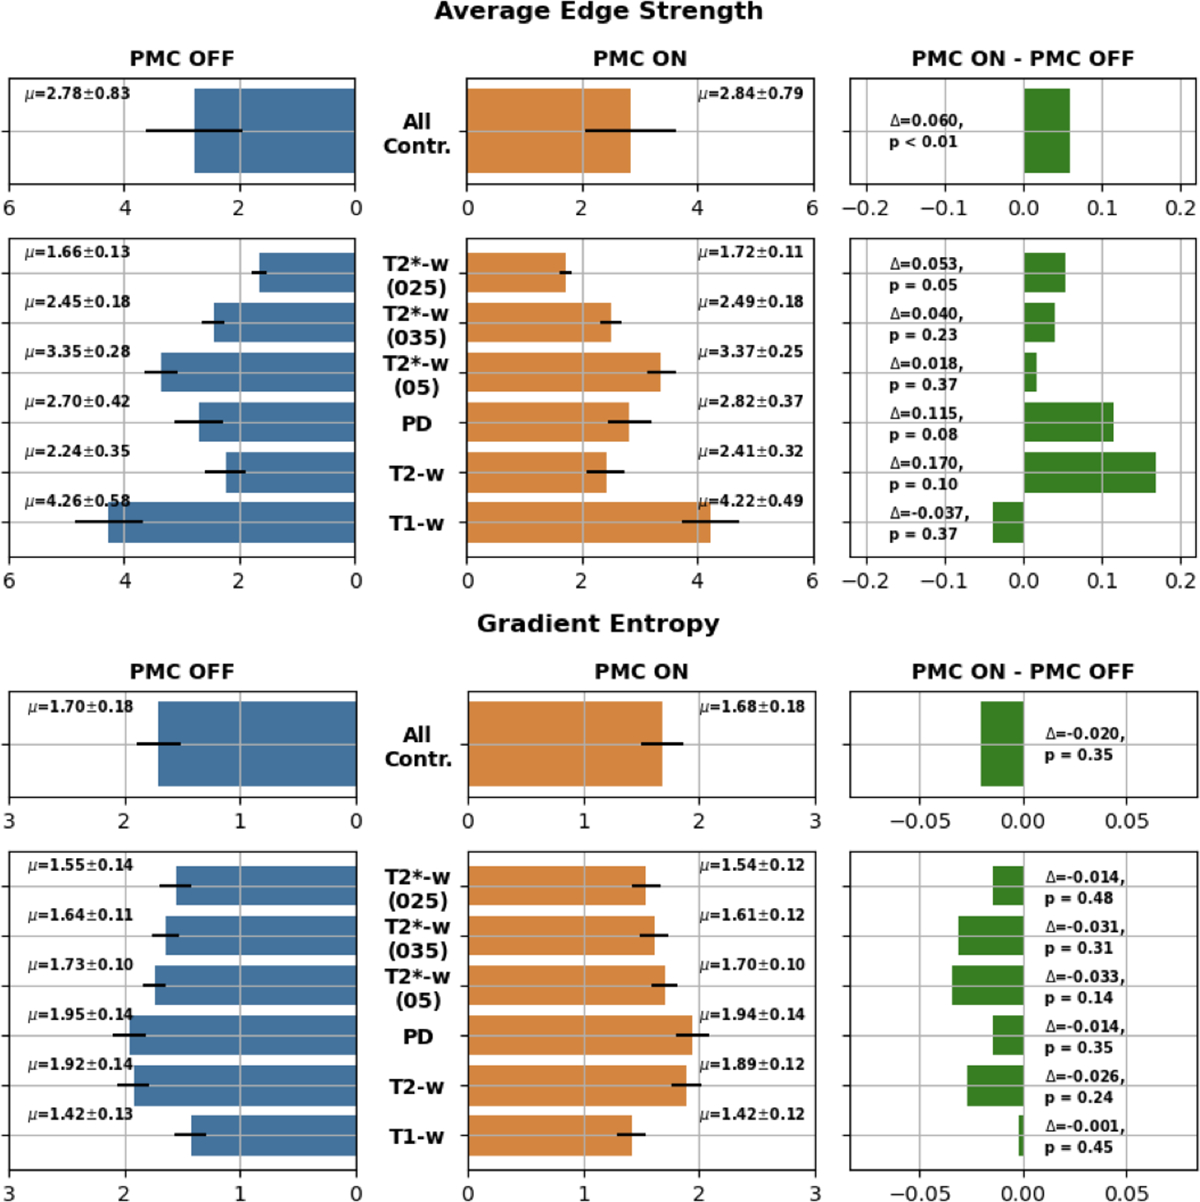
Bar plots containing average scores calculated for each group and for all groups together. Top: Average Edge Strength; Bottom: Gradient Entropy.
3.2.1 |. Average Edge Strength
The overall result of AES was statistically significant (6% better) in favor of PMC ON acquisitions. Considering each group separately, only one contrast, T2*(025)) has shown a significant statistical improvement with PMC ON of 5.3%. Although not statistically significant, all of the groups have shown improvements with PMC ON, with the only exception of the T1-w images, where AES was slightly higher for PMC OFF.
3.2.2 |. Gradient Entropy
Considering all the contrasts together and even separately, gradient entropy did not show any statistically significant difference between the two groups - with and without PMC. However, gradient entropy always provided positive results for acquisitions supported by PMC.
4 |. DISCUSSION
In this study, an extensive evaluation of PMC has been conducted for structural brain imaging at ultra-high field in a group of healthy subjects that were instructed to remain as motionless as possible for all scans. Systematic subjective and objective assessments have been performed to compare and quantify the differences in high resolution in vivo brain images of these healthy compliant subjects acquired with and without PMC.
It was observed in the subjective assessments that the images, whether acquired with or without PMC, received scores mostly between 8 and 10, as reported in Figure 6. Therefore, all images had high to very high image quality independent of the correction status. However, from the global subjective assessment, it was nonetheless evident that the use of PMC improved the image quality. Looking at the subjective evaluation, the positive effect of the use of PMC is statistically significant for three out of four contrasts (three out of six groups) and for the remaining one contrast (three groups of T2*-w images) there was still an improvement, which was, however, not statistically significant. Although all the experts involved in the evaluation process were experienced in MR image quality assessment and shared a common training background, the intra-class coefficient varied between 0.68 and 0.89. It is important to reiterate that the task was not only to find whether an image was corrupted or degraded by artifacts, but also to assess the level of degradation. This should be highlighted because it is completely different from what is commonly done in clinical routine, where scans are assessed within few seconds in order to decide if re-scanning is necessary or the image quality is sufficient to perform a clinical diagnosis.
Both objective metrics have shown that the PMC can enhance the image quality for five out of six groups (T2, PD, T2*(05), T2*(035) and T2*(025)). Although for T1-w images, AES is in favor of PMC OFF and gradient entropy has shown no difference (both not being statistically significant), which is in contradiction to the subjective assessment that showed statistically significant results in favor of PMC ON for this contrast. This generally raises the question of the range of applicability of such metrics for quality assessment of subtle motion artifacts [25]. The results agree with what has been shown in comparable studies. For instance, Mattern et al. [14] imaged four subjects with a similar sequence (a 3D gradient echo sequence for susceptibility weighted imaging, instead of the 2D sequence in our study). In this study, PMC acquisitions with a resolution of 0.33×0.33×1.25 mm3 showed a considerable reduction of motion artifacts in most cases and a significant improvement in the reproducibility of quantitative susceptibility values. Stucht et al. [1] conducted another comparable study, where four subjects were scanned with similar sequences. Also, in this study, the benefit of PMC was shown in case of the 0.25×0.25×2.0 mm3 gradient echo (T2*-w) images and the 0.44 mm3 isotropic T1-w images. However, these studies cannot be considered fully comparable in terms of the number of subjects scanned, and the number and type of sequences acquired per subject.
Although we tested all the sequences on a phantom to verify the impact of vibrations and observed that the gradients did not affect the motion patterns or image quality, we cannot prove that the same is valid for in vivo imaging. Experimental differences, such as the loading conditions of the patient table, may lead to differences in the mechanical properties and coupling of the setup. Furthermore, different mounting conditions may affect the performance of the optical tracking system. In general, we did not observe any anomalies in the tracking information to indicate possible PMC malfunctions or erroneous tracking, except in one acquisition (discussed in Sec. 3, and shown in Figure 5). As described in section 2, the OMTS was mounted using Velcro straps, Figure 1. We did not investigate if the Velcro can assure that the mechanical properties and orientation of the camera are stable over the course of a scan and between scans. The same concern exists with respect to the gradual degradation of the Velcro with repeated use. This could lead to different mounting conditions and consequently affect the performance of the optical tracking system. Furthermore, differences in contrast and signal-to-noise ratio could potentially affect the results obtained by the objective evaluation [26, 27]. It is noteworthy that in certain cases (shown in Figure 8), reduction in artifacts became obvious in the PMC-ON image only upon close inspection.
FIGURE 8. Comparison of PD-w images acquired for the same subject.
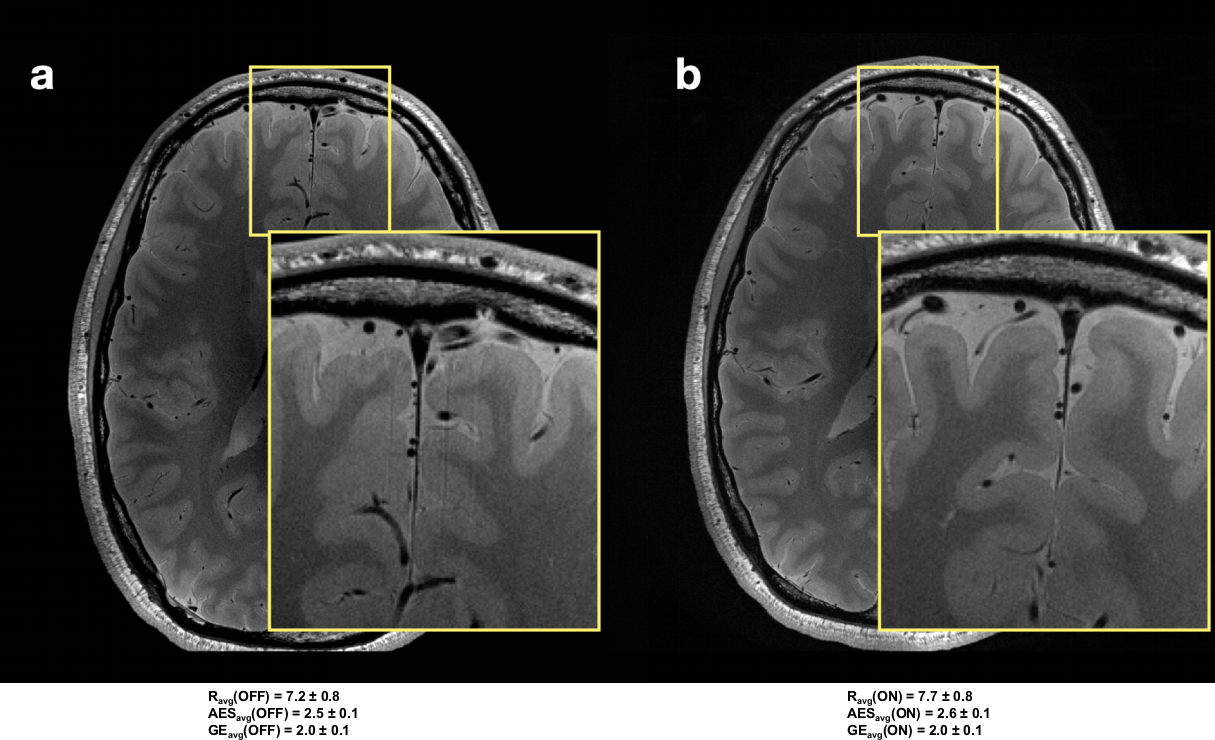
Left side (a) image acquired without the support of PMC. Right side (b), image acquired with PMC. For both images a zoomed-in area is showing details. The subjective average score (Ravg), and the average AES (AESavg) and average gradient entropy (GEavg) over all slices in these volumes are reported.
Based on our results, PMC using an OMTS can improve the image quality of already very good images of healthy compliant subjects without intentional motion during the scan.
5 |. CONCLUSION
This paper presents a large-scale study on PMC to systematically assess high-resolution MRIs at 7T in cooperative subjects. Most of the acquired images presented a high or very high image quality. Subjective assessment has shown improvement with PMC ON for every scenario, but only three of them were also statistically significant. Objective metrics have shown that the images acquired with PMC were better in terms of image quality for five out of six groups, for the final group the metrics did not agree on a clear winner and were not consistent with the subjective metric. Only the images with similar motion patterns for both PMC ON and OFF were considered in the analysis here. Hence, the improvements observed can be attributed to PMC. Based on our results, we conclude that prospective motion correction provides better image quality for high resolution images in the absence of intentional motion and it should be taken into consideration even when acquiring high-resolution scans at 7T of healthy compliant subjects.
Acknowledgments
This work was conducted within the context of the Initial Training Network program, HiMR, funded by the FP7 Marie Curie Actions of the European Commission (grant number FP7-PEOPLE-2012-ITN-316716), and supported by the NIH (grant number 1R01-DA021146), the DFG (grant number DFG-MA 9235/1–1), the European Structural and Investment Funds (project no. ZS/2016/08/80646) and the federal state of Saxony-Anhalt (grant number ‘I 88’). We would like to thank the staff of the Department of Oral and Maxillofacial Surgery, University Hospital Magdeburg A.ö.R., Christian Zahl, Indra Griesau and Christine Rohloff for creating individually custom made removable dental braces.
References
- [1].Stucht D, Danishad KA, Schulze P, Godenschweger F, Zaitsev M, Speck O. Highest Resolution In Vivo Human Brain MRI Using Prospective Motion Correction. PLOS ONE 2015. July;10(7):e0133921–. 10.1371/journal.pone.0133921. [DOI] [PMC free article] [PubMed] [Google Scholar]
- [2].Herbst M, Maclaren J, Lovell-Smith C, Sostheim R, Egger K, Harloff A, et al. Reproduction of Motion Artifacts for Performance Analysis of Prospective Motion Correction in MRI. Magnetic resonance in medicine : official journal of the Society of Magnetic Resonance in Medicine / Society of Magnetic Resonance in Medicine 2014. January;71(1):10.1002/mrm.24645 . 10.1002/mrm.24645http://www.ncbi.nlm.nih.gov/pmc/articles/PMC3674114/. http://www.ncbi.nlm.nih.gov/pmc/articles/PMC3674114/ . [DOI] [PMC free article] [PubMed] [Google Scholar]
- [3].Lee CC, Jack CR, Grimm RC, Rossman PJ, Felmlee JP, Ehman RL, et al. Real-time adaptive motion correction in functional MRI. Magnetic Resonance in Medicine 1996;36(3):436–444. 10.1002/mrm.1910360316. [DOI] [PubMed] [Google Scholar]
- [4].Maclaren J, Herbst M, Speck O, Zaitsev M. Prospective motion correction in brain imaging: A review. Magnetic Resonance in Medicine 2013;69(3):621–636. 10.1002/mrm.24314. [DOI] [PubMed] [Google Scholar]
- [5].Pannetier NA, Stavrinos T, Ng P, Herbst M, Zaitsev M, Young K, et al. Quantitative framework for prospective motion correction evaluation. Magnetic Resonance in Medicine 2016;75(2):810–816. 10.1002/mrm.25580. [DOI] [PMC free article] [PubMed] [Google Scholar]
- [6].Haacke EM, Patrick JL. Reducing motion artifacts in two-dimensional Fourier transform imaging. Magnetic Resonance Imaging 1986 2018/March/14;4(4):359–376. 10.1016/0730-725X(86)91046-5. [DOI] [PubMed] [Google Scholar]
- [7].Godenschweger F, Kägebein U, Stucht D, Yarach U, Sciarra A, Yakupov R, et al. Motion correction in MRI of the brain. Physics in Medicine & Biology 2016;61(5):R32. http://stacks.iop.org/0031-9155/61/i=5/a=R32. [DOI] [PMC free article] [PubMed] [Google Scholar]
- [8].Zaitsev M, Dold C, Sakas G, Hennig J, Speck O. Magnetic resonance imaging of freely moving objects: prospective real-time motion correction using an external optical motion tracking system. Neuroimage 2006;31(3):1038–1050. [DOI] [PubMed] [Google Scholar]
- [9].Maclaren J, Speck O, Stucht D, Schulze P, Hennig J, Zaitsev M. Navigator Accuracy Requirements for Prospective Motion Correction. Magnetic resonance in medicine: official journal of the Society of Magnetic Resonance in Medicine / Society of Magnetic Resonance in Medicine 2010. January;63(1):162–170. http://www.ncbi.nlm.nih.gov/pmc/articles/PMC2933924/. [DOI] [PMC free article] [PubMed] [Google Scholar]
- [10].Zaitsev M, Maclaren J, Herbst M. Motion Artefacts in MRI: a Complex Problem with Many Partial Solutions. Journal of magnetic resonance imaging: JMRI 2015. October;42(4):887–901. http://www.ncbi.nlm.nih.gov/pmc/articles/PMC4517972/. [DOI] [PMC free article] [PubMed] [Google Scholar]
- [11].Singh A, Zahneisen B, Keating B, Herbst M, Chang L, Zaitsev M, et al. Optical Tracking With Two Markers for Robust Prospective Motion Correction for Brain Imaging. Magma (New York, NY) 2015. December;28(6):523–534. http://www.ncbi.nlm.nih.gov/pmc/articles/PMC5259555/. [DOI] [PMC free article] [PubMed] [Google Scholar]
- [12].Eschelbach M, Aghaeifar A, Bause J, Handwerker J, Anders J, Engel EM, et al. Comparison of prospective head motion correction with NMR field probes and an optical tracking system. Magnetic Resonance in Medicine 2019;81(1):719–729. 10.1002/mrm.27343. [DOI] [PubMed] [Google Scholar]
- [13].Gretsch F, Mattern H, Gallichan D, Speck O. Fat navigators and Moiré phase tracking comparison for motion estimation and retrospective correction. Magnetic Resonance in Medicine 2020;83(1):83–93. 10.1002/mrm.27908. [DOI] [PMC free article] [PubMed] [Google Scholar]
- [14].Mattern H, Sciarra A, Lüsebrink F, Acosta-Cabronero J, Speck O. Prospective motion correction improves high-resolution quantitative susceptibility mapping at 7T. Magnetic Resonance in Medicine 2019;81(3):1605–1619. 10.1002/mrm.27509. [DOI] [PubMed] [Google Scholar]
- [15].Lüsebrink F, Sciarra A, Mattern H, Yakupov R, Speck O. T1 -weighted in vivo human whole brain MRI dataset with an ultrahigh isotropic resolution of 250 um. Scientific Data 2017. March;4:170032 EP –. 10.1038/sdata.2017.32. [DOI] [PMC free article] [PubMed] [Google Scholar]
- [16].Mattern H, Sciarra A, Godenschweger F, Stucht D, Lüsebrink F, Rose G, et al. Prospective motion correction enables highest resolution time-of-flight angiography at 7T. Magnetic Resonance in Medicine 2017;p. n/a–n/a. 10.1002/mrm.27033. [DOI] [PMC free article] [PubMed] [Google Scholar]
- [17].Maclaren J, Armstrong BSR, Barrows RT, Danishad KA, Ernst T, Foster CL, et al. Measurement and Correction of Microscopic Head Motion during Magnetic Resonance Imaging of the Brain. PLoS ONE 2012;7(11):e48088. http://www.ncbi.nlm.nih.gov/pmc/articles/PMC3492340/. [DOI] [PMC free article] [PubMed] [Google Scholar]
- [18].Mann HB, Whitney DR. On a test of whether one of two random variables is stochastically larger than the other. The annals of mathematical statistics 1947;p. 50–60. [Google Scholar]
- [19].Bartko JJ. The intraclass correlation coefficient as a measure of reliability. Psychological reports 1966;19(1):3–11. [DOI] [PubMed] [Google Scholar]
- [20].Shrout PE, Fleiss JL. Intraclass correlations: uses in assessing rater reliability. Psychological bulletin 1979;86(2):420. [DOI] [PubMed] [Google Scholar]
- [21].Vallat R Pingouin: statistics in Python. The Journal of Open Source Software 2018. November;3(31):1026. [Google Scholar]
- [22].Esteban O, Birman D, Schaer M, Koyejo OO, Poldrack RA, Gorgolewski KJ. MRIQC: Advancing the automatic prediction of image quality in MRI from unseen sites. PLOS ONE 2017. September;12(9):1–21. 10.1371/journal.pone.0184661. [DOI] [PMC free article] [PubMed] [Google Scholar]
- [23].McGee KP, Manduca A, Felmlee JP, Riederer SJ, Ehman RL. Image metric-based correction (Autocorrection) of motion effects: Analysis of image metrics. Journal of Magnetic Resonance Imaging 2000;11(2):174–181. . [DOI] [PubMed] [Google Scholar]
- [24].Woodard JP, Carley-Spencer MP. No-Reference image quality metrics for structural MRI. Neuroinformatics 2006. September;4(3):243–262. 10.1385/NI:4:3:243. [DOI] [PubMed] [Google Scholar]
- [25].Bazin PL,Nijsse HE, van der Zwaag W, Gallichan D, Alkemade A, Vos FM, et al. Sharpness in motion corrected quantitative imaging at 7T. NeuroImage 2020; 222:117227. https://www.sciencedirect.com/science/article/pii/S1053811920307138. [DOI] [PubMed] [Google Scholar]
- [26].Chow LS, Paramesran R. Review of medical image quality assessment. Biomedical signal processing and control 2016;27:145–154. [Google Scholar]
- [27].Krbcova Z, Kukal J. Relationship between entropy and SNR changes in image enhancement. EURASIP Journal on Image and Video Processing 2017;2017(1):83. [Google Scholar]


