

Summary
Mitochondria are key organelles for cellular energetics, metabolism, signaling, and quality control and have been linked to various diseases. Different views exist on the composition of the human mitochondrial proteome. We classified >8,000 proteins in mitochondrial preparations of human cells and defined a mitochondrial high-confidence proteome of >1,100 proteins (MitoCoP). We identified interactors of translocases, respiratory chain, and ATP synthase assembly factors. The abundance of MitoCoP proteins covers six orders of magnitude and amounts to 7% of the cellular proteome with the chaperones HSP60-HSP10 being the most abundant mitochondrial proteins. MitoCoP dynamics spans three orders of magnitudes, with half-lives from hours to months, and suggests a rapid regulation of biosynthesis and assembly processes. 460 MitoCoP genes are linked to human diseases with a strong prevalence for the central nervous system and metabolism. MitoCoP will provide a high-confidence resource for placing dynamics, functions, and dysfunctions of mitochondria into the cellular context.
Keywords: Mitochondria, human cells, high-confidence proteome, smORFs, copy numbers, half-lives, disease, complexome, protein translocation, respiratory chain
Graphical abstract
Highlights
-
•
Human mitochondrial high-confidence proteome with >1,100 proteins (MitoCoP)
-
•
Mitochondria-specific protein copy numbers and half-lives
-
•
Interactors of protein translocases and oxidative phosphorylation assembly factors
-
•
>40% of mitochondrial proteome linked to human diseases
Mitochondria are crucial for cellular energy metabolism and human health. Morgenstern et al. present a high-confidence protein compendium of human mitochondria including mitochondria-specific protein copy numbers and half-lives. They identify interactors of key mitochondrial protein machineries and link >40% of the mitochondrial proteome to human diseases.
Introduction
Mitochondria are highly dynamic and ubiquitous organelles in eukaryotic cells that are involved in a multitude of cellular functions, including oxidative phosphorylation, metabolic pathways for amino acids, lipids, Fe-S clusters and heme biosynthesis, signaling processes, and apoptosis (van der Bliek et al., 2017; Labbé et al., 2014; Pfanner et al., 2019). The mitochondrial proteome is of dual genetic origin. In human cells, thirteen proteins are encoded by the mitochondrial genome and synthesized on mitochondrial ribosomes (Formosa and Ryan, 2018; Gustafsson et al., 2016). The large majority of mitochondrial proteins are nuclear encoded, synthesized on cytosolic ribosomes, and subsequently imported into mitochondria via a complex system of import routes and translocation mechanisms (Chacinska et al., 2009; Endo et al., 2011; Neupert and Herrmann, 2007; Walther and Rapaport, 2009; Wiedemann and Pfanner, 2017). To fulfill their vast array of functions, mitochondria take part in a highly interconnected network, and mitochondrial malfunction has been connected to a wide range of human disease phenotypes (Frazier et al., 2019; Suomalainen and Battersby, 2018; Vafai and Mootha, 2012). To specifically link diseases to mitochondrial proteins and to characterize them on a molecular level, it is crucial to establish a high-confidence inventory of the human mitochondrial proteome.
Early proteomics studies on yeast (Reinders et al., 2006; Sickmann et al., 2003), mouse (Mootha et al., 2003), and human mitochondria (Gaucher et al., 2004; Taylor et al., 2003) were based on the analysis of a purified mitochondrial fraction. In later subtractive proteomics experiments, the mitochondrial enrichment of proteins was determined quantitatively by comparing pure mitochondria to a preparation of reduced purity (Morgenstern et al., 2017; Pagliarini et al., 2008; Williams et al., 2018). Another spatial proteomics method, in situ proximity labeling, was used to define mitochondrial subproteomes in human cells (Hung et al., 2014, 2017; Rhee et al., 2013).
Studies directly addressing the human mitochondrial proteome have yielded only a limited number of proteins, including ∼680 proteins of purified mitochondria (Gaucher et al., 2004; Taylor et al., 2003) and ∼690 proteins via in situ proximity labeling studies (Hung et al., 2014, 2017; Rhee et al., 2013). Spatial proteomics studies of human cells assigned ∼660 mitochondrial proteins (Itzhak et al., 2016; Jean Beltran et al., 2016). In contrast, widely used data repositories taken together—including Gene Ontology (GO) assignments “Mitochondrion,” the Integrated Mitochondrial Protein Index (IMPI) based on MitoMiner (Smith and Robinson, 2019), MitoCarta2.0 (Calvo et al., 2016), and the Human Proteome Atlas (HPA; Thul et al., 2017)—list 2,439 human mitochondrial proteins (Figure S1A), yet the evidence for mitochondrial assignments is highly variable. Whereas for 25% of the proteins a mitochondrial localization was only inferred from predictions, for 1,819 proteins experimental evidence of a mitochondrial localization was indicated, ranging from detailed single-protein studies to high-throughput proteomics, imaging, and in situ proximity labeling studies and based on a relationship to mitochondrial proteins analyzed in other organisms. In addition, the increasing number of proteins that are multi-localizing to several cellular compartments (Kalderon and Pines, 2014; Morgenstern et al., 2017; Thul et al., 2017) considerably limit the approaches for quantification of the absolute abundance and dynamics of mitochondrial proteins since whole-cell assays determine both mitochondrial and non-mitochondrial forms of a protein.
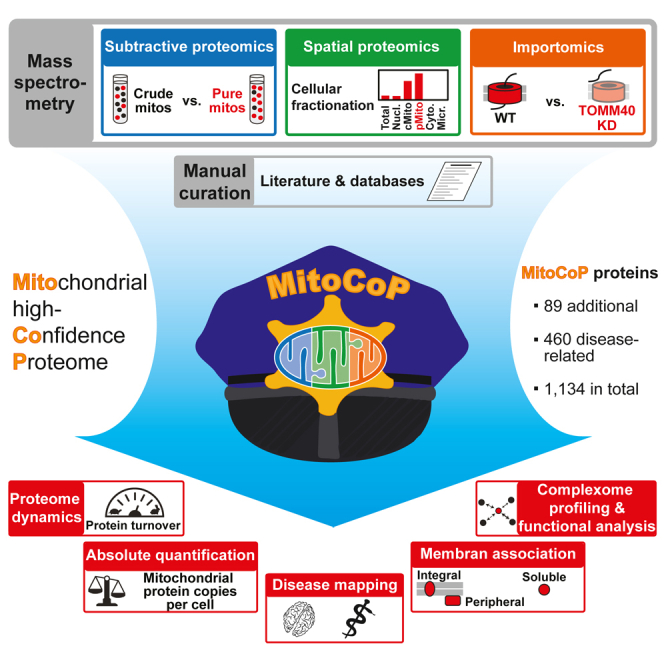
To date, a high-confidence human mitochondrial proteome and its dynamics have not been defined. To overcome the limitations of individual approaches, we combined subtractive proteomics, spatial proteomics, mitochondria-specific importomics, and literature/database curation by stringent criteria. We defined a human mitochondrial high-confidence proteome (MitoCoP) of 1,134 protein-coding genes, including 91 proteins previously not localized to mitochondria experimentally. Human mitochondria-specific absolute quantifications, membrane association, biosynthesis, and turnover rates provide a comprehensive resource for characterizing mitochondrial biogenesis, functions, and dynamics. So far unknown interactors of protein translocases and oxidative phosphorylation assembly factors were identified. Finally, a systematic mapping of disease-related observations of 460 MitoCoP genes provides a rich framework for defining the role of mitochondria in the pathogenesis of human diseases.
Results
Strategy for high-confidence mapping of the human mitochondrial proteome
To establish a high-definition map of the human mitochondrial proteome, we combined the complementary strengths of subtractive proteomics of mitochondrial preparations of different purity, subcellular (spatial) protein profiling, and mitochondrial importomics in a multidimensional classification approach (Figure 1A), using subcellular fractions of HEK293T, HeLa, Huh7, and U2OS human cell lines (Figures S1B and S1C). All fractions were subjected to extensive fractionation to maximize proteome coverage in quantitative mass spectrometry (MS) studies. The datasets were analyzed by stringent filtering and complemented by a detailed literature/database curation as well as single-protein studies, leading to the definition of the high-confidence mitochondrial proteome MitoCoP (Figure 1A; Table S1).
Figure 1.

Multifaceted strategy for multidimensional mapping and functional characterization of a high-confidence human mitochondrial proteome
(A) Overview of the strategy. Mito., mitochondria; KD, shRNA-mediated knockdown.
(B) Ratio-intensity plot of proteins quantified in subtractive proteomics experiments of crude and gradient-purified mitochondria (n ≥ 3/4 biological replicates). Numbers of proteins indicated include isoforms. cM/pM, crude/pure mitochondria.
(C) Same as in (B) highlighting selected sets of proteins. Fe-S, iron-sulfur; Perox., peroxisomal; ER, endoplasmic reticulum.
(D) Two-dimensional map of subcellular fractionation data generated as shown in Figure S1B. Cluster reflect the distribution of mitochondrial and non-mitochondrial test sets (see Figure S2B). dim, dimension.
(E) tSNE plots highlighting selected sets of proteins. dim, dimension.
See also Figures S1 and S2 and Table S2.
This multifaceted human mitochondria-centered analysis was expanded to a functional classification of MitoCoP and a mitochondria-specific absolute quantification of copy numbers, biosynthesis, and turnover rates (Figure 1A). We established a comprehensive subunit-resolved abundance and turnover map of protein machineries and central biosynthesis pathways of human mitochondria. Functional protein networks of so far not described mitochondrial constituents were defined by quantitative affinity purification mass spectrometry (q-AP-MS) and biochemical interaction analysis. Mapping of disease-related observations to 460 MitoCoP genes provides a systematic source for the major impact of mitochondria for human diseases (Table S1).
Mitochondrial mapping by subtractive and spatial proteomics
For subtractive proteomics, we compared crude and pure mitochondrial fractions from HEK293T cells by quantitative MS in combination with four different proteolytic sample processing pipelines to maximize sequence coverage (Figures S1D–S1F; Table S2). Mitochondrial proteins were clearly enriched in pure mitochondrial fractions whereas proteins of other subcellular origin were depleted (Figure S1G). Ratio-intensity plots of 7,448 proteins were classified (classes 1–9) by a statistical approach outlined in STAR Methods (Figure 1B; Table S2). For a first assessment of the separation of mitochondrial and non-mitochondrial proteins, we used GO annotations for Cellular Components (GO-CC) (Ashburner et al., 2000; Chibucos et al., 2017). Mitochondrially assigned proteins of all four submitochondrial compartments were highly overrepresented in classes 1 and 2, whereas other cellular compartments were overrepresented in classes 4–9 (Figure S1H). Similarly, we established mitochondrial and non-mitochondrial assessment sets based on experiment-related entries in MitoMiner (Smith and Robinson, 2009, 2019), revealing a strong preference of the mitochondrial test set for classes 1 and 2 (Figures S1I–S1K).
For a direct evaluation of the quality of the subtractive proteomics approach, we analyzed the distribution of established proteins with defined localization, including the preprotein translocase of the outer membrane (TOM), the sorting and assembly machinery (SAM/TOB), the translocases of the inner membrane (TIM23, TIM22), the mitochondrial contact site and cristae organizing system (MICOS), and oxidative phosphorylation (OXPHOS) complexes (Figure 1C; Figure S1L). Virtually all subunits were distributed to the mitochondrial classes 1 and 2. The cochaperone TOMM34 is an exception, as it shuttles between a predominantly cytosolic location (class 5) and an association with mitochondria (Figure 1C; Faou and Hoogenraad, 2012). Further navigation through our dataset demonstrated precise class separation of proteins involved in crucial mitochondria-related cellular processes, like cytosolic iron-sulfur Fe-S cluster assembly (CIA) proteins (CIAO2A and B, CIAO1 aka CIA1, NUBP2 aka CFD1; NBP1 aka NBP35), versus those in mitochondria (Figure 1C; Figure S1L). Dually localized mitochondrial proteins were observed in classes 1 and 2 (largely residing in mitochondria) or other classes (only small amounts located in mitochondria, e.g., TOMM34) (Figure 1C; Figure S1L).
To study the mitochondrial proteome in the cellular context, we designed a mitochondria-centered spatial proteomics approach based on the comprehensive analysis of subcellular fractions enriched in different organelles/compartments (Figures S1B and S1C). By label-free quantitative MS, we identified a total of 9,048 proteins and 7,505 proteins in pure mitochondria fractions (Figure S2A; Table S2). Computational data analysis allowed the assignment of 8,474 proteins to two clusters (Figure 1D), with mitochondria-linked proteins preferentially distributed to cluster 1 and non-mitochondrial proteins to cluster 2 (Figures S2B–S2D; Tables S2 and S3). Further spatial clustering showed that different cellular compartments were preferentially distributed to different regions in cluster 2 (Figures S2E and S2F; Table S2).
A direct analysis with mitochondrial proteins of firmly established localization revealed a high precision in the assignment of proteins that are exclusively located in mitochondria to cluster 1 (Figure 1E; and Figure S2G; Table S2). The distribution of proteins involved in central mitochondria-related cellular processes accurately occurred to clusters 1 or 2 according to their major cellular location. Thus, the spatial proteomics approach reliably discriminates between proteins that predominantly localize to mitochondria (cluster 1) and proteins of other cellular compartments (cluster 2).
Mitochondria-specific importomics
More than 90% of mitochondrial proteins are imported via the main entry gate TOM (Chacinska et al., 2009; Neupert and Herrmann, 2007; Pfanner et al., 2019), providing a selective means to distinguish authentic mitochondrial proteins from proteins of other cell organelles/compartments by a mitochondrial importomics approach (Peikert et al., 2017). We performed a doxycycline (Dox)-induced short hairpin RNA (shRNA)-mediated knockdown of the central pore-forming subunit TOMM40 in HeLa cells (Kozjak-Pavlovic et al., 2007). The cellular steady-state levels of TOMM40 and further selected mitochondrial proteins were considerably reduced (Figure 2A), which is in line with the efficient proteasomal degradation of non-imported mitochondrial precursor proteins (Boos et al., 2019; Mårtensson et al., 2019; Peikert et al., 2017; Weidberg and Amon, 2018; Wrobel et al., 2015). Mitochondria were purified from Dox-induced and mock-treated tomm40-shRNA cells and analyzed by MS (Figure 2B; Figures S3A–S3C; Table S3). We grouped 6,417 proteins into four classes (Figure 2C; Figures S3D and S3E). Mitochondrial proteins preferentially distributed to class 1 and in part to classes 2 and 3, whereas most non-mitochondrial test proteins were found in class 4 (Figures S3F and S3G; Tables S2 and S3). Based on GO-CC assignments, matrix, inner membrane, intermembrane space, and mitochondrial proteins with predicted presequences were predominantly found in class 1 (Figures 2D and 2E; Figures S3H and S3I). Notably, reduced protein levels observed in Dox-induced cells were not affected by differences in protein half-lives under the applied experimental conditions (Figure S3J).
Figure 2.

Charting human mitochondrial proteins by importomics
(A) Steady-state levels of mitochondrial proteins in whole cell lysates of doxycycline (Dox)-induced (+) and mock-treated (−) tomm40-shRNA cells. GAPDH, loading control; ∗, non-specific band.
(B) Outline of the importomics approach. pM, pure mitochondria; KD, shRNA-mediated knockdown.
(C) Volcano plot of proteins quantified by importomics following shRNA-mediated knockdown of tomm40 (n ≥ 2/4 biological replicates). Classes were defined based on the distribution of mitochondrial and non-mitochondrial test sets (see Figures S3D–S3G). Numbers of proteins indicated include isoforms. Horizontal lines mark p values (two-sided Student's t test) of 0.05 (bottom) and 0.0081 (top; Benjamini-Hochberg-corrected); vertical lines mark tomm40KD/mock ratios of 0.53 (left) and 0.87 (right).
(D–F) Same as in (C) highlighting proteins of distinct submitochondrial localizations (D), of different mitochondrial protein complexes (E), and of selected functional categories (F). OM/IM, outer/inner mitochondrial membrane; IMS, intermembrane space; AA, aminoacyl.
For outer membrane proteins we observed a mixed pattern. All known β-barrel proteins, SAMM50 and VDAC1-3 in addition to TOMM40, were members of class 1 (Figures 2D and 2E) in agreement with their import via the TOMM40 channel (Paschen et al., 2003; Wiedemann et al., 2003). Most subunits associated with TOMM40 (TOMM proteins) or SAMM50 (metaxins) were also reduced in abundance, likely caused by the destabilization of TOM and SAM complexes following depletion of the core components TOMM40 and SAMM50 (Figure 2E). In contrast, a majority of outer membrane proteins, including α-helical membrane proteins like mitofusin (MFN1) and carnitine palmitoyltransferase 1A (CPT1A), were distributed to class 4 (Figure 2D), consistent with a TOMM40- and SAMM50-independent import of these proteins (Otera et al., 2007; Ross et al., 2009; Setoguchi et al., 2006). The cochaperone TOMM34 was also found in class 4 due to its mainly cytosolic location (Figure 2E).
The abundance of TOMM70 was only slightly reduced (class 3) (Figure 2E) in agreement with its loose association with the TOM complex (Araiso et al., 2019; Tucker and Park, 2019). TOMM70 functions as receptor for precursor proteins with internal targeting signals, particularly for hydrophobic metabolite carriers of the inner membrane (Backes et al., 2018; Young et al., 2003). Upon lack of TOMM70, the receptors TOMM20 and TOMM22 can at least partially compensate for its function, whereas the unique function of TOMM40 as import channel cannot be substituted for by other components (Araiso et al., 2019; Shiota et al., 2015; Tucker and Park, 2019). To test if our importomics approach reflects these functional differences of TOMM40 and TOMM70, we analyzed the effect of shRNA-mediated knockdown of tomm70 (Figure S3K; Table S3; Kozjak-Pavlovic et al., 2007). Indeed, the abundance of some hydrophobic carrier proteins was decreased, whereas the majority of mitochondrial proteins were largely unaffected.
We conclude that importomics is a powerful and specific approach for identifying proteins imported via TOMM40, i.e., the large number of proteins of internal mitochondrial compartments and β-barrel proteins of the outer membrane. This is also demonstrated by the clear assignment and separation of Fe-S cluster biogenesis proteins, fatty acid β-oxidation enzymes, and aminoacyl-tRNA-synthetases, as well as of mitochondrial ribosomal proteins and dually localized proteins in tomm40-knockdown importomics (Figure 2F; Figure S3L).
Establishing the human mitochondrial high-confidence proteome “MitoCoP”
To define a human mitochondrial proteome, we combined and cross-analyzed the results from subtractive and spatial proteomics, importomics, and literature/database curation (Figure 1A) and applied filtering steps for high stringency in protein selection, which led to a proteome of 1,274 mitochondrial and mitochondria-associated proteins including isoforms (detailed in STAR Methods and Table S1). This high-confidence proteome corresponds to 1,134 protein-coding genes (“unique proteins”) summarized in Table S1. To corroborate MitoCoP, we performed an additional multiple cell line subtractive proteomics experiment using Huh7 (human liver cells) and U2OS cells (human osteosarcoma cells) in addition to HEK293T and HeLa cells (Figure S3M). For data evaluation, we compared the results with the extensive subtractive dataset from HEK293T cells (Figures S1D–S1F; Table S2). Multiple cell line data and subtractive reference data were subjected to filtering and clustering analysis to assign mitochondrial proteins at high confidence as outlined in STAR Methods. For each cell line, 97%–99% of all clustered proteins were MitoCoP proteins, which also amount to 97%–99% of MitoCoP proteins in the subtractive reference dataset (Figure S3N). 97% of these MitoCoP proteins and four additional putative mitochondrial proteins were found in at least three out of four cell lines (Figure S3O; Table S2). Thus, our multiple cell line data confirm the validity of the human MitoCoP. Comparing MitoCoP with the major experimental evidence-linked repositories revealed that MitoCarta2.0 and IMPI (version Q2 2018) covered 77%–87%, whereas others covered only 49%–60% of unique MitoCoP proteins (Figure 3A; Table S1).
Figure 3.

The human mitochondrial high-confidence proteome “MitoCoP”
(A) Number and coverage of protein-coding genes present in MitoCoP versus major mitochondrial protein repositories/datasets based on entries with experimental evidence for mitochondrial localization. APEX, in situ proximity labeling studies of submitochondrial proteomes (Hung et al., 2014, 2017; Rhee et al., 2013); GO: Mito, GO-CC term “mitochondrion;” IMPI, integrated mitochondrial protein index; HPA, human protein atlas (Thul et al., 2017).
(B) Ratio-intensity plots highlighting MitoCoP identified/validated proteins in the subtractive proteomics dataset.
(C) Subcellular fractions of HEK293T cells were analyzed by western blotting using antibodies directed against the indicated marker (black) and MitoCoP identified/validated proteins (green). CI, CIII, and CIV, respiratory complexes I, III, and IV; Mito, mitochondrial fraction; S100, cytosolic fraction; P100, microsomal fraction.
(D) HEK293T cells were transfected with vectors carrying GFP-tagged proteins and MitoTracker Red was added to visualize the mitochondrial network. Live cell images of the GFP signal (green) were recorded with the mitochondrial signal (red) and merged. Scale bar, 10 μm.
(E) In organello import of radiolabeled precursor proteins into HEK293T mitochondria in the presence or absence of a membrane potential (Δψ), followed by proteinase K (Prot. K) treatment. In case of NOCT, the + Prot. K gel lanes were exposed ∼1.5-times longer than the other gel lanes. p, precursor protein; m, mature protein. Lysate, in vitro synthesized radiolabeled precursor protein.
(F) Molecular mass distribution of MitoCoP proteins, the remaining cellular proteome (other; excluding MitoCoP proteins), and MitoCoP identified/validated proteins.
(G) Membrane association of MitoCoP proteins (see also Figures S4D–S4F).
The mitochondrial localization of proteins labeled in green has been confirmed experimentally in this study by biochemical assays, fluorescence microscopy, and/or q-AP-MS experiments (Figure 6).
Taking all repositories together, MitoCoP contains 49 proteins that have not been linked to mitochondria before—not even by prediction—and 42 additional proteins, for which an experimental evidence for the mitochondrial localization has been missing (Figure 3B; Figure S4A; Table S1). To independently validate their mitochondrial localization, we selected a number of MitoCoP identified/validated proteins for single protein analysis: immunodecoration of cellular fractions by specific antibodies (Figure 3C; Figure S4A); fluorescence imaging of GFP/FLAG-tagged MitoCoP proteins (Figure 3D; Figure S4B); and in vitro import of radiolabeled MitoCoP precursors into isolated mitochondria (Figure 3E; Figure S4C). All assays demonstrated a mitochondrial localization of the MitoCoP proteins studied. In the in vitro import assays, the MitoCoP proteins DHRS4, NOCT, and OXLD1 were proteolytically processed in a membrane potential (Δψ)-dependent manner and transported to a protease-protected internal mitochondrial compartment like the model preprotein Su9-DHFR (Figure 3E). As described below, the mitochondrial localization of further MitoCoP identified/validated proteins was validated by interaction analysis. In addition, mitochondrial localizations were reported for ACOT13 (Bekeova et al., 2019), NOCT (Onder et al., 2019), FAM173A (Małecki et al., 2019), LYRM9 (Dibley et al., 2020), MIGA2 (Freyre et al., 2019), NSUN2 (Van Haute et al., 2019), TMEM242 (Carroll et al., 2021), and the small open reading frames (smORF)-encoded proteins SMIM26, SLC35A4, and PIGBOS1 (Chu et al., 2019; Zhang et al., 2020), fully supporting our analysis.
A comparison of the molecular masses of MitoCoP identified/validated proteins with all MitoCoP proteins and cellular proteins revealed an enrichment of smaller proteins in MitoCoP identified/validated (Figure 3F; Table S1). We systematically mapped the membrane association and integration of MitoCoP proteins by sonication and treatment at alkaline pH, respectively (Figures S4D–S4G; Table S3). Most MitoCoP identified/validated proteins were found to be membrane associated or integral membrane proteins (Figure 3G). The analysis of MitoCoP identified/validated proteins thus reveals that particularly smaller membrane proteins escaped previous experimental detection.
Placing MitoCoP in a quantitative and functional context
To assess the absolute abundance of MitoCoP proteins, we determined the copy numbers of 8,436 proteins per cell based on the total protein approach (Figure S5A; Tables S1 and S4; Wiśniewski et al., 2012). However, for mitochondrial proteins with multiple localizations, the copy numbers are not limited to their mitochondrial pool but reflect the protein abundance in the entire cell. To define mito-copies per cell, we combined the total protein approach with abundance measurements of pure mitochondrial fractions using a reference set of bona fide mitochondrial proteins with high correlation between both approaches (Figures S5A–S5C), leading to the mito-copy numbers of 1,016 MitoCoP proteins (Table S4).
Figure 4A provides an overview of the functional classification of the human mitochondrial proteome (Table S1). “Metabolism” represents the largest functional protein class both in number of different proteins (29%) and abundance (31%), reflecting the numerous biochemical processes taking place in mitochondria. A large portion of MitoCoP (19% in number and 16% in abundance) is involved in maintenance and expression of the mitochondrial genome that codes for only 13 proteins. Our data show a high abundance of OXPHOS subunits and factors involved in protein maturation and folding with the molecular chaperones HSP60/10 (Horwich, 2017; Kim et al., 2013) as the two most abundant mitochondrial proteins (Figures 4A and 4B; Figure S5D). Proteins involved in regulatory processes, signaling, quality control, and membrane dynamics were generally found in lower abundance. The so-far unexplored MitoCoP fraction (unknown function) contains many proteins of low abundance (Figures 4A and 4C) and may e.g., include substoichiometric regulatory factors; however, this fraction also contains abundant proteins with more than 100,000 mito-copies per cell, e.g., NCBP2-AS2, NTPCR, and TMEM256, which we analyzed as discussed below. Figure 4C and Table S1 provide a detailed overview of the abundance of MitoCoP proteins and their functional assignments (Table S4).
Figure 4.

Functional and absolute quantitative portrait of MitoCoP
(A) Functional classification of MitoCoP comprising 1,134 proteins. Protein abundance (ii) reflects mito-copy numbers per cell. PDH, pyruvate dehydrogenase; TCA, tricarboxylic acid; biogen., biogenesis.
(B) Cumulative mito-copy number plot (left) with quantitative and functional information about abundant MitoCoP proteins accounting for 25% (i.e., Q1) of total mito-copy numbers per cell (right). Error bars, SEM for n = 3 and range for n = 2.
(C) Copy number distributions of MitoCoP proteins, the remaining cellular proteome (other; excluding MitoCoP proteins) and MitoCoP identified/validated proteins (top) and of individual MitoCoP constituents grouped according to functional classes as defined in (A) (bottom).
See also Figures S5A–S5E and Tables S1 and S4.
In a whole-cell context, MitoCoP represents ∼7% of the cellular proteome determined here (Figure S5E; Tables S1 and S4). Nevertheless, the median abundance of mitochondrial proteins is ∼2-fold higher than that of non-mitochondrial proteins, largely resulting from highly expressed proteins of central mitochondrial machineries and processes (e.g., OXPHOS, mitochondrial ribosomes) (Figure 4C).
MitoCoP and human disease
We analyzed the disease association of the MitoCoP genes and found that >40% (460 genes) were linked to human disease-related observations (Figure 5A; Table S1). Analysis of MitoCoP disease genes according to the functional classification of the human mitochondrial proteome reveals that genes encoding proteins of the classes “metabolism” (37%) and “OXPHOS” (21%) represent the two most abundant disease gene classes, which are 1.3 to 1.5-fold overrepresented compared to the total number of proteins (Figures 5B and 5C versus Figure 4A). Together with “mitochondrial gene expression”, three functional classes represent >75% of the mitochondrial disease genes. The majority of genes were linked to clinical findings in the central nervous system (>80%) and metabolism (>70%) (Figure 5C). Only 35 MitoCoP genes were linked to a single category; the majority of MitoCoP disease genes were associated with several disease-related observations (mean 4.8) with a maximum of 13 different observations for the genes of mitochondrial deoxyguanosine kinase, mtDNA helicase Twinkle
Figure 5.

MitoCoP disease gene classification
(A) For disease mapping all MitoCoP genes were screened for disease association and classified according to protein function and disease-related observations.
(B) Functional classification of the MitoCoP disease genes as in Figure 4A.
(C) Top: Number of MitoCoP disease genes associated with different disease-related observations. Bottom: Heatmap indicating the occurrence of specific observations for MitoCoP disease genes related to their functional classification. (#), number and percentage (i) of mitochondrial disease genes for the functional sub-/class; (ii), percentage of the disease genes related to all genes of the functional sub-/class.
(D) Number of MitoCoP genes associated with one or multiple disease-related observations per gene.
See also Figures S5F and S5G and Table S1.
and cytochrome c oxidase (COX, complex IV) assembly factor heme A farnesyltransferase COX10 (Figure 5D; Figure S5F; Table S1).
A systematic mapping of the functional classification of the human mitochondrial proteome and the occurrence of disease-related observations in Figure 5C revealed that 88% of the complex V disease genes are associated with cardiovascular observations, reflecting the strong dependence of the heart on ATP supply. This analysis also highlights the specific association of complex II disease genes with tumors (67%) and a striking connection of mitochondrial morphology genes with observations related to the peripheral nervous system (69%). Mapping of the co-occurrence of disease-related observations for all 460 genes (Table S1) showed a predominant co-occurrence of various clinical findings with the category central nervous system as outlined in the heatmap in Figure S5G. Over 80% of genes in 13 clinical finding categories, which cover a broad range from metabolism to cardiovascular system, gastrointestinal system, kidney/urinary tract, and further categories, were linked to findings in the central nervous system. The second-most observed finding category metabolism showed a considerably lower co-occurrence with genes of other categories. The heatmap revealed numerous disease-related co-occurrences with an above-chance frequency, such as between muscular system and cardiovascular system, between peripheral nervous system and ears, or between reproductive system and ears.
Taken together, MitoCoP represents a comprehensive and highly stringent repository for the characterization of mitochondrial disease-linked genes (Table S1). The heatmaps provide a rich source for analyzing links between different functional categories and clinical findings on human mitochondrial diseases (Figure 5C; Figure S5G).
MitoCoP interaction networks in protein biogenesis and assembly
To obtain insight into the molecular organization of the human mitochondrial proteome, we mapped the MitoCoP complexome (Figures S6A–S6C; Table S5). We observed reproducible and consistent migration profiles between replicates, with a median correlation of 0.75 for all protein profiles (Figures S6B and S6D). Complexome analysis revealed the differential clustering of MitoCoP identified/validated proteins (Table S5) and the assignment of proteins with established mitochondrial localization to protein complexes, to which they had not been linked before. Comigration with the prohibitins PHB/PHB2 and sequence alignment suggest that C3orf33 is a so far an unknown member of the prohibitin-stomatin family (Figures S6E and S6F). The ATPase (CV) cluster includes C15orf61 with high selectivity, a protein strongly correlated with respiratory conductance (Figure S6G; McLaughlin et al., 2020).
For a direct analysis of interaction partners, we selected seven proteins of the MitoCoP identified/validated list and performed q-AP-MS studies (Table S5). (1) The smORF protein of 6.3 kDa, PIGB opposite strand 1 (PIGBOS1), copurified the hypoxia inducible domain family member 2A (HIGD2A), an ortholog of the yeast respiratory supercomplex III-IV assembly factor Rcf1, together with subunits of complex III, complex IV and metabolite transporters (Figure 6A), suggesting a relation of this smORF protein to respiratory chain assembly (Chen et al., 2012; Salvatori et al., 2020; Strogolova et al., 2012; Vukotic et al., 2012). (2) The membrane-associated protein nucleoside triphosphatase-cancer related (NTPCR) was associated with individual structural subunits of complex IV (COX5A, COX4I1 and MT-CO2) and with the assembly factor COX11 (Figure 6B), supporting a putative role in COX assembly (Nuebel et al., 2016; Timón-Gómez et al., 2018). (3) Metallo-beta-lactamase domain containing protein 2 (MBLAC2) copurified the mitochondrial ubiquitin ligase MARCH5, the cytoskeleton related proteins HAX1 and RMDN3, the signaling related protein MAVS, the TOM complex, all three VDAC isoforms, and further mitochondrial outer membrane proteins (Figure 6C), suggesting that this membrane protein may function at the outer membrane/cytosol interface. (4) The membrane-associated C22orf39 protein copurified the mitochondrial metallopeptidase and ATP synthase assembly factor homolog ATP23 together with the serine protease HTRA2/OMI, both located in the intermembrane space (Figure 6D; Osman et al., 2007; Zeng et al., 2007). We generated a CRISPR/Cas9 knockout cell line of C22orf39. The oxygen consumption of C22orf39 knockout cells, analyzed by a mitochondrial Seahorse assay, was impaired (Figure 6E). (5) LYRM9 is a member of the leucine-tyrosine-arginine motif (LYRM)-containing family of proteins. Several LYRM proteins have been shown to be involved in biosynthesis or assembly processes, including assembly of respiratory complexes and mitochondrial ribosomes (Angerer, 2015; Dibley et al., 2020), yet the function of LYRM9 has been unknown. LYRM9 copurified the respiratory chain complex I (NADH-ubiquinone oxidoreductase) N-module core subunit NDUFS1, the N-module assembly factor NDUFA2, the acyl carrier protein NDUFAB1 (which binds LYR motifs present in NDUFA6 and NDUFB9) and TMEM160 (Figure 6F; Dibley et al., 2020; Stroud et al., 2016). We generated a knockout cell line of LYRM9 and the oxygen consumption of LYRM9 knockout cells was strongly inhibited (Figure 6E). Analysis of the composition of mitochondrial protein complexes in LYRM9 knockout cells revealed a defect of complex I assembly (Figures S6H and S6I) accompanied with a decrease in complex I activity (Figure S6J). We conclude that C22orf39 and, in particular, LYRM9 are required for mitochondrial metabolic activity. (6) The membrane-integrated smORF protein NCBP2 antisense 2 (NCBP2-AS2) and (7) the transmembrane protein 256 (TMEM256) both copurified core subunits of the TIM23 complex as well as inner membrane members of the prohibitin-stomatin family of membrane scaffold proteins (PHB, PHB2, STOML2) (Figures 6G and 6H; Pfanner et al., 2019; Tatsuta and Langer, 2017). TMEM256 presumably localizes to the inner membrane (Kustatscher et al., 2019), and its complexome profile supports an interaction with the TIM23 core complex (Figure S6K). NCBP2-AS2 displays a high molecular mass form similar to PAM16 (TIMM16), DNAJC19 (PAM18/TIMM14), TIMM21, the complex III assembly factor OCIAD1 (Le Vasseur et al., 2021), the mitochondrial disease gene DNAJC30 (Figure S6L; Richter-Dennerlein et al., 2014; Tebbenkamp et al., 2018), the prohibitin protein family (Figure S6F), and the high molecular mass form of TIM23 (Figure S6M). The TIM23 complex can perform two different functions, distinguished by its association with the presequence translocase-associated motor (PAM) (Chacinska et al., 2005, 2010; Mick et al., 2012). TIM23-PAM promotes the import of proteins into the matrix, whereas the motor-free translocase is able to support lateral membrane protein insertion. TIMM21 shuttles between TIM23 and the mitochondrial translation regulation assembly intermediate of cytochrome c oxidase (MITRAC) (Mick et al., 2012; Pfanner et al., 2019; Richter-Dennerlein et al., 2016; Richter et al., 2019). Strikingly, NCBP2-AS2 and TMEM256 interact with different subcomplexes of TIM23. NCBP2-AS2 co-purified the motor subunits PAM16 and DNAJC19 (Figure 6G), indicating that NCBP2-AS2 was linked to the TIM23-PAM machinery. Immunodecoration of reverse TIMM23FLAG co-precipitates confirms the interaction of NCBP2-AS2 with TIM23 (Figure S6N). TMEM256 co-purified TIMM21, membrane integral subunits of complex I, subunits of cytochrome c oxidase and ATP synthase (Figure 6H), indicating a link of TMEM256 with TIM23 and the respiratory chain assembly line. Immunodecorations of TMEM256FLAG co-precipitates demonstrate the association with the core subunits TIMM23, TIMM17B, and TIMM50 of the presequence translocase as well as the MITRAC-linked TIMM21 and the absence of interaction with the PAM-subunits TIMM44 and mitochondrial HSP70 (GRP-75/Mortalin) (Figure 6I). A reverse pull-down with FLAG-tagged TIMM23 similarly showed the interaction of TMEM256 with TIM23 (Figure 6J). The yield for TMEM256 co-precipitation with TIMM23FLAG was lower than that for core subunits of TIM23, in line with the MS-based finding that TMEM256FLAG interacts with a number of further inner membrane proteins (Figure 6H). 2D-analysis of the TIMM23FLAG co-precipitate showed a native migration at ∼200 kDa of both TIMM23FLAG and co-purified TMEM256 (Figure 6K), demonstrating that TIMM23-interacting TMEM256 migrated with TIM23. siRNA depletion of TMEM256 moderately impaired the biogenesis of ATP5F1C (ATP synthase subunit gamma) and COX4l precursors in import experiments with isolated mitochondria (Figure 6L; Figure S6O). We conclude that NCBP2-AS2 and TMEM256 both interact with inner membrane scaffold proteins and TIM23. To confirm the differential specificities of NCBP2-AS2 and TMEM256 for the PAM import motor of the presequence translocase, a PAM16FLAG motor subunit co-precipitate was analyzed, which specifically co-purified TIM23 and NCBP2-AS2MYC but virtually no TMEM256 (Figure 6M). Thus, TMEM256 is associated with the TIM23 core and NCBP2-AS2 with the import motor of TIM23, suggesting that they assist in distinct processes of protein biogenesis and assembly.
Figure 6.

Functional MitoCoP interaction networks
(A–D, F, and G) Interaction networks of selected MitoCoP proteins analyzed by q-AP-MS (n = 2).
(E) Oxygen consumption rate of control, C22orf39KO, and LYRM9KO HEK293T cells after the indicated treatments. Error bars, SEM (n = 12). FCCP, carbonyl cyanide 4-(trifluoromethoxy)phenylhydrazone.
(H) q-AP-MS analysis of TMEM256FLAG interacting proteins (n = 4). P values were determined using a one-sided Student's t test.
(I) Cells transiently expressing TMEM256FLAG were lysed with digitonin and subjected to FLAG-immunoprecipitation and eluates were analyzed by SDS-PAGE. (Load = 1%, Eluate = 100%).
(J and K) Mitochondria isolated from TIM23FLAG expressing cells were subjected to FLAG-immunoprecipitation. Bound complexes were eluted natively and analyzed by SDS-PAGE (J) (Load = 1%, Eluate = 100%) or 2D-BN/SDS-PAGE (K) (Eluate = 100%).
(L) Mitochondria from TMEM256-depleted cells were isolated prior import of [35S]ATPC1 precursor followed by proteinase K treatment, SDS-PAGE, and digital autoradiography. Error bars, SEM (n = 3); p, precursor; m, mature; Lysate, synthesized precursor.
(M) FLAG-immunoprecipitation eluates of NCBP2-AS2MYC and PAM16FLAG expressing cells lysed with digitonin were analyzed by SDS-PAGE. (Load = 2%, Eluate = 100%).
A high-definition map of human MitoCoP dynamics
A systematic analysis of mitochondrial protein dynamics is essential toward an understanding of mitochondrial proteostasis and its regulation under physiological and pathophysiological conditions. Whole-cell studies reporting mitochondrial protein half-lives provided important first information by covering 20% to 45% of MitoCoP proteins (Fornasiero et al., 2018; Mathieson et al., 2018; Zecha et al., 2018) but report an average of the precursor and mature forms of mitochondrial proteins as well as the forms located in different cellular compartments, not only of the mitochondrial forms.
We thus established a mitochondria-specific approach for defining human MitoCoP dynamics in HeLa cells in a comprehensive manner (Figure S7A), enabling to assign half-life times (T1/2) to more than 830 MitoCoP proteins (Figures S7B and S7C; Tables S1 and S6). Human MitoCoP dynamics cover three orders of magnitude, from 1.6 h to several months, with a median protein half-life of 87 h, and the MitoCoP identified/validated proteins as well as proteins of various biosynthetic pathways show a similar dynamic range (Figures S7D and S7E). The 10% most short-lived and long-lived proteins display half-lives of <20.5 h and >279 h, respectively (Figure S7C). The median half-life of the 100 most abundant MitoCoP proteins was ∼100 h, whereas proteins with lower abundance showed a median half-life of ∼50 h (Table S1).
To further verify MitoCoP half-life data, we performed an additional dynamics study in Huh7 cells (Figure S7F; Table S6). Half-lives obtained from Huh7 and HeLa cells show a good correlation for shorter- to medium-lived proteins (half-lives <7.5 days), whereas, as expected, for very long-lived proteins (>7.5 days), estimated half-lives vary stronger in their absolute values due to increased relative errors in their calculation (Figure S7G; Table S6). MitoCoP dynamics in Huh7 cover the same range in half-lives as observed in HeLa cells but with a slightly higher median protein half-life of 103 h (compare Figure S7H with S7C). Based on direct single protein-based comparisons, MitoCoP protein half-lives were found to be highly consistent between different human cell lines (i.e., HeLa, Huh7, and HEK293T; Figures S7I and S7J; Table S6).
Our data reveal large differences in the half-lives of mitochondrial proteins, even within the same protein complex or biosynthetic pathway. We identified numerous components in central mitochondrial machineries or pathways with short half-lives (Figures 7A and 7B; Figures S7B, S7C, S7E, and S7H–S7J). Examples include: (1) Not only the TIM23-PAM import system contains the known short-lived subunits TIMM17A (Opalińska et al., 2018; Rainbolt et al., 2013) and ROMO1 (Richter et al., 2019), but also the PAM import motor system consists of proteins of different half-lives (Figure 7A, S7B, S7C, S7H and S7I). (2) The core components of the main entry gate TOMM40 and TOMM22 (Araiso et al., 2019; Shiota et al., 2015; Tucker and Park, 2019) are very long lived, whereas the initial presequence receptor TOMM20 is short lived (Figure 7A; Figures S7C, S7H and S7I). (3) Different populations of the intermembrane space chaperones for transfer of β-barrel proteins and metabolite carriers show considerable differences in half-lives. The major TIMM9-TIMM10 complex is long lived, whereas the TIMM8B-TIMM13 complex is short lived (Figure 7A; Figure S7I). Unexpectedly, TIMM8A, mutations of which cause the human deafness dystonia (Mohr-Tranebjaerg) syndrome (Kang et al., 2019; Roesch et al., 2002), is longer lived than its counterpart TIMM8B. (4) The degradation of the dynamin-like mitochondrial GTPase fusion proteins mitofusin (MFN)/fuzzy onion (Fzo1) is regulated by activity-dependent conformation-specific ubiquitination (Anton et al., 2013; Cohen et al., 2011), which is consistent with the short half-life of MFN1 and MFN2 (Figure 7B). Further proteins involved in mitochondrial fusion and fission are also mainly very short lived (Figure 7B; FiguresS7C, S7H, and S7I), suggesting a post-translational regulation of the machineries controlling mitochondrial membrane dynamics (Labbé et al., 2014; Mishra and Chan, 2014). (5) The subunits of the five oxidative phosphorylation complexes also display considerable differences in half-lives (Figure 7B; Figures S7C and S7H–S7J). For example, the matrix arm of respiratory complex I with the superoxide-producing flavin (IF site) features proteins with short half-lives sensitive to ROS. The IF site is considered to be the major site for mitochondrial superoxide production, driven by reverse electron transport through complex I to the flavin mononucleotide (Kussmaul and Hirst, 2006; Robb et al., 2018; Szczepanowska et al., 2020; Zecha et al., 2018). (6) The enzymes involved in CoQ biosynthesis are very short lived (Figures S7C, S7E, S7H and S7I), suggesting that the whole biosynthetic pathway is associated with rapid biosynthesis and turnover of its components (Stefely and Pagliarini, 2017).
Figure 7.

Protein half-life map of the human mitochondrial organizing network
(A) Schematic illustration of the two membrane-spanning mitochondrial protein import systems showing half-lives for individual components of each complex. CHCHD10/MIC14 is possibly linked to MICOS. IM/OM, inner/outer mitochondrial membrane; MITRAC, mitochondrial translation regulation assembly intermediate of cytochrome c oxidase.
(B) Protein half-life landscape of the central mitochondrial complexome grouped according to function. Numbers in italics indicate the median half-life of the respective protein group.
Discussion
We report a comprehensive high-confidence proteome of human mitochondria. The increasing importance of mitochondrial biogenesis and functions for understanding cellular physiology and pathophysiology (Frazier et al., 2019; Nuebel et al., 2016; Shpilka and Haynes, 2018; Suomalainen and Battersby, 2018; Vafai and Mootha, 2012) poses a major need for defining the protein complement of human mitochondria. However, various studies and repositories assigned a large and quite diverse number of proteins to mitochondria (Calvo et al., 2016; Smith and Robinson, 2019; Thul et al., 2017). Whereas the number of annotations in frequently used mitochondrial data repositories significantly exceeds the expected human mitochondrial proteome size, many mitochondrial proteins still lack solid experimental evidence, and some mitochondrial proteins might have eluded identification so far. We performed a stringent analysis and selection of high-confidence mitochondrial proteins without compromising a comprehensive identification. This allowed the definition of MitoCoP, which contains 1,134 human genes coding for mitochondrial and mitochondria-associated proteins, including multi-localizing proteins and many low abundant membrane proteins (Table S1).
We identified numerous human mitochondrial proteins, including several components such as LYRM9, PIGBOS1, and NTPCR linked to the assembly of oxidative phosphorylation complexes (Figures 3 and 6; Figures S4 and S6). With NCBP2-AS2 and TMEM256, two new factors were identified that associate with different forms of the mitochondrial presequence translocase, thus differentiating between the motor-bound TIM23-PAM machinery for matrix protein import and the TIM23-TIMM21 sorting machinery that links protein import to respiratory chain assembly and mitochondrial translation regulation (Chacinska et al., 2005, 2010; Mick et al., 2012; Richter-Dennerlein et al., 2016; Stoldt et al., 2018).
The comprehensive and stringent selection of MitoCoP proteins allowed a systematic mapping of genes linked to mitochondrial diseases in humans. More than 40% of MitoCoP genes are connected to at least one and typically several categories of clinical findings, with a high preference for disease-related observations in the central nervous system or metabolism (Figure 5; Figure S5; Table S1). A complete mapping of the co-occurrence of clinical categories and functional classes revealed numerous links with an above-chance frequency, such as between the cardiovascular system and the ATP synthase (complex V), providing systematic insight into the complexity of human mitochondrial diseases.
Multilocalizing proteins and cytosolic degradation of precursors disturbed the quantification of abundance and turnover of mitochondrial proteins in the previously used whole-cell assays (Boos et al., 2019; Fornasiero et al., 2018; Kalderon and Pines, 2014; Mårtensson et al., 2019; Mathieson et al., 2018; Morgenstern et al., 2017; Peikert et al., 2017; Thul et al., 2017; Weidberg and Amon, 2018; Wiśniewski et al., 2014; Wrobel et al., 2015; Zecha et al., 2018). MitoCoP represents a comprehensive proteome with mitochondria-specific absolute abundance (Figure 4; FigureS5) and turnover values, providing a wealth of information for characterizing mitochondrial biogenesis, function, and dynamics in health and disease. The half-lives of mitochondrial proteins span three orders of magnitude, even within the same protein complex or biosynthetic pathway (Figure 7; FigureS7). MitoCoP unveils that the two isoforms of the nucleotide exchange factor GrpE (GrpEL1, GrpEL2) as well as the two isoforms of the HSP70-stimulating cochaperone PAM18/TIMM14 (DnaJC15, DnaJC19) display considerably different half-lives, supporting the view of different populations and regulation of the TIM23-PAM system that is essential for the import of precursor proteins into the mitochondrial matrix (Opalińska et al., 2018; Pfanner et al., 2019; Rainbolt et al., 2013). The TIM22 complex is responsible for importing the large number of metabolite carriers into the inner membrane that are crucial in controlling the metabolite flux between the mitochondrial matrix and other cellular compartments (Palmieri and Monné, 2016; Rampelt et al., 2020; Taylor, 2017). The short half-life of TIMM22 may represent a means for rapidly adjusting the import of metabolite carriers to changing metabolic conditions, whereas the associated acylglycerol kinase, mutations of which cause Sengers syndrome (Kang et al., 2017; Vukotic et al., 2017), is long lived. TIMM22 also inserts the precursors of TIMM23 and TIMM17A/B into the inner membrane (Gomkale et al., 2020; Neupert and Herrmann, 2007), providing a possible cross-regulation of core components of the presequence translocase. We propose that short-lived subunits of the mitochondrial preprotein translocases may function as regulatory sensors, targets, or checkpoints for controlling mitochondrial biogenesis under different metabolic and stress conditions. The inner membrane MICOS system is crucial for controlling mitochondrial membrane architecture (Harner et al., 2011; Hoppins et al., 2011; von der Malsburg et al., 2011). The central subunit MIC60 that bridges MICOS to the SAM complex of the outer membrane is long lived, forming stable contact sites between inner and outer membranes of human mitochondria (Ding et al., 2015; Körner et al., 2012; Ott et al., 2012). In contrast, MIC13/QIL1 and CHCHD10 (coiled-coil helix coiled-coil helix domain protein 10)/MIC14 are short-lived. MIC13/QIL1, mutations of which lead to fatal hepato-encephalopathy (Guarani et al., 2016; Zeharia et al., 2016), links two MICOS subcomplexes and is required for MICOS assembly (Anand et al., 2016; Guarani et al., 2015), and CHCHD10/MIC14 has been linked to several neuropathies and possibly cooperates with MICOS (Genin et al., 2016; Zhou et al., 2019). MIC13 and possibly CHCHD10/MIC14 may thus function as targets for modulating mitochondrial cristae architecture. The essential process of biosynthesis of Fe-S clusters (Lill and Freibert, 2020; Rouault, 2015) involves long-lived as well as short-lived components like ISCU and ISCA1. Such short-lived proteins may represent regulatory checkpoints within central biosynthetic pathways that can be rapidly degraded and replenished.
Taken together, the human high-confidence proteome MitoCoP includes mitochondria-specific protein copy numbers, protein-protein and complexome interaction data, protein dynamics analysis, and functional mapping of mitochondrial disease-linked genes. MitoCoP opens a large field for defining so far unexplored regulatory components and pathways in mitochondria with implications for human health and disease.
Limitations of study
In bottom-up proteomics, proteins can only be identified if proteolytic peptides are generated that are suitable for MS-based sequencing experiments. Thus, it is likely that we missed some bona fide mitochondrial proteins in our study, especially those ones with a molecular mass <10 kDa and very few or unfavorable proteolytic cleavage sites. However, we mitigated this issue by performing multifaceted proteomics analyses including multi-protease digestion experiments. In addition, a number of proteins located in multiple subcellular niches with only a minor fraction specifically residing in mitochondria were likely detected in our study but possibly remained below our assigned high-confidence thresholds. Although MitoCoP is valid for different cell types, our study did not intend to cover proteins that specifically locate to mitochondria only under certain metabolic or stress conditions. Finally, copy numbers and half-lives reported for mitochondrial proteins in this study are computationally assessed and largely depend on the accuracy of MS-based peptide/protein quantification data.
STAR★Methods
Key resources table
| REAGENT or RESOURCE | SOURCE | IDENTIFIER |
|---|---|---|
| Antibodies | ||
| Mouse monoclonal anti-FLAG M2 | Sigma-Aldrich | Cat.#F1804; RRID: AB_262044 |
| Rabbit polyclonal anti-ABHD18 (C4orf29) | Thermo Fisher Scientific | Cat.#PA5-62150; RRID: AB_2639067 |
| Rabbit polyclonal anti-ADCK1 | Thermo Fisher Scientific | Cat.#PA5-28685; RRID: AB_2546161 |
| Rabbit monoclonal anti-sodium potassium ATPase (ATP1A1) | abcam | Cat.#ab76020; RRID: AB_1310695 |
| Rabbit polyclonal anti-ATP5B (GR4826-2) | Peter Rehling | N/A |
| Rabbit polyclonal anti-C1orf53 | antikoerper-online.de | Cat.#ABIN1714972 |
| Rabbit polyclonal anti-C15orf40 | Novus Biologicals | Cat.#NBP1-91716; RRID: AB_11055943 |
| Rabbit polyclonal anti-C17orf80 | Thermo Fisher Scientific | Cat.#PA5-49463; RRID: AB_2634917 |
| Rabbit polyclonal anti-C20orf149 (PPDPF) | Proteintech | Cat.#19912-1-AP; RRID: AB_10642438 |
| Rabbit polyclonal anti-C22orf39 | Thermo Fisher Scientific | Cat.#PA5-68487; RRID: AB_2690527 |
| Rabbit polyclonal anti-COX1 (GR2035-3) | Nils Wiedemann | N/A |
| Rabbit monoclonal anti-COX2/MTCO2 | abcam | Cat.# ab79393; RRID: AB_1603751 |
| Rabbit polyclonal anti-COX4I (GR1522-7) | Nils Wiedemann | N/A |
| Rabbit polyclonal anti-CYP27C1 | Thermo Fisher Scientific | Cat.#PA5-68017; RRID: AB_2691534 |
| Rabbit polyclonal anti-DTD1 | Thermo Fisher Scientific | Cat.#PA5-59376; RRID: AB_2640809 |
| Rabbit polyclonal anti-GAPDH (GR5241-1) | Nils Wiedemann | N/A |
| Rabbit monoclonal pan anti-Histone H4 (HIST1H4A) | Millipore | Cat.#04-858; RRID: AB_1977264 |
| Rabbit polyclonal anti-HSP70 (GR4946-4) | Peter Rehling | N/A |
| Rabbit polyclonal anti-KIAA1191 | Thermo Fisher Scientific | Cat.#PA5-61666; RRID: AB_2643033 |
| Rabbit polyclonal anti-LYRM9 | Thermo Fisher Scientific | Cat.#PA5-70877; RRID: AB_2689618 |
| Rabbit polyclonal anti-MDH2 | abcam | Cat.# ab96193; RRID: AB_10679348 |
| Rabbit polyclonal anti-NDUFA4 (GR5002-1) | Peter Rehling | N/A |
| Rabbit polyclonal anti-NDUFA9 (GR1525-4) | Nils Wiedemann | N/A |
| Rabbit polyclonal anti-NDUFB8 (GR3764-1) | Peter Rehling | N/A |
| Rabbit polyclonal anti-OVCA2 | Thermo Fisher Scientific | Cat.#PA5-31447; RRID: AB_2548921 |
| Rabbit polyclonal anti-PEX14 (GR5247-1) | Nils Wiedemann | N/A |
| Rabbit polyclonal anti-PTAR1 | Thermo Fisher Scientific | Cat.#PA5-72542; RRID: AB_2718396 |
| Rabbit polyclonal anti-PTRHD1 | Biorbyt | Cat.#orb317726 |
| Rabbit polyclonal anti-SEC61B (GR5242-1) | Nils Wiedemann | N/A |
| Rabbit polyclonal anti-TATDN1 | Thermo Fisher Scientific | Cat.#PA5-21797; RRID: AB_11155629 |
| Rabbit polyclonal anti-TIMM17B (GR5141-7) | Peter Rehling | N/A |
| Rabbit polyclonal anti-TIMM21 (GR3675-5) | Peter Rehling | N/A |
| Rabbit polyclonal anti-TIMM22 | Proteintech | Cat.# ; 14927-1-AP; RRID: AB_11183050 |
| Rabbit polyclonal anti-TIMM23 (GR1527-6) | Peter Rehling | N/A |
| Rabbit polyclonal anti-TIMM44 | Proteintech | Cat.#13859-1-AP; RRID: AB_2204679 |
| Rabbit polyclonal anti-TIMM50 (GR3781-1) | Peter Rehling | N/A |
| Rabbit polyclonal anti-TIMMDC1 (GR4846-2) | Peter Rehling | N/A |
| Rabbit polyclonal anti-TOMM40 | Proteintech | Cat.# 18409-1-AP; RRID: AB_2303725 |
| Rabbit polyclonal anti-TMEM141 | Thermo Fisher Scientific | Cat.#PA5-53201; RRID: AB_2648588 |
| Rabbit polyclonal anti-TMEM242 | antikoerper-online.de | Cat.# ABIN1714981 |
| Rabbit polyclonal anti-TMEM256 | Thermo Fisher Scientific | Cat.#PA5-66525; RRID: AB_2664033 |
| Rabbit polyclonal anti-TOMM70 (GR5006-6) | Nils Wiedemann | N/A |
| Rabbit polyclonal anti-UQCRFS1 (GR1512-4) | Nils Wiedemann | N/A |
| Rabbit polyclonal anti-ZNF703 | Thermo Fisher Scientific | Cat.#PA5-40753; RRID: AB_2577269 |
| Goat anti-Mouse Alexa Fluor 488 | Thermo Fisher Scientific | Cat.#A-21042; RRID: AB_2535711 |
| Goat anti-Rabbit IgG (whole molecules) peroxidase | Sigma-Aldrich | Cat.#A6154; RRID: AB_258284 |
| Bacterial and Virus Strains | ||
| One Shot TOP10 Chemically Competent E. coli | Thermo Fisher Scientific | Cat.#C404010 |
| XL1-Blue E. coli | Stratagene | Cat.#200158 |
| Chemicals, Peptides, and Recombinant Proteins | ||
| ε-Amino n-caproic acid | Sigma-Aldrich | Cat.#A7824 |
| Adenosine triphosphate (ATP) | Roche | Cat.#32253826 |
| Anti-FLAG M2 Affinity Gel | Sigma-Aldrich | Cat.#A2220 |
| Antimycin A | Sigma-Aldrich | Cat.#A8674 |
| AspN, Sequencing Grade | Promega | Cat.# V1621 |
| BAMBANKER | Wako | Cat.#306-14684 |
| Bis-Tris | Carl Roth | Cat. #9140.8 |
| Carbonyl cyanide 4-(trifluoromethoxy)phenylhydrazone (FCCP) | Abcam | Cat.#ab120081 |
| Chymotrypsin, Sequencing Grade | Promega | Cat.#V1061 |
| Coomassie Brilliant Blue G-250 | Serva | Cat.#17524 |
| Digitonin WS | MATRIX BioScience | Cat.#60105 |
| DMEM, high glucose | GIBCO/Thermo Fisher Scientific | Cat.#21969035 |
| DMEM, high glucose, w/o arginine and lysine (for SILAC) | Anprotec | Cat.#AC-LM-0065 |
| Doxycycline hydrochloride | Alfa Aesar/Thermo Fisher Scientific | Cat.#J60422 |
| DPBS | PAN Biotech | Cat.#P04-36005P |
| DpnI | NEB | Cat.#R0176S |
| Fetal bovine serum | Sigma-Aldrich | Cat.#F7524 |
| Fetal bovine serum, dialyzed | anprotec | Cat.#AC-SM-0037 |
| FLAG peptide | Sigma-Aldrich | Cat.#F3290 |
| Formaldeyde, heavy (13CD2O) | Sigma-Aldrich | Cat.#492620 |
| Formaldeyde, light (CH2O) | Sigma-Aldrich | Cat.#252549 |
| GeneJuice Transfection Reagent | Sigma-Aldrich | Cat.#70967 |
| GluC, Sequencing Grade | Promega | Cat.#V1651 |
| L-Arginine | Carl Roth | Cat.#3144.1 |
| 13C6/14N4-L-Arginine (Arg6) | Eurisotop | Cat.#CLM-2265-H |
| 13C6/15N4-L-Arginine (Arg10) | Eurisotop | Cat.#CNLM-539-H |
| L-Glutamine solution | Sigma-Aldrich | Cat.#G7513 |
| L-Lysine monohydrochloride | Merck | Cat.#1.05700.0100 |
| D4-L-Lysine (Lys4) | Eurisotop | Cat.#DLM-2640 |
| 13C6/15N2-L-Lysine (Lys8) | Eurisotop | Cat.#CNLM-291-H |
| L-Proline | Merck | Cat.#1.07434.0100 |
| Lipofectamine 2000 Transfection Reagent | Thermo Fisher Scientific | Cat.#11668-027 |
| Lipofectamine RNAiMax Transfection Reagent | Thermo Fisher Scientific | Cat.#13778100 |
| LysC | Wako | Cat.#125-02541 |
| MitoTracker Red CMXRos | Thermo Fisher Scientific | Cat.#M7512 |
| Oligomycin | Sigma-Aldrich | Cat.#O4876 |
| OptiMEM | Thermo Fisher Scientific | Cat.#11058021 |
| Penicillin-Streptomycin (Pen-Strep) | GIBCO/Fisher Scientific | Cat.#5140-122 |
| Poly-D-lysine hydrobromide | Sigma-Aldrich | Cat. #P6407 |
| Polyethylenimine (PEI) | Sigma-Aldrich | Cat.# 904759-250G |
| Proteinase K | Roche | Cat.#14801720 |
| Rotenone | Sigma-Aldrich | Cat.#R8875 |
| RotiQuant | Carl Roth | Cat.#K015.1 |
| SILAC DMEM High Glucose (w/o arginine and lysine) | anprotec | Cat.#AC-LM-0065 |
| Sodium cyanoborohydride | Sigma-Aldrich | Cat.#156159 |
| T4 DNA Ligase | NEB | Cat.#M0202S |
| T4 Polynucleotide Kinase | NEB | Cat.#M0201S |
| T4 Polynucleotide Kinase Reaction Buffer | NEB | Cat.#B0201S |
| Trichloroacetic acid | Carl Roth | Cat.#8789.1 |
| Trypsin, Sequencing Grade Modified | Promega | Cat.#V5111 |
| TurboFect Transfection Reagent | Thermo Fisher Scientific | Cat.#R0531 |
| Uridine | Sigma-Aldrich | Cat.#U3003 |
| Valinomycin | Sigma-Aldrich | Cat.#V0627 |
| Seahorse XF Base Medium (minimal DMEM) | Agilent | Cat.#102353-100 |
| Critical Commercial Assays | ||
| Complex I Enzyme Activity Microplate Assay Kit (Colorimetric) | abcam | Ab109721 |
| Gibson Assembly Master Mix | NEB | Cat.#E2611 |
| MEGAclear Transcription Clean-Up Kit | Thermo Fisher Scientific | Cat.#AM1908 |
| mMESSAGE mMACHINE SP6 Transcription Kit | Thermo Fisher Scientific | Cat.#AM1340 |
| QIAprep Spin Miniprep Kit | QIAGEN | Cat.#27106 |
| TNT SP6 Quick Coupled Transcription/Translation System | Promega | Cat.#L2080 |
| Zero Blunt PCR Cloning Kit | Thermo Fisher Scientific | Cat.#K270020 |
| Deposited Data | ||
| Proteomic datasets (MS/MS raw files and MaxQuant analysis files) | This paper | ProteomeXchange: PXD016924, PXD018122, PXD018182, PXD028149, PXD028169, PXD029242 |
| Experimental Models: Cell Lines | ||
| Human HeLa cells | Leibniz Institute, DSMZ | ACC 57 |
| Human HeLa tom40 kd-2 (TOMM40-shRNA cells) | Kozjak-Pavlovic et al., 2007 | N/A |
| Human HeLa tom70 kd-1 (TOMM70-shRNA cells) | Kozjak-Pavlovic et al., 2007 | N/A |
| Human HEK293T | ATCC | ATCC CRL-1573 |
| Human HEK Flp-In T-REx-293 | Thermo Fischer Scientific | Cat.#R78007 |
| Human HEK Flp-In T-REx-293-LYRM9-KO | This study | N/A |
| Human HEK Flp-In T-REx-293-C22orf39-KO | This study | N/A |
| Human HEK Flp-In T-REx-293-TIMM23-FLAG | Mick et al., 2012 | N/A |
| Human Huh7 cells | Nakabayashi et al., 1982 | N/A |
| Human U2OS cells | European Collection of Authenticated Cell Cultures | 92022711, Lot. 17E015 |
| Oligonucleotides | ||
| 5¢-UGG-UAG-UAA-AAG-CUG-GUG-C-3¢ (sequence of TMEM256 siRNA) | This study | N/A |
| see Table S7 for a list of primers used in this study | This study | N/A |
| Recombinant DNA | ||
| pcDNA3.1(-) | Thermo Fischer Scientific | Cat.#V79520 |
| pcDNA3.1(-)-C22orf39-FLAG | This study | 3135 |
| pcDNA3.1(-)-MBLAC2-FLAG | This study | 3134 |
| pcDNA3.1(-)-LYRM9-FLAG | This study | 3136 |
| pcDNA3.1(-)-PIGBOS1-FLAG | This study | 3132 |
| pcDNA3.1(-)-NCBP2-AS2-FLAG | This study | 3137 |
| pcDNA3.1(-)-NTPCR-FLAG | This study | 3133 |
| pcDNA3.1(-)-NCBP2-AS2-Myc | This study | N/A |
| pcDNA3.1(-)-PAM16-FLAG | This study | N/A |
| pcDNA5/FRT/TO | Thermo Fischer Scientific | Cat.#V652020 |
| pcDNA5/FRT/TO-LYRM9-FLAG | This study | N/A |
| pcDNA5/FRT/TO- TIM23-FLAG | Mick et al., 2012 | N/A |
| pcDNA5/FRT/TO-FLAG-TMEM256 | This study | N/A |
| pEGFP-N1 | Clonetech | Cat.#6085-1 |
| pEGFP-N1-CCSMST1 | This study | 3126 |
| pEGFP-N1-CYP27C1 | This study | 3128 |
| pEGFP-N1-NCBP2-AS2 | This study | 3129 |
| pEGFP-N1-NOCT | This study | 3130 |
| pEGFP-N1-PTRHD1 | This study | 3131 |
| pEGFP-N1-SLC30A9 | This study | 3127 |
| pOG44 | Thermo Fisher Scientifc | Cat.#V600520 |
| pOTB7-COX4I | Mick et al., 2012 | N/A |
| pSpCas9(BB)-2A-GFP (PX458) | Addgene | Cat.#48138 |
| pSpCas9(BB)-2A-GFP-C22orf39-KO | This study | 3138 |
| pSpCas9(BB)-2A-GFP-LYRM9-KO | This study | 3139 |
| pTNT | Promega | Cat.#L5610 |
| pTNT-ATP5C1 | This study | N/A |
| C22orf39 | This study (custom synthesis; Eurofins) | N/A |
| C5orf63 | This study (custom synthesis; Eurofins) | N/A |
| CCSMST1 | Source BioScience | IRALp962D1133Q |
| CYP27C1 | Source BioScience | IRATp970H08102D |
| DHRS4 | Source BioScience | IRAUp969E0618D |
| DHRS4L2 | This study (custom synthesis; Eurofins) | N/A |
| LYRM9 | This study (custom synthesis; Eurofins) | N/A |
| MBLAC2 | Source BioScience | IRATp970F0257D |
| NCBP2-AS2 | Source BioScience | IRAUp969H03105D |
| NOCT | Source BioScience | IRCMp5012H1210D |
| NT5C3A | SourceBioScience | IRATp970C1295D |
| NTPCR | Source BioScience | IRAUp969B0935D |
| OXLD1 | Source BioScience | IRATp970G11100D |
| PIGBOS1 | This study (custom synthesis; Eurofins) | N/A |
| PTRHD1 | Source BioScience | IRAUp969G11111D |
| SLC30A9 | Source BioScience | IRATp970C0815D |
| Su9-DHFR | Pfanner et al., 1987 | N/A |
| Software and Algorithms | ||
| MaxQuant/Andromeda (version 1.6.0.1) | Cox and Mann, 2008; Cox et al., 2011 | https://www.maxquant.org/ |
| Perseus incl. ‘proteomic ruler’ plugin (version 1.6.1.1) | Tyanova et al., 2016 | https://maxquant.net/perseus/ |
| MitoMiner/IMPI (version Q2 2018) | Smith and Robinson, 2009, 2019 | https://mitominer.mrc-mbu.cam.ac.uk |
| PANTHER (version 14.1) | Mi et al., 2019 | http://www.pantherdb.org/ |
| R studio | R Core Team, 2018 | https://www.r-project.org/ |
| ‘Rtsne’ package in R | CRAN repository | https://cran.r-project.org/web/packages/Rtsne/index.html |
| ‘dbscan’ package in R | CRAN repository | https://cran.r-project.org/web/packages/dbscan/index.html |
| ‘nls.lm’ function in R (package ‘minipack.lm’, version 1.2-1) | CRAN repository | https://cran.r-project.org/web/packages/minpack.lm/index.html |
| ‘linkage’ function from Python (package ‘scipy.cluster’, version 1.6.2) | Virtanen et al., 2020 | https://www.scipy.org/ |
| ‘pandas’ package in Python (version 1.2.4) | McKinney, 2011 | https://pandas.pydata.org/ |
| ‘matplotlib’ package in Python (version 3.3.4) | Hunter, 2007 | https://matplotlib.org/ |
| ‘seaborn’ package in Python (version 0.11.1) | Waskom, 2021 | https://seaborn.pydata.org/ |
| ‘numpy’ package in Python (version 1.20.2) | Harris et al., 2020 | https://numpy.org/ |
| ‘StandardScaler’ class from Python, sklearn.preprocessing (version 0.24.2) | Pedregosa et al., 2011 | https://scikit-learn.org/stable/ |
| ‘DBSCAN’ class from Python, sklearn.cluster module (version 0.24.2) | Pedregosa et al., 2011 | https://scikit-learn.org/stable/ |
| ‘curve_fit’ function from Python, scipy.optimize (version 1.6.2) | Virtanen et al., 2020 | https://www.scipy.org/ |
| Fiji/ImageJ (version 2.0.0-rc-69/1.52p) | Schindelin et al., 2012 | N/A |
| Image Reader LAS-4000 (version 1.12) | Fujifilm | N/A |
| Multi Gauge, version 3.2 | Fujifilm | N/A |
| SoftWoRx | GE Healthcare | N/A |
| Typhoon FLA 7000 (version2.1, build 1.2.1.93) | GE Healthcare | N/A |
| Other | ||
| C18-SD 7 mm/3 mL extraction disc cartridges | 3M Empore | Cat.#4215SD |
| 0.2 μm PTFE membrane syringe filter | Phenomenex | Part# AF0-3202-12 |
| NX 3u Gemini C18 column | Phenomenex | Part#00F-4453-B0 |
| C18 extraction disks (StageTips) | 3M Empore | Cat.#2215 |
| PepMap™ C18 precolumns | Thermo Scientific | Cat.#160454 |
| Acclaim™ PepMap™ (C18 reversed-phase nano LC column) | Thermo Scientific | Cat.#164942 |
| NuPAGE BisTris gradient gels (4%–12%) | Invitrogen/Thermo Fisher Scientific | Cat.#NP0321 |
Resource availability
Lead contact
Further information and requests for resources and reagents should be directed to and will be fulfilled by the lead contact Bettina Warscheid (bettina.warscheid@biologie.uni-freiburg.de).
Materials availability
Materials generated in this study are available upon request from the lead contact.
Experimental model and subject details
Cell lines and culture conditions
Human embryonic kidney (HEK; cell line Flp-In T-REx-293), HeLa (human epithelial-like cells, derived from a cervix carcinoma), Huh7 (human liver cells) and U2OS cells (human osteosarcoma cells) used for proteomic experiments were cultured in Dulbecco’s Modified Eagle Medium (DMEM; high glucose [25 mM], supplemented with GlutaMAX) containing 10% (v/v) fetal bovine serum (FBS), 1 mM sodium pyruvate and 0.22 mM uridine. HeLa cells used for importomics experiments, carrying a doxycycline (DOX)-inducible shRNA directed against tomm40 or tomm70 cloned into the pLV-THM vector (referred to as tomm40- or tomm70-shRNA cells) (Kozjak-Pavlovic et al., 2007), were cultured in DMEM as described above additionally supplemented with minimum essential medium non-essential amino acids, 1 mg/L p-aminobenzoic acid and 0.2 mg/L D-(+) biotin. To induce tomm40 or tomm70 knockdown, cells were treated with DOX (dissolved in DMSO; 1 μg/mL final concentration) for 9 days. DOX was replenished every 48 to 72 h to continue induction of the tomm40 and tomm70 shRNA. Cells mock-treated with DMSO were used as control. The HEK293 cell line expressing tetracycline-inducible TIM23FLAG has been described before (Mick et al., 2012).
For biochemical validation of subcellular localization, fluorescence microscopy, in vitro import of radiolabeled proteins and cultivation of CRISPR/Cas9 knockout cells, HEK293T or Flip-In T-REx-293 cells were grown in DMEM supplemented with 10% (v/v) FBS, 1% (v/v) Penicillin-Streptomycin solution (Pen-Strep), 1% (v/v) 200 mM L-glutamine solution and 0.1% (v/v) 50 mg/mL uridine. For stocking, cells were washed with Dulbecco’s phosphate-buffered saline (DPBS), resuspended in BAMBANKER and frozen at −80°C. All cultures were incubated in a humidified atmosphere at 37°C and 5% CO2.
For stable isotope labeling by amino acids in cell culture (SILAC; Ong et al., 2002), stable isotope-coded ‘heavy’ (H) arginine (13C6/15N4; Arg10) and lysine (13C6/15N2; Lys8), ‘medium-heavy’ (MH) arginine (13C6/14N2; Arg6) and lysine (2H4; Lys4) and the ‘light’ (L) variants of these amino acids (Arg0, Lys0) were used as indicated. Cells were cultured for at least eight cell doublings in SILAC DMEM (high glucose) lacking arginine and lysine supplemented with 10% (v/v) dialyzed FBS, 1 mM sodium pyruvate, 0.22 mM uridine, 2 mM L-glutamine, 100 mg/L arginine (H, MH or L), 140 mg/L lysine (H, MH or L) and 200 mg/L L-proline to prevent arginine-to-proline conversion (Bendall et al., 2008). Pen-Strep (1% [v/v]) was generally added to cultures used for validation experiments. Efficient incorporation of medium-heavy and heavy amino acids (i.e., > 99%) was verified by liquid chromatography-mass spectrometry (LC-MS).
The pSILAC strategy was used to determine mitochondrial protein turnover and half-lives in proteome dynamics experiments using HeLa and Huh7 cells. For the analysis of mitochondrial protein dynamics in HeLa cells, the experimental design was as follows: In replicate 1, 2x10⁶ cells labeled with light (control) or medium-heavy amino acids were seeded onto 15 cm dishes (one dish each per time point) and grown for 24 h in medium containing the respective amino acids. A pulse from medium-heavy to heavy amino acids was performed for 48 h, 24 h, 12 h, 6 h, 3 h, and 1 h prior to harvesting. Before adding the heavy medium, cells were carefully washed once with 20 mL of PBS. Corresponding control cells, maintained in light medium for the duration of the experiment, were treated equally by exchanging the light medium at the same time points. In replicate 2, control cells were labeled medium-heavy and the pulse was performed from heavy to light; in replicate 3, control cells were labeled heavy and the pulse was performed from light to medium-heavy. The study of mitochondrial proteome dynamics in Huh7 cells was performed with the following modifications: cells were grown in light medium and pulsed with heavy medium for 0 h, 5 h, 10 h, 24 h, and 48 h (n = 2 per time point).
Method details
Experimental design
In this work, six complementary quantitative MS-based experimental strategies were employed to accurately define and characterize the mitochondrial proteome of human cells (MitoCoP). For better understanding, we here provide a brief overview of the key features of the experimental design of each of these strategies.
Subtractive proteomics: Crude and gradient-purified mitochondrial fractions were prepared from differentially SILAC-labeled HEK cells and mixed in equal amounts based on protein concentration. Proteins were digested in solution using multiple proteases followed by offline high pH reversed-phase liquid chromatography (RP-LC) for peptide fractionation (32 fractions). The experiment was performed in four biological replicates including label-switch. This resulted in a total of 512 samples for LC-MS analysis. This study was complemented by a multiple cell line analysis using HEK, HeLa, Huh7, and U2OS cells and trypsin as protease (n = 2 each, with label-switch).
Spatial proteomics: Total cell lysate and nuclear, cytosolic, microsomal, crude and pure mitochondrial fractions were prepared from HEK cells (n = 3; label-free). Proteins were digested in solution using LysC/trypsin, and peptides were fractionated offline by high pH RP-LC (16 fractions). Total number of samples analyzed by LC-MS: 288.
Importomics: Equal amounts of differentially SILAC-labeled tomm40-shRNA cells (HeLa cells) treated with DOX and the corresponding mock-treated control cells were mixed after harvesting based on wet weight. Gradient-purified mitochondria were prepared, proteins were digested in solution with trypsin, and peptides were fractionated offline by high pH RP-LC (32 fractions). Four biological replicates including label-switch were performed. Total number of samples analyzed by LC-MS: 128.
Carbonate/Sonication assays: Gradient-purified mitochondria, prepared from HEK cells, were either treated with carbonate or sonified (n = 4). Samples were separated into soluble and insoluble fractions. Proteins were digested in-solution with trypsin and peptides were labeled by stable isotope dimethyl labeling (with label-switch; Boersema et al., 2009). Differentially labeled peptides from equal volumes of soluble and insoluble fractions of each replicate were mixed and fractionated by high pH RP fractionation using StageTips (8 fractions). Total number of samples analyzed by LC-MS: 64.
Complexome profiling: Gradient-purified mitochondria were prepared from HEK cells and analyzed by blue native polyacrylamide gel electrophoresis (BN-PAGE; n = 2, label-free). Gel lanes were cut into 116 (replicate 1) and 114 (replicate 2) slices and proteins were in-gel digested with trypsin. Total number of samples analyzed by LC-MS: 230.
Dynamics of the mitochondrial proteome (pSILAC): Equal numbers of differentially SILAC-labeled pulsed and control cells (HeLa; 2.0 - 2.5x10⁷ cells each) were mixed (n = 3; with label-switch). Crude mitochondrial fractions were prepared and proteins were digested in solution using LysC/trypsin. Peptides were fractionated offline by high pH RP-LC (8 fractions). Total number of samples analyzed by LC-MS: 144. This study was complemented by the analysis of mitochondrial protein dynamics in Huh7 cells (n = 2).
Subcellular fractionation and preparation of mitochondria
To prepare samples for subtractive proteomics, spatial proteomics, importomics, carbonate/sonication assays and pSILAC experiments, cells were harvested, washed with PBS and collected by centrifugation for 5 min at 800 x g. The pellets were resuspended in 1 mL per 15 cm dish of ice-cold SEM buffer (250 mM sucrose, 1 mM EDTA, 10 mM MOPS-KOH [pH 7.2]) containing 1 mM phenylmethylsulfonyl fluoride (PMSF; for spatial proteomics experiments, PMSF was omitted to prevent inhibition of proteases used for protein digestion prior to LC-MS analysis). Cells were homogenized on ice using a pre-cooled glass homogenizer and a teflon pestle (25-30 strokes at 2,400 rpm). Following centrifugation of the homogenate (also referred to as ‘total’ in this work) for 5 min at 800 x g and 4°C, the organelle-containing supernatant was removed. The pellet was resuspended in SEM(/PMSF) buffer and sonified for 30 s. This fraction, referred to as ‘P0.8’, contains mainly nuclei. The supernatant was subjected to a clarifying spin (5 min, 800 x g, 4°C) followed by centrifugation for 10 min at 8,000 x g and 4°C yielding a mitochondria-enriched pellet and a supernatant referred to as ‘S8’. The pellet was resuspended in 100 μL of SEM buffer per 15 cm dish (8 M urea/50 mM sodium phosphate [pH 8.0] in pSILAC experiments) and considered as crude mitochondrial fraction (cM). In spatial proteomics experiments, S8 was further separated into a cytosolic fraction (S100) and a microsomal fraction (P100) by centrifugation for 1 h at 100,000 x g and 4°C. The microsomal pellet was resuspended in SEM buffer. Of each subcellular fraction relevant for an experiment, aliquots were taken, snap-frozen in liquid nitrogen and stored at −80°C until further use.
To obtain mitochondrial fractions of higher purity (also referred to as ‘pM’), crude mitochondrial fractions, prepared from 12 confluent 15 cm dishes, were subjected to sucrose density gradient centrifugation. To this end, crude mitochondria were layered onto a sucrose step gradient consisting of 60%, 32%, 23%, 15% (w/v) sucrose dissolved in 10 mM MOPS/1 mM EDTA (pH 8.0). Following centrifugation for 1 h at 134,000 x g and 4°C, the mitochondrial fraction, accumulated at the interface between 60% and 32% sucrose, was recovered and diluted with the 2-fold volume of SEM buffer. Following a final centrifugation for 10 min at 8,000 x g and 4°C, the mitochondria-containing pellet was resuspended in 200 μL of SEM buffer, snap-frozen in liquid nitrogen and stored at −80°C until further use. In subtractive experiments, in which differences in protein abundance between crude and gradient-purified mitochondria were analyzed, equal amounts of cM and pM fractions prepared from differentially SILAC-labeled cells were mixed based on protein concentration.
For biochemical verification of the subcellular localization of mitochondrial proteins, HEK293T wildtype cells of four 15 cm cell culture dishes with a confluency of approximately 90% were used. Homogenization of the cells and preparation of ‘total’, S8 and mitochondria-enriched fractions was performed as described above. 25% of the ‘total’ fraction (1.75 mL) was removed and saved for further analysis. The mitochondria-enriched fraction was resuspended in 5 mL of SEM/PMSF and pottered again (manually, 10 strokes) and centrifuged for 10 min at 8,000 x g and 4°C. The pellet was resuspended in 800 μL of SEM/PMSF, loaded onto 2 mL of S500EM (500 mM sucrose, 1 mM EDTA, 10 mM MOPS-KOH pH 7.2), and centrifuged again. The pellet, representing the ‘crude mitochondrial fraction’ (cM), was resuspended in SEM/PMSF, and 2x SDS sample buffer containing 1.5% (v/v) β-mercaptoethanol (ME) was added to obtain a final protein concentration of 2 mg/mL. The S8 fraction was centrifuged for 10 min at 10,000 x g and 4°C, and the resulting supernatant was submitted to ultracentrifugation (100,000 x g, 1 h, 4°C), resulting in a microsomal (P100, pellet) and a cytosolic fraction (S100, supernatant). The P100 fraction was mixed with 2x SDS sample buffer/1.5% (v/v) ME to obtain the same volume as the cM fraction. Proteins of the ‘total’ and S100 fractions were precipitated using trichloroacetic acid (TCA). For this, 25% (v/v) of the sample volume of 50% (w/v) TCA was added to the samples followed by incubation on ice for 30 min. After centrifugation (20,000 x g, 10 min, 4°C), supernatants were discarded, the pellets were washed with ice-cold Tris base (1 M) and centrifuged again. The resulting pellets were resuspended in 2x SDS sample buffer/1.5% (v/v) ME. For the S100 fraction, the same volume was used as for the cM fraction; the ‘total’ fraction was resuspended in twice the volume. For analysis by SDS-PAGE, 25 μL of cM, P100 and S100 fractions and 50 μL of the ‘total’ fraction were loaded onto the gel. Western blot analysis with antibodies directed against mitochondrial marker proteins of complex I (NDUFA9), complex III (UQCRFS1), complex IV (COX4I), the mitochondrial membrane proteins TMEM141 and the outer membrane import receptor TOMM70 confirms an enrichment of mitochondria in the crude mitochondrial fraction. In contrast, the cytosolic glyceraldehyde-3-phosphate dehydrogenase (GAPDH) and the ER translocon subunit SEC61B are enriched in the S100 and the P100, respectively (see Figure 3C).
For the isolation of mitochondria used for the purification of mitochondrial protein complexes via FLAG affinity chromatography (except for TIM23FLAG complexes), BN-PAGE and measurements of oxygen consumption rates (OCR), cells were washed off from culture plates with DPBS and collected by centrifugation (100 x g, 5 min, 25°C). Cell pellets were frozen at −20°C before homogenization to increase cell breakage. Cells were washed with DPBS, pelleted by centrifugation (800 x g, 5 min, 4°C) and resuspended in 10 cell pellet volumes of buffer A (83 mM sucrose, 10 mM HEPES [pH 7.2], 1 mM PMSF). Homogenization was carried out using a drill-fitted glass-teflon potter (30 strokes at 2,400 rpm). An equal volume of buffer B (250 mM sucrose, 30 mM HEPES [pH 7.2], 1 mM PMSF) was added, unbroken cells, membrane debris and nucleic components were removed by centrifugation (1,000 x g, 10 min, 4°C), and supernatants were transferred to new microcentrifuge tubes. Mitochondria were pelleted by centrifugation (12,000 x g, 10 min, 4°C) and resuspended in an appropriate volume of buffer C (320 mM sucrose, 1 mM EDTA, 10 mM Tris-Cl pH 7.4). Cells expressing TIM23FLAG were harvested in PBS and pelleted (1,500 x g, 5 min, 4°C). Cell pellets were resuspended in trehalose-containing buffer (200 mM trehalose, 10 mM HEPES-KOH [pH 7.4], 0.1% [w/v] BSA) and homogenized in a drill-fitted glass-teflon potter (20 strokes, 800 rpm). Homogenates were cleared by centrifugation (400 x g, 10 min, 4°C) and the supernatants were collected. After further centrifugation (800 x g, 5 min, 4°C), mitochondria were pelleted (10,000 x g, 10 min, 4°C) and resuspended in an appropriate volume of trehalose buffer without BSA. Mitochondria were aliquoted and either snap-frozen in liquid nitrogen and stored at −80°C for future experiments or directly used for in vitro import experiments of radiolabeled precursor proteins.
Generation of plasmids
For expression of GFP-tagged proteins, plasmids were constructed using the pEGFP-N1 vector as background. As template for individual ORFs, either cDNA clones (Source BioScience) or synthesized genes (Eurofins) were used. Both, background and template, were linearized by PCR and ligation was performed using the Gibson Assembly Master Mix (New England BioLabs, Inc.) according to the manufacturer’s protocol. The correct sequence of constructs was verified by DNA sequencing.
For expression of FLAG-tagged proteins, the procedure was the same, using the vector pcDNA3.1(-) or pcDNA5/FRT/TO (for TMEM256) as background and introducing the FLAG-tag (DYKDDDDK) at the C terminus using suitable oligonucleotides.
For the knockout of genes via CRISPR/Cas9 genome editing, BbsI-digested pSpCas9(BB)-2A-GFP (PX458) vector (gift from Feng Zhang) was used and the target was introduced by ligation (Ran et al., 2013).
A list of all primers used in this study is provided in Table S7.
Transfection of cells
Transfection of HEK293T and Flip-In T-REx-293 cells was performed using TurboFect Transfection Reagent or Lipofectamine 2000 Transfection Reagent.
For CRISPR/Cas9 genome editing, HEK293T or Flip-In T-REx-293 cells were transfected in 6-well cell culture plates. Lipofectamine 2000 (2.5 μL) was mixed with 133.3 μL of incomplete DMEM (without any supplements) and incubated for 5 min at RT. DNA (1.67 μg) was mixed with 133.3 μL of incomplete DMEM. Both solutions were mixed and incubated for 20 min at RT. Adherent cells (∼90% confluent) were washed with DPBS and the medium was changed to DMEM without Pen-Strep. The Lipofectamine 2000-DNA mixture was added dropwise to the cells and equally distributed. Cells were incubated for 5 h (37°C, 5% CO2) and further processed as described below (see ‘Generation of CRISPR/Cas9 Knockout Cell Lines’).
To generate cell lines expressing FLAG-tagged proteins, HEK293T cells (confluency of approx. 80%–90%) were transfected in 15 cm cell culture dishes. DNA (37 μg) was mixed with 56 μL of TurboFect or 50 μl of GeneJuice in 1 mL of incomplete DMEM. Following incubation for 20 min at RT, the mixture was added dropwise to the cells and equally distributed. Cells were incubated for 5 h (37°C, 5% CO2), the medium was changed or 20 mL of standard DMEM was added (TMEM256FLAG cells) and cells were grown over night before cell harvest.
To generate cell lines expressing GFP-tagged proteins for fluorescence microscopy, HEK293T or U2OS cells were transfected in Lab-Tek Chambered Coverglass slides (2 chambers; ThermoFisher Scientific). Two days before transfection, cells were split and approx. 75,000 cells were seeded into each well of the 2-chamber slides. DNA (1.90 μg) was mixed with 2.86 μL of TurboFect or 5 μl of GeneJuice in 100 μL of incomplete DMEM. The mixture was incubated for 20 min at RT, added dropwise to the well and distributed equally. After 3 h of incubation (37°C, 5% CO2), the medium was changed or 2 mL of standard DMEM were added (TMEM256FLAG cells) and cells were grown over night until further use in fluorescence microscopy experiments (see ‘Fluorescence Microscopy’).
NCBP2-AS2MYC was transiently transfected in HEK293T cells using polyethylenimine (PEI) as transfection reagent. To do so, 100 μL PEI solution (1 mg/mL) were mixed with 400 μL OptiMEM and incubated at RT for 5 min. The mixture was diluted to a total volume of 5 mL with OptiMEM. Out of this PEI solution, 1 mL was mixed with 1 mL OptiMEM containing 25 μg plasmid DNA (for concomitant transfection of NCBP2-AS2MYC and PAM16FLAG, 25 μg of each plasmid were used). This mixture was incubated for 20 min at RT, 10 mL standard growth medium were added and the solution was transferred to a 15 cm-culturing dish. After 3 h incubation under standard conditions, 20 mL growth medium and 15 μL tetracycline (stock 1 mg/mL) were added. The cells were harvested after 24 h of culture.
For siRNA experiments targeting TMEM256, HEK293T cells were seeded 24 h prior to siRNA transfection. The siRNA construct (Eurogentec; see Key Resource Table) was used at a final concentration of 33 nM. Transfections were performed using Lipofectamine RNAiMAX (Invitrogen/Thermo Fisher Scientific) and following the reverse siRNA approach according to the manufacturer’s recommendation. Cells were cultured for 72 h prior to cell harvest and further analysis.
Generation of CRISPR/Cas9 knockout cell lines
Oligonucleotides (guide RNA, gRNA) that target the gene of interest were designed using CHOPCHOP(http://chopchop.cbu.uib.no/; Labun et al., 2019). Following phosphorylation of the oligonucleotides using T4 polynucleotide kinase and annealing, BbsI-digested pSpCas9 (BB)-2A-GFP vector was ligated with annealed oligonucleotides using T4 DNA ligase according to the manufacturer’s protocol. Correct ligation was verified by DNA sequencing. Following transfection and incubation (5 h, 37°C, 5% CO2) (see ‘Transfection of cells’) cells were washed off the cell culture plate with DPBS and washed once in DPBS. The cell pellet was resuspended in 1 mL of DPBS containing 2% FBS and subjected to single cell sorting via flow cytometry using the high speed cell sorters FACS Aria III or FACS Aria Fusion (Becton Dickinson), sorting for signal intensity of fluorescence by GFP. Single cells were seeded into 96-well cell culture plates and plates were manually monitored. When cell growth was visible, the cells were seeded into larger cell culture plates. When a sufficient number of cells (approx. 1.5E+10) were grown, they were stocked and the introduction of insertion or deletion (INDEL) into the gene of interest via non-homologous end joining was verified by PCR using oligonucleotides that flanked the gene. The blunt-ended PCR product was inserted into the Zero Blunt PCR Cloning Kit vector and a transformation of E. coli TOP10 was performed. To ensure that all alleles were covered, 10 - 15 different clones were picked. Plasmids were isolated using the QIAPrep Spin Miniprep Kit and sequenced.
Fluorescence microscopy
Fluorescence microscopy images were recorded using a DeltaVision Ultra High Resolution Microscope equipped with a UPlanSApo 100x/1.4 oil Olympus objective and a sCMOS pro.edge camera, operated at 37°C. For live cell imaging, MitoTracker Red CMXRos was added to the cells to a final concentration of 200 nM. After 30 min of incubation at growth conditions, medium was changed and cells were grown for 1 h. To detect colocalization of GFP-tagged proteins with stained mitochondria, Z stacks with optical section spacing of 0.20 μm for 3-4 μm sample thickness (15 or 20 optical sections per image per sample) were taken. Raw fluorescence microscopy images were deconvolved at the DeltaVision microscope using the SoftWorx deconvolution plugin. All deconvolved images were analyzed with ImageJ/Fiji software.
To analyze the mitochondrial localization of TMEM256FLAG, MitoTracker Red was added as described above and cells were further cultured for 5 min under normal growth conditions. Afterward, the cells were fixed by incubation in 4% (w/v) paraformaldehyde for 20 min at 37°C and subsequently permeabilized with 0.2% (v/v) Triton X-100. To prevent unspecific antibody binding, cells were blocked with 1% (w/v) BSA, followed by incubation with anti-FLAG antibodies for 1 h at RT. Cells were washed and the secondary antibody (anti-mouse Alexa Fluor 488) was added for 1 h at RT. Images were taken as described above.
In vitro import of radiolabeled precursor proteins
Transcription of open reading frames was carried out using the mMESSAGE mMACHINE SP6 Transcription Kit. Subsequently, RNA was purified using the MEGAclear Transcription Clean-UP kit. For cell-free expression of individual precursor proteins, RNA was added to the TnT® Quick Coupled Reticulocyte Lysate or Flexi® Rabbit Reticulocyte Lysate System. For import of [35S]ATPC1, [35S]C5orf63, [35S]COX4I, [35S]Su9-DHFR, [35S]DHRS4, [35S]DHRS4L2, [35S]NOCT, [35S]NT5C3A, and [35S]OXLD1, freshly isolated mitochondria were resuspended in import buffer (250 mM sucrose, 5 mM magnesium acetate, 80 mM potassium acetate, 10 mM sodium acetate, 20 mM HEPES- KOH [pH 7.4], 1 mM DTT, 5 mM ATP). To dissipate the membrane potential prior to the import reaction (-Δψ control) 1 μM valinomycin, 8 μM antimycin A and 20 μM oligomycin were added. The import reaction was started by adding 10% (v/v) of precursor protein-containing lysate. Import was stopped after indicated time points by dissipation of the membrane potential (addition of 1 μM valinomycin, 8 μM antimycin A, and 20 μM oligomycin). Where indicated, samples were subjected to proteinase K treatment (final concentration 20 μg/mL) and subsequently mitochondria were reisolated by centrifugation. To analyze mitochondrial protein import, mitochondria were washed with 200 μL of either import or SEM buffer (in the latter followed by a washing step using S500EM buffer containing 500 mM sucrose), pelleted and resuspended in 2x SDS sample buffer containing 10-20 mM DTT, followed by SDS-PAGE and digital autoradiography.
Oxygen consumption rate measurements
OCR was measured using the Agilent Seahorse XFe96 extracellular flux analyzer. Twenty thousand cells per well were seeded in XF96 cell culture plates coated with poly-D-lysine. Cells were incubated over night at 37°C with 5% CO2. Before the assay, cells were washed twice with 200 μL XF base media (unbuffered DMEM supplemented with 2 mM L-glutamine, 11 mM glucose, 1 mM sodium pyruvate [pH 7.4]) and equilibrated for 1 h at 37°C without CO2. The OCR was measured using the following inhibitors: 2 μM oligomycin, 0.9 μM carbonyl cyanide 4-(trifluoromethoxy)phenylhydrazone (FCCP), and 1 μM rotenone with 1 μM antimycin A. For each condition (basal and after each inhibitor injection), cycles were performed in triplicate with 3 min mixing followed by 3 min measurement. After completion of the assay, the protein content per well was determined using the Bradford assay (Roti-Quant). Absorption was measured at 595 nm using a CLARIOstar plate reader (BMG Labtech). The OCR was normalized to the protein content for each well.
Complex I enzyme activity assay
Complex I enzyme activity was determined using the Complex I Enzyme Activity Microplate Assay Kit (Colorimetric) according to the manufacturer’s protocol. Triplicates of each cell line were measured using 10, 20 and 40 μg of mitochondria (protein amount).
Carbonate extraction and sonication assay
Gradient-purified mitochondria (150 μg protein per treatment and replicate, 1.5 mg/mL) were either diluted with 100 μL of 200 mM sodium carbonate (carbonate assay) or with 100 μL of SEM buffer (sonication assay). Samples of the carbonate assay were incubated on ice for 30 min. For the sonication assay, samples were subjected to 30 sonication pulses in 30 s using a sonotrode prior to incubation on ice for 30 min. All samples were subsequently centrifuged for 1 h at 100,000 x g and 4°C. Supernatants were collected and proteins were precipitated by adding the four-fold volume of ice-cold acetone. Pellets of the 100,000 x g centrifugation and acetone-precipitated proteins of the supernatants were resuspended in 100 μL of 8 M urea/50 mM sodium phosphate buffer (pH 8.0) for subsequent determination of protein concentrations and tryptic in-solution digestion.
Affinity purification of mitochondrial protein complexes
For the analysis of C22orf39, LYRM9, MBLAC2, NCBP2-AS2, NTPCR, and PIGBOS1 complexes by quantitative affinity purification-mass spectrometry (q-AP-MS), mitochondria were isolated from differentially SILAC-labeled cells expressing FLAG-tagged variants of the proteins and corresponding control cells. For each purification, one milligram of mitochondria was pelleted by centrifugation (20,000 x g, 10 min, 4°C), resuspended in 1 mL of solubilization buffer (40 mM Tris-HCl [pH 7.4], 0.5 mM EDTA, 20% [v/v] glycerol, 1% [w/v] digitonin, 1 mM PMSF) containing 60 mM NaCl by gentle pipetting and incubated end over end for 30 min at 4°C. Solubilized mitochondria were centrifuged (20,000 x g, 10 min, 4°C) to remove insoluble material and a 50 μL-aliquot of the supernatant was taken (‘load’). Anti-FLAG M2 Affinity Gel (80 μL) was washed three times with solubilization buffer without digitonin using filter columns (Mobicols, MoBiTec). Buffer was removed by centrifugation (50 x g, 1 min, 4°C). Anti-FLAG beads were resuspended with the remaining mitochondrial supernatant and incubated end over end for 2 h at 4°C. Beads were collected by centrifugation (50 x g, 1 min, 4°C), washed twice each with 500 μL of solubilization buffer containing 150 mM NaCl and 500 μL of solubilization buffer containing 200 mM NaCl. Elution was performed by mixing the anti-FLAG beads with 100 μL of 200 μg/mL FLAG peptide in elution buffer (20 mM Tris pH [7.4], 0.5 mM EDTA, 10% [v/v] glycerol, 0.1% [w/v] digitonin, 60 mM NaCl) and incubated for 30 min at 4°C and 1,000 rpm in a thermomixer. The eluate was collected by centrifugation (400 x g, 2 min, 4°C), another 50 μL of elution buffer were added and collected, and both eluates were pooled. Equal volumes (90 μL) of eluates obtained from mitochondria harboring FLAG-tagged proteins and from control mitochondria were mixed and analyzed by LC-MS.
For the analysis of TMEM256FLAG and TIM23FLAG complexes, transiently transfected HEK293 cells (Figure 6I, 4 mg) or isolated mitochondria (Figure 6J, 1 mg; Figures 6H and 6K, 2 mg) were solubilized in 750 μL of lysis buffer (40 mM Tris/HCl [pH 7.4], 160 mM NaCl, 10% [v/v] glycerol, 0.25 mM EDTA, 1% [w/v] digitonin, 2 mM PMSF) by shaking for 30 min at 4°C. Debris was removed by centrifugation (14,000 x g, 10 min, 4°C), the supernatant was collected, and an aliquot was saved as ‘load’. Anti-FLAG M2 Affinity Gel (100 μL) was transferred to Mobicols and equilibrated by adding three times 500 μL of wash buffer (40 mM Tris/HCl [pH 7.4], 160 mM NaCl, 10% [v/c] glycerol, 0.25 mM EDTA, 0.5% [w/v] digitonin, 2 mM PMSF) and centrifugation (100 x g, 2 min). Supernatants and beads were mixed and incubated for 2 h at 4°C with rotation. After binding of the proteins, the beads were washed ten times with high salt wash buffer (see above) and five times with low salt wash buffer (same composition as high salt buffer containing 50 mM NaCl). Bound proteins were either eluted by adding 50 μL of 0.1 M glycine (pH 2.8) and shaking for 5 min at 37°C (Figures 6I and 6J) or by competition with 40 μg of FLAG peptide in 100 μL low salt wash buffer, shaking for 30 min at 4°C. Eluates were either subjected to q-AP-MS, western blot analysis or 2D-BN/SDS-PAGE.
Blue native PAGE
For complexome profiling of mitochondria from wildtype cells (n = 2) and the LYRM9KO-versus-control experiment, mitochondria (500 μg protein) were solubilized in 400 μL of solubilization buffer (20 mM Tris-HCl [pH 7.4], 0.1 mM EDTA, 50 mM NaCl, 10% [v/v] glycerol, 1% [w/v] digitonin, 1 mM PMSF). After incubation on ice for 15 min, insoluble material was removed by centrifugation for 10 min at 20,000 x g and 4°C. 40 μL of blue native loading dye (100 mM BisTris-HCl [pH 7.0], 50 mM ε-amino n-caproic acid, 0.5% [w/v] Coomassie G-250) were added to the supernatant. Samples were subjected to BN-PAGE using 3.5%–13% discontinuous polyacrylamide gels. Gel lanes were cut into 116 and 114 slices of equal size (replicates 1 and 2 of mitochondria from wildtype cells, respectively) or into 45 slices (LYRM9KO-versus-control), followed by tryptic in-gel digestion of proteins. To analyze TIM23FLAG complexes by BN-2D-PAGE, eluates of the FLAG-affinity purification were mixed with 10 μL of blue native loading dye and subjected to BN-PAGE using a 4%–13% discontinuous polyacrylamide gel. For 2D-BN/SDS-PAGE analysis, relevant lanes were cut out of the BN gel and proteins were further separated using a 10%–18% Tris-Tricine gel.
Tryptic in-gel digestion
Gel slices of BN gels were incubated for 10 min in 10 mM ammonium bicarbonate (ABC) followed by incubation in 5 mM ABC/50% (v/v) ethanol for 10 min at RT to dehydrate the gel slices. This alternating incubation with 10 mM ABC and 5 mM ABC/50% ethanol was performed three times. Cysteine residues were reduced by incubation in 5 mM tris(2-carboxyethyl)-phosphine (TCEP; dissolved in 10 mM ABC; 10 min at 60°C). Thiol groups were subsequently alkylated by incubating the gel slices in 100 mM chloroacetamide (dissolved in 10 mM ABC; 15 min at 37°C). Gel slices were thoroughly washed by three cycles of alternating incubation with 10 mM ABC and 100% ethanol (10 min at RT each) and dried in vacuo. Proteins were digested with trypsin (100 ng trypsin in 10 mM ABC per slice; overnight, 37°C) and eluted by incubation in 0.05% (v/v) trifluoroacetic acid (TFA)/50% (v/v) acetonitrile (ACN) in an ultrasonic bath (10 min, 4°C). This step was performed twice. Peptide-containing supernatants of each sample were pooled, peptides were dried in vacuo and desalted using StageTips (Rappsilber et al., 2007).
Proteins of affinity-purified mitochondrial protein complexes were acetone-precipitated, resuspended in 1x SDS sample buffer and loaded onto 4%–12% NuPAGE BisTris gradient gels. Gels were run for 10 min at 150 V until the proteins had migrated into the top of the gel (approx. 1 cm). Following staining with Colloidal Coomassie Blue, protein-containing sections of the gel were excised en bloc and cut into approximately 1-mm3 cubes. Samples were further processed as described above using 300 ng of trypsin per sample for proteolytic digestion.
Proteolytic in-solution digestion
Prior to proteolytic in-solution digestion, proteins of subtractive and importomics experiments as well as affinity-purified TMEM256 complexes were precipitated using acetone and resuspended in 8 M urea/50 mM ABC; crude mitochondrial fractions of pSILAC experiments were resuspended in 8 M urea/50 mM ABC; and samples of spatial proteomics experiments were adjusted to 8 M urea/50 mM ABC by directly adding the required amounts of the chemicals. To reduce and alkylate cysteine residues, proteins were incubated in 5 mM TCEP (dissolved in 10 mM ABC; 30 min at 37°C) followed by incubation in 55 mM iodoacetamide/10 mM ABC (45 min at RT in the dark). The alkylation reaction was quenched by adding DTT to a final concentration of 25 mM. Subsequently, samples were diluted by adding 50 mM ABC to a final concentration of 4 M urea for digestion with LysC and 1 M urea for digestion with trypsin, chymotrypsin, AspN or GluC. Samples of carbonate/sonication assays were diluted to 1 M urea using 50 mM sodium phosphate buffer (pH 8.0). Trypsin was added at a protease-to-protein ratio of 1/50, all other proteases at a ratio of 1/100. Digestion was performed over night at 37°C, except when LysC was used (4 h, 37°C). To stop proteolytic reactions, samples were acidified by the addition of TFA to a final concentration of 1% (v/v), except for tryptic digests from carbonate/sonication assays, which were directly used for stable isotope dimethyl labeling.
High pH reversed-phase liquid chromatography
Acidified peptide mixtures of subtractive proteomics, spatial proteomics, TOMM40 importomics and pSILAC experiments of HEK cells (starting material: proteolytic digest from 300 μg of protein) were desalted using C18-SD 7 mm/3 mL extraction disc cartridges. Cartridges were conditioned by consecutively adding 1 mL of 100% methanol, 0.5 mL of 70% (v/v) ACN/0.1% (v/v) TFA and 0.5 mL of 0.1% (v/v) TFA, each applied by centrifugation for 1 min at 75 x g. Peptides were then loaded onto conditioned cartridges by centrifugation (1 min, 75 x g) until the cartridges were empty, washed once with 0.5 mL of 0.1% (v/v) TFA and eluted with 0.5 mL of 70% (v/v) ACN/0.1% (v/v) TFA. Eluates were dried in vacuo. Subsequent peptide fractionation by high pH RP-LC (Delmotte et al., 2007) was performed essentially as described before (Peikert et al., 2017) with slight modifications. Dried peptides were reconstituted in 100 - 200 μL of 1% (v/v) ACN/10 mM NH4OH (pH 10) by sonication in an ultrasonic bath for 5 min. Insoluble material was removed by centrifugation (12,000 x g, 5 min, RT). Supernatants were filtered through a 0.2 μm PTFE membrane syringe filter before separation of the peptides using an Ultimate 3000 HPLC system equipped with an NX 3u Gemini C18 column (150 mm x 2 mm, particle size 3 μM, pore size 110 Å) and operated at 40°C with a flow rate of 200 μL/min. For elution, a binary solvent system consisting of 10 mM NH4OH (solvent A) and 90% (v/v) ACN/10 mM NH4OH (solvent B) was used. In all experiments, peptides were loaded at 1% B for 5 min and then separated by increasing concentrations of solvent B. Solvent gradients and fractionation strategies applied in individual experiment were slightly different. In large-scale subtractive proteomics and TOMM40 importomics experiments, peptides were eluted with 1 - 61% B in 55 min and 61 - 78% B in 2 min. The concentration of B was then kept constant for 3 min before the column was re-equilibrated with 1% B. Fractions were collected from min 1.5 to min 70.2 in 43 s intervals and concatenated into 32 fractions per sample. In pSILAC experiments of HEK cells, the same solvent gradient was used. Fractions were collected from min 1.5 to min 70.2 in 60 s intervals and concatenated into 8 fractions per sample. The solvent gradient applied in spatial and multiple cell line subtractive proteomics experiments was as follows: 1 - 40% B in 37 min, 40 - 78% B in 3 min, 5 min at 78% B. Fractions were collected from min 1.5 to 65.5 in 45 s intervals and concatenated into 16 fractions per sample. Peptides were dried in vacuo (subtractive and importomics experiments) or lyophilized (spatial proteomics and pSILAC experiments) and stored at −80°C. Prior to LC-MS analysis, peptides were washed once with 86% (v/v) ACN/01% (v/v) formic acid (FA), dried in vacuo and resuspended in 0.1% (v/v) TFA. Peptides of spatial proteomics experiments were desalted using StageTips (Rappsilber et al., 2007). Aliquots corresponding to an initial protein concentration of 2 - 3 μg were analyzed by LC-MS.
Stable isotope dimethyl labeling of peptides
Tryptic peptides of samples derived from soluble and corresponding insoluble fractions of carbonate and sonication assays were differentially labeled using peptide stable isotope dimethyl labeling as described previously (Peikert et al., 2017) with slight modifications. In brief, for ‘light’ labeling, tryptic digests were mixed with 4% (v/v) formaldehyde (CH2O; 0.15% final concentration) and 0.6 M sodium cyanoborohydride (NaBH3CN; 23 mM final concentration) and incubated for 1 h at 20°C and 800 rpm. For ‘heavy’ labeling, 13C- and deuterium-containing formaldehyde (13CD2O) was used instead of the light variant. The labeling efficiency, determined by LC-MS analysis, was in the range of 90 - 99%. Equal volumes of differentially labeled peptides originating from a soluble and the corresponding insoluble fraction were mixed. The labeling reaction was quenched by adding 1% (v/v) ammonia to a final concentration of 0.13% (v/v), peptides were acidified by adding FA (1% [v/v] final concentration) and desalted and fractionated using StageTips (Rappsilber et al., 2007).
Fractionation of peptides using stagetips
Stable isotope dimethyl-labeled peptide mixtures derived from carbonate/sonication assays (corresponding to 20 μg of protein per sample) as well as tryptic peptides of TOMM70 importomics (16 - 40 μg of protein per replicate) and Huh7 pSILAC experiments (15 μg of protein per replicate) were fractionated using StageTips (Rappsilber et al., 2007). For fractionation of dimethyl-labeled peptides, C18 material punched out from C18 extraction disks was conditioned with 100% methanol, equilibrated with 30 μL of 90% (v/v) ACN/10 mM NH4OH and washed twice with 30 μL of 10 mM NH4OH. Peptides were loaded, washed twice with 30 μL of 10 mM NH4OH and eluted stepwise with 0%, 3%, 5%, 8%, 12%, 16%, 20% and 72% (v/v) ACN in 10 mM NH4OH (30 μL each). For fractionation of peptides from TOMM70 importomics and Huh7 pSILAC experiments, methanol-conditioned C18 material was equilibrated with 80% (v/v) ACN/0.5% (v/v) acetic acid, washed with 0.5% (v/v) acetic acid, and peptides were eluted with 0%, 2.7%, 5.4%, 9%, 11.7%, 14.4%, 22.5% and 64.8% (v/v) ACN in 10 mM NH4OH (20 μL each). For the analysis of peptides from Huh7 pSILAC experiments, the following fractions were combined: 0% and 14.4%, 2.7% and 22.5%, 5.4% and 64.8%. Solvents and peptides were applied by centrifugation for 1 - 2 min (or until column was dry) at 800 x g. Fractionated peptides were dried in vacuo and stored at −80°C. Prior to LC-MS analysis, peptides were resuspended in 23 μL (carbonate/sonication assays) or 45 μL/10 μg protein (TOMM70 importomics) of 0.1% (v/v) TFA, of which 20 μL were used for LC-MS analysis. Dried peptides from Huh7 pSILAC experiments were resuspended in 35 μL of 0.1% (v/v) TFA, of which 15 μL were used for LC-MS analysis.
LC-MS analysis
Nano-HPLC-ESI-MS/MS analyses were performed at an Orbitrap Elite or a Q Exactive Plus mass spectrometer (Thermo Fisher Scientific, Bremen, Germany) directly connected to UltiMate 3000 RSLCnano HPLC systems (Thermo Fisher Scientific, Dreieich, Germany). For the analysis at the Orbitrap Elite (i.e., samples of large-scale subtractive proteomics, spatial proteomics, importomics, carbonate/sonication, replicate 1 of complexome profiling, q-AP-MS, and pSILAC of HEK cells experiments), the RSLC system was equipped with PepMap C18 precolumns (length, 5 mm; inner diameter, 0.3 mm; flow rate, 30 μL/min; Thermo Scientific) and an Acclaim™ PepMap C18 reversed-phase nano LC column (length, 500 mm; inner diameter, 75 μm; particle size, 2 μm; packing density, 100 Å; flowrate, 250 nL/min; Thermo Scientific). Peptides were separated using a binary solvent system consisting of 4% (v/v) dimethyl sulfoxide (DMSO)/0.1% (v/v) FA (solvent A) and 30% (v/v) ACN/48% (v/v) methanol/4% (v/v) DMSO/0.1% (v/v) FA (solvent B). Peptides were loaded for 5 min at the initial gradient concentration of solvent B and then separated by increasing concentrations of solvent B. LC gradients differed in length and slope between experiments depending on the complexity of individual samples. The following gradients were applied: 1 - 65% solvent B in 50 min followed by 65 - 95% B in 5 min and 5 min at 95% B for high pH RP-LC fractions obtained in subtractive proteomics experiments; 1 - 65% B in 60 min, 65 - 95% B in 5 min, 3 min at 95% B (spatial proteomics); 3 - 70% B in 50 min, 70 - 95% B in 5 min, 3 min at 95% B (TOMM40 and TOMM70 importomics); 3 - 55% B in 120 min, 55 - 95% B in 30 min, 5 min at 90% B (carbonate/sonication); 3 - 65% B in 30 min, 65 - 80% B in 5 min, 3 min at 80% B (complexome profiling); 3 - 55% B in 120 min, 55 - 95% B in 30 min, 5 min at 95% B (q-AP-MS experiments of MBLAC2 and NCBP2-AS2); 7 - 55% B in 120 min, 55 - 95% B in 30 min, 5 min at 95% B (q-AP-MS of PIGBOS1, NTPCR, LYRM9 and C22orf39); 3 - 25% B in 95 min, 25 - 60% B in 100 min, 60 - 95% B in 15 min, 5 min at 95% B (q-AP-MS of TMEM256); 1 - 45% B in 115 min, 45 - 70% B in 35 min, 70 - 99% B in 5 min, 5 min at 99% B (pSILAC). For the analysis of peptide mixtures obtained in small-scale subtractive proteomics, LYRM9KO-versus-control, and Huh7 pSILAC experiments, the RSLCnano system was equipped with nanoEase M/Z Symmetry C18 precolumns (length, 20 mm; inner diameter, 0.18 mm; flow rate, 10 μL/min; Waters) and a nanoEase M/Z HSS C18 T3 column (length, 250 mm; inner diameter, 75 μm; particle size, 1.8 μm; packing density, 100 Å; flowrate, 300 nL/min; Waters). The solvent system consisted of 0.1% (v/v) FA (solvent A) and 30% (v/v) ACN/50% (v/v) methanol/0.1% (v/v) FA (solvent B). Peptides were loaded for 5 min at 7% solvent B and eluted using the following gradients: 7 - 55% B in 120 min, 55 - 95% B in 30 min, 5 min at 95% B (small-scale subtractive proteomics experiments), 7 - 70% B in 50 min, 70 - 95% B in 5 min, 3 min at 95% B (LYRM9KO-versus-control), or 7 - 60% B in 195 min, 60 - 95% B in 15 min, 5 min at 95% B (Huh7 pSILAC). The RSLCnano system coupled to the Q Exactive, used to analyze replicate 2 of the complexome profiling experiment, was equipped with PepMap C18 precolumns and an Acclaim™ PepMap C18 analytical column as specified above. The solvent system used was 0.1% (v/v) FA (solvent A) and 86% (v/v) ACN/0.1% (v/v) FA (solvent B). Peptides were loaded for 5 min at 4% B and eluted with 4 - 40% B in 30 min, 40 - 95% B in 5 min, and 5 min at 95% B.
Peptides eluting from the LC column were transferred to a stainless steel emitter (Thermo Scientific; Elite) or a fused silica emitter (PicoTip, New Objectives; Q Exactive) for electrospray ionisation using a Nanospray Flex ion source with DirectJunction™ adaptor (Thermo Scientific) and applying a spray voltage of 1.8 kV (Elite) or 1.5 kV (Q Exactive) and a capillary temperature of 200°C.
Mass spectrometric data were acquired in data-dependent mode. Parameters for measurements at the Oritrap Elite were as follows: mass range of m/z 370 to 1,700; resolution of 120,000 at m/z 400; target value of 1 × 10⁶; maximum injection time of 200 ms for MS survey scans. The most intense precursor ions with a charge ≥ +2 (up to 12 for TOMM70 importomics experiments; up to 15 for mitochondrial complexome profiling and LYRM9KO-versus-control experiments; up to 20 for large-scale subtractive experiments; up to 25 for all other experiments) were selected for low energy collision-induced dissociation in the linear ion trap applying a normalized collision energy (NCE) of 35%, an activation q of 0.25, an activation time of 10 ms, a target value of 5,000, a maximum injection time of 150 ms, and a dynamic exclusion time of 45 s. For measurements at the Q Exactive, parameters were set to a mass range of m/z 375 to 1,700; resolution of 70,000 at m/z 200; target value of 3 × 10⁶; maximum injection time of 60 ms for MS survey scans; TOP12 method for higher-energy collisional dissociation of multiply charged precursor ions; NCE of 28%; target value of 1 × 10⁵, maximum injection time of 120 ms; dynamic exclusion time of 45 s.
Mass spectrometric data analysis
Mass spectrometric raw data of the following experiments were jointly processed using MaxQuant v.1.6.0.1 (Cox and Mann, 2008): subtractive proteomics (large-scale), spatial proteomics, TOMM40 importomics, carbonate/sonication, and pSILAC experiments of HeLa cells. For peptide and protein identification, mass spectra were correlated with the Uniprot human proteome set including isoforms (retrieved 08/2018; 95,106 entries) and a list of common contaminants provided by MaxQuant using Andromeda (Cox et al., 2011). Database searches were performed with a mass tolerance of 4.5 ppm for precursor ions and 0.5 Da for fragment ions, carbamidomethylation of cysteine as fixed and oxidation of methionine and N-terminal acetylation as variable modifications. To account for differences in the workflows of the individual experiments, different parameter groups with group-specific parameters were defined. For group 0 (containing data of subtractive and importomics experiments), Arg10 and Lys8 were selected as heavy labels, multiplicity was set to 2, Trypsin/P was selected as enzymatic specificity, a maximum of 3 missed cleavages was allowed, and the option ‘requantify’ was enabled. For groups 1 - 3 (subtractive proteomics data), specific parameters were the same as for group 0 except that enzymatic specificity and maximum missed cleavage sites were chymotrypsin+/4 missed cleaveages (group 1), AspN/2 missed cleavages (group 2), and GluC_DE (cleavage after D and E)/4 missed cleaveages (group 3). Data in group 4 (subcellular profiling experiments) were searched with Trypsin/P and a maximum of 3 missed cleavage sites. For group 5 (pSILAC data), specific parameters were Arg10/Lys8 and Arg6/Lys4 as heavy and medium-heavy labels, multiplicity of 3, Trypsin/P, maximum of missed cleavages of 3, and option ‘requantify’ enabled. Group-specific parameters for group 7 (carbonate/sonication assays) were DimethLys0/DimethNter0 as light and DimethLys6/DimethNter6 as heavy labels, multiplicity of 2, Trypsin/P, maximum of 3 missed cleavages, and ‘requantify’ enabled. Proteins were identified based on ≥ 1 unique peptide with a length of ≥ 6 amino acids across all experiments. The options ‘match between runs’ (defined in a way that allowed for matching within parameter groups only) and ‘iBAQ’ were enabled. A peptide spectrum match (‘PSM’) false discovery rate (FDR) of 1% was applied using the decoy mode ‘Revert’. An FDR of 1% was further applied to the list of proteins identified. Separate MaxQuant analyses, using the same MaxQuant version and general settings as described above, were performed for the following sets of experiments: (i) TOMM70 importomics and q-AP-MS experiments (see parameter group 0 for experiment-specific settings), (ii) multiple cell line subtractive proteomics (group 0), complexome profiling (group 4), and LYRM9KO-versus-control (group 4) experiments, and (iii) pSILAC experiments of Huh7 cells (group 0). For processing of the data in (ii) and (iii), raw data of the large-scale subtractive proteomics experiment were included to compare the data obtained in multiple cell line subtractive proteomics experiments with the large-scale subtractive dataset from HEK293T cells (ii) and to support peptide identification (iii). Lists of proteins identified and quantified in individual experiments are provided in Tables S1-S6.
Criteria for disease gene classification
Genes coding for MitoCoP proteins as defined in this study (see ‘Definition of the Human Mitochondrial High-Confidence Proteome’), referred to as ‘MitoCoP disease genes’ were mainly identified through UniProt and Frazier et al., 2019. The ‘Online Mendelian Inheritance in Man’ (OMIM) database was used to assess the clinical phenotypes associated with nuclear encoded MitoCoP disease genes and the human mitochondrial genome (MITOMAP) database for the mtDNA-encoded MitoCoP genes. In some cases, the search was expanded by the analysis of additional clinical reports reported in the literature and present in PubMed. Only clinical reports with a clear genetic diagnosis have been evaluated, and for each disease gene, we report, if possible, the clinical findings described in at least two clinical reports. Thus, we report all the potential symptoms associated with a gene in order to reflect as accurately as possible the high heterogeneity typical for mitochondrial diseases. Each major and minor clinical finding, reported in the analyzed clinical reports, has been taken in account and classified in accordance with the criteria specified below (see also Table S1):
| Organ system involved | Specific findings |
| Central nervous system | Cognitive impairment, psychomotor regression, speech disorders, apraxia, pyramidal signs, spasticity, hyperreflexia, nystagmus, dystonia, impaired postural control, (cortical) blindness, ataxia, stroke like episodes, epilepsy, myoclonic jerks, parkinsonian syndrome, choreoathetosis, neuropsychiatric symptoms (depression, autism, aggressivity, etc.), (leuko-)encephalopathy, basal ganglia lesions, cerebral atrophy, motor neuron disease, congenital abnormalities (macro-/microcephaly, agenesis of the corpus callosum, polygyria, microgyria, etc.) |
| Peripheral nervous system | Sensory and/or motor polyneuropathy, dysautonomia |
| Congenital anomalies and dysmorphisms, intrauterine abnormalities | Dysmorphisms (polydactyly, brachydactyly, micro/-retrognathia, cleft lip/palate, high arched palate, supernumerary nipples, etc.), congenital organ malformations, arthrogryposis, cryptorchidism, micropenis, embryonic development problems, intrauterine growth restriction |
| Metabolism | Lactic acidosis and other organic acids abnormalities (amino acids, fatty acids, etc.), hyperammonemia, electrolyte imbalance, hypoglycemia, diabetes mellitus, disorders of iron metabolism |
| Endocrine system | Adrenal insufficiency or hyperfunction, adrenal hypo-/hyperplasia, hypogonadism, pancreatic failure, growth hormone deficiency, hyperinsulinemia, diabetes mellitus, hyper-/hypoparathyroidism, gynecomastia |
| Muscular system | Myopathy, exercise intolerance, cramps, rhabdomyolysis, myoglobinuria, presence of ragged red fibers, lipid myopathy, congenital myasthenic syndrome (neuromuscular disorder) |
| Cardiovascular system | Cardiomyopathy, cardiac fibrosis, cardiac conduction defects, cardiomegaly, valvulopathy, heart rhythm disorders, heart failure, arterial hypo-/hypertension, pulmonary hypertension |
| Ears | Sensorineural hearing loss, hypoacusis |
| Ophthalmic system | Cataract, myopia, optic neuropathy, optic nerve atrophy, optic nerve hypo-/dysplasia, amblyopia, retinitis pigmentosa, gyrate atrophy of choroid and retina, extraocular muscles disorders (opthalmoplegia, ptosis, strabismus) |
| Kidney and urinary tract | Renal tubular dysfunctions, renal insufficiency, glomerulosclerosis, nephro-/urolithiasis, ectopic kidney, kidney dysplasia, nephrocalcinosis, polyuria, hematuria, bladder dysfunction |
| Liver | Hepatopathy, hepatomegaly, hepatic fibrosis, non-alcoholic fatty liver (NAFLD), liver failure, high transaminases, hyperbilirubinemia, jaundice |
| Hematologic system | Microcytic hypochromic anemia, hemolytic anemia, sideroblastic anemia, neutropenia, thrombocytopenia, pancytopenia, dyserythropoietic anemia, macrocytic anemia, acanthocytosis, reticular dysgenesis, basophilic stippling, Lan(-) blood group, hypogammaglobulinemia, altered immunoglobulin concentration, immunoglobulin class-switch recombination deficiency (Ig-CSR-D), coagulopathy |
| Integumentary system | Lipomatosis, lentigines, eczema, linear skin defects, photosensitivity, blistering, erythrodermia, rash, hyperpigmentation, hair abnormalities, erythematous bullous skin lesions, café au lait patches, petechiae, livedo reticularis, lipodystrophy |
| Skeletal system | Skeletal dysplasia, hyperostosis of the skull, pes cavus, scoliosis, pectus carinatum, high-arched palate, camptodactyly, dental defects, osteochondroma and enchondroma formation, low bone mineral density, metaphyseal dysplasia, contractures, tendon xanthomas, distal acroosteolysis |
| Gastrointestinal system | Recurrent vomiting/diarrhea, gastresophageal reflux, dysphagia, type II achalasia of the esophagus, pancreatitis, exocrine pancreatic insufficiency, gallstones, steatorrhea, intestinal obstruction, paralytic ileus |
| Pulmonary system | Respiratory failure, respiratory distress, apnea, tachypnea, cyanosis, hypercarbia (respiratory alkalosis), asthma, pulmonary hypertension |
| Reproductive system | Infertility, primary/secondary amenorrhea, lack of secondary sexual characterization, gonadal dysgenesis, genital dysgenesis, precocious puberty |
| Tumors | Leukemia, myelodysplastic syndrome, breast neoplasms, lung carcinoma, kidney carcinoma, papillary thyroid carcinoma, paraganglioma, gastrointestinal stromal tumors, pituitary adenoma, endometrial adenocarcinoma, sebaceous carcinoma, colonic adenoma, colorectal carcinoma, gastric carcinoma, pheochromocytoma, Leydig cell tumor of testis |
| Failure to thrive | Failure to thrive, infantile poor growth, poor feeding, poor suck |
| Others | Fever, recurrent infections, pregnancy complications (mother), splenomegaly, short stature, abnormal odor, rheumatoid arthritis, hypo-/hyperthermia |
Miscellaneous
SDS-PAGE and western blotting were performed according to standard protocols. Panels cut by digital processing for different lane order or exposures are indicated by separating lines. Antibodies used are listed in the Key Resource Table.
Quantification and statistical analysis
Human mitochondrial and non-mitochondrial assessment proteins
To assess the quality of our complementary datasets generated by quantitative MS, to perform classifications of individual datasets, and to determine significance thresholds, we defined test sets for mitochondrial and non-mitochondrial human proteins. These test sets were based on protein lists provided by the ‘Integrated Mitochondrial Protein Index’ (IMPI), available via the MitoMiner database (http://mitominer.mrc-mbu.cam.ac.uk; IMPI version Q2 2018; Smith and Robinson, 2009, 2019). To report test sets of high reliability, we only included IMPI entries for known mitochondrial and non-mitochondrial proteins, i.e., mitochondrial proteins annotated as ‘predicted’ in IMPI were not considered. See Table S2 for lists of mitochondrial and non-mitochondrial test proteins.
Classification of proteins identified in subtractive proteomics experiments
Dataset obtained from HEK cells (n = 4): Proteins quantified in ≥ 3/4 replicates of subtractive proteomics experiments (i.e., 7,696) were classified based on non-normalized pM/cM SILAC ratios as calculated by MaxQuant. Determination of turning points (i.e., maxima and minima) of the distribution of log2-transformed ratios revealed two local maxima for each replicate, one at log2 pM/cM < 0 and the other one at log2 pM/cM > 0 with individual values of 1.67 for replicate 1, 0.53 for replicate 2, 1.58 for replicate 3, and 0.52 for replicate 4. Since the majority of mitochondrial proteins can be expected to be enriched in gradient-purified mitochondria compared to crude mitochondrial fractions, we assumed that the distribution with the maximum at log2 pM/cM > 0 represents mainly ratios of mitochondrial proteins (in the following referred to as ‘mitochondrial distribution’). To correct for the differences in local maxima observed for the mitochondrial distribution in the individual replicates, the data were normalized. To this end, the entire ratio distribution of each replicate was first shifted to an identical value of log2 pM/cM = 0 for the maximum of the mitochondrial distribution. Next, mean log2 abundance ratios of individual proteins were determined and the distribution of mean ratios was shifted back by the mean of the individual shifting factors (i.e., 1.075) used in the first step of this normalization. This results in local maxima of log2 pM/cM = −1.23 and log2 pM/cM = 1.08 for the distribution of mean log2 protein abundance ratios. To report data of high reproducibility, proteins were filtered based on the standard deviation determined for mean log2 pM/cM ratios across all replicates. Proteins with standard deviations identified as outlier by boxplot analysis (i.e., proteins with an SD > 1.11; 248 proteins) were not considered for further analyses. To classify the remaining 7,448 proteins of this dataset, agglomerative hierarchical clustering was performed using the Ward’s minimum variance linkage method (Murtagh and Legendre, 2014). Based on Gene Ontology (GO) exact testing performed for individual clusters, the subtractive proteomics dataset was divided into nine different classes (Table S2).
Datasets obtained from HEK, HeLa, Huh7, and U2OS cells (n = 2 each): Data obtained in this multiple cell line subtractive proteomics experiment were analyzed together with the data of the large-scale subtractive proteomics experiment of HEK cells (n = 4) described above, serving as a reference. For further analysis, proteins identified in a dataset (i.e., present in at least one out of two or four replicates, based on MS intensity) were required to (i) be quantified in each replicate of the multiple cell line experiment and (ii) have a sequence coverage ≥ 10% in all replicates per dataset, which resulted in a list of ‘filtered’ proteins (see Table S2). Next, the z score of log2 pM/cM ratios (non-normalized) was calculated for filtered proteins using the sklearn ‘StandardScaler’ function in Python (Pedregosa et al., 2011). For the classification of mitochondrial versus non-mitochondrial proteins, z-score transformed ratios were subjected to density-based spatial clustering of applications with noise (DBSCAN; Ester et al., 1996) using the scikit-learn module for Python (Pedregosa et al., 2011). Critical parameters were ‘eps(ilon) = 0.35’ for the radius/size of the neighborhood and ‘min_samples = 350’ for the number of minimum data points in the epsilon region. Clustering resulted in two clusters, a mitochondrial and a background cluster, for each dataset. All proteins that were not present in the mitochondrial clusters were defined as non-mitochondrial proteins. The average of the replicates of each cell line showed a bimodal distribution and the Bhattacharyya distance (Bhattacharyya, 1946) was used as measure for the goodness of separation between the two Gaussian distributions of the data (i.e., background/others and mitochondrial distribution). Mean (μ) and standard deviation (σ) of the Gaussian distributions forming the bimodal distribution were obtained with scipy’s curve fit function (Virtanen et al., 2020). Data were binned (200 bins) and the average of each cell line was modeled as a bimodal distribution consisting of two Gaussian distributions, with each Gaussian distribution described as amplitude ∗ e (-(x-μ)2/2/(σ2)). A lower threshold of μMito-3σMito was employed to further filter the DBSCAN cluster results of non-MitoCoP proteins to ensure high confidence in putative candidates. For each dataset, a final ‘Mito-cluster’ was defined, containing proteins that fulfilled all filter criteria described above (Table S2).
Gene ontology exact testing
Gene Ontology (GO) exact testing of defined classes of proteins was performed using PANTHER (version 14.1; http://www.pantherdb.org/; Mi et al., 2019) and all proteins used for the classification as background. A Fisher’s exact test was performed and p values were corrected for multiple testing by Bonferroni adjustment. GO terms with a corrected p value of < 0.05 were considered enriched (see Table S2).
Processing of spatial proteomics data
Data generated in spatial proteomics experiments were analyzed based on MS intensities determined for proteins identified in whole cell lysates (total), the nuclear fraction (P0.8), crude and gradient-purified mitochondrial fractions (cM, pM), and cytosolic and microsomal fractions (S100, P100). Proteins included in this analysis were required to be identified in ≥ 2 out of 3 replicates and in ≥ 3 out of the 6 subcellular fractions. These criteria were met by 8,474 proteins. MS intensities for individual proteins were normalized replicate-wise to the total intensity per fraction and subsequently multiplied with the median of the total intensities determined for all fractions and replicates. For mathematical reasons, missing values for intensities (i.e., intensity of zero) were replaced by 1. Next, normalized intensities were log2-transformed, the mean log2 intensity across all replicates (n ≥ 2) and the corresponding standard deviation were determined for each protein, mean log2 intensity values were delogarithmized and subsequently scaled to row such that the maximum intensity of a protein across all subcellular fractions is 1. The six-dimensional dataset was reduced to two dimensions by t-distributed stochastic neighbor embedding (tSNE) using the ‘Rtsne’ package in R with the following main parameters: perplexity, 500; iteration, 10,000; theta, 0.1; dimensions, 2. For classification, density-based spatial clustering of applications with noise (DBSCAN; ‘dbscan’ package for R, Ester et al., 1996) was performed. Critical parameters were ‘eps(ilon) = 0.58’ for the radius/size of the neighborhood and ‘minPts = 2’ for the number of minimum data points in the epsilon region. This resulted in the formation of two clusters representing predominantly proteins of the mitochondrial test set (defined as class 1) or predominantly proteins of the non-mitochondrial test set (class 2) (see Figure 1D and Table S2). Proteins of the larger non-mitochondrial cluster 2 were subjected to further subclustering by DBSCAN. Here, the parameters ‘eps’ and ‘min_Pts’ were set to 1.075 and 52, respectively. This resulted in the definition of five subclusters mainly representing proteins of the plasma membrane and the ER, cytosolic proteins (forming two distinct subclusters) and nuclear proteins (see Figure S2E and Table S2).
Definition of human mitochondrial proteins by importomics
The human mitochondrial importome was determined essentially as described previously for the mitochondrial importome of Trypanosoma brucei (Peikert et al., 2017) following shRNA-mediated knockdown of the main mitochondrial entry gate TOMM40. To delimit mitochondrial proteins from proteins of other subcellular origin in the tomm40-KD dataset, significance thresholds for mean tomm40KD/mock SILAC ratios (non-normalized; log2-transformed; n ≥ 2/4 replicates) were defined based on the test sets for mitochondrial and non-mitochondrial human proteins. The test sets were used to calculate F1 scores for defined mean log2 SILAC ratios increasing in 0.01 increments as described before (Peikert et al., 2017) for both the mitochondrial and the non-mitochondrial test set. The ratio giving the maximum F1 score best separates the test set tested from the opposite test set. The maximum F1 scores determined for the mitochondrial and the non-mitochondrial test set were at mean log2 SILAC ratios of −0.909 (t1; mito.) and −0.199 (t2; non-mito.), respectively (see Figure S3D). These ratios represent significance thresholds that impose different levels of confidence for individual proteins of the human mitochondrial importome with t1 setting a threshold of higher confidence. In addition, p values determined for individual proteins using a two-sided Student’s t test were corrected for multiple testing following the FDR concept of Benjamini and Hochberg (Benjamini and Hochberg, 1995). The threshold was set to an FDR-adjusted p value of 0.05, which corresponds to a p value of 0.0081 before correction. Based on the ratio thresholds determined by F1 scoring and the p values of 0.05 and 0.0081, the proteins of the tomm40-KD dataset were grouped into four classes: class 1 comprises proteins with a mean log2 tomm40KD/mock ratio of ≤ −0.909 (t1) and a p value < 0.0081, class 2 proteins with a mean log2 ratio of ≤ −0.909 and a p value between < 0.05 and ≥ 0.0081, class 3 proteins with a mean log2 ratio between −0.199 and −0.909 and a p value < 0.0081, and class 4 all other proteins (see Figure 2C and Table S3).
Definition of the human mitochondrial high-confidence proteome (MitoCoP)
To assemble a high-confidence mitochondrial proteome (Table S1) based on the subtractive proteomics, spatial proteomics and importomics datasets presented in this study, we proceeded in several steps. For a preselection, we considered proteins of these three datasets when the proteins were located in classes/clusters containing a high ratio of mitochondrial test set proteins over non-mitochondrial test set proteins and were identified with a minimum sequence coverage of > 5%; this initial pre-selection included: subtractive proteomics classes 1, 2 and 3 with a mean log2 ratio pM/cM > 0 (Figures 1B and 1C; Figures S1H–S1L), spatial proteomics cluster 1 (Figures 1D and 1E; Figures S2B–S2F), and importomics classes 1, 2 and 3 (Figures 2C–2F; Figures S3F–S3H and S3K). Proteins were selected for MitoCoP pool 1 in case they were present in class 1/cluster 1 of one dataset (i.e., most stringent class or cluster) and in at least one additional mitochondrial protein-enriched class or cluster from one of the other two datasets; thus, only proteins with at least two independent experimental evidences were selected. In addition, proteins of the subtractive proteomics classes 1 and 2 or importomics class 2 were selected for MitoCoP pool 2 when they were identified with a sequence coverage of > 25% in the respective dataset and positively evaluated in at least one of the other two datasets according to the following criteria: proteins of the subtractive proteomics classes 1 and 2 were only selected in case the spatial proteomics sequence coverage ratio pM/maximum was > 85% (mitochondrial proteins typically display a high sequence coverage in the sample containing pure mitochondria); proteins of importomics class 2 were only selected in case they were present in two or more of the initial classes with an enrichment of mitochondrial proteins described above. In addition, MitoCoP pool 3 proteins were selected from our datasets when they were present in one of the initial mitochondrial protein-enriched classes or were selected by the spatial proteomics dataset (log2 ratio pure to crude mitochondria [pM/cM] > 0.575, sequence coverage pure mitochondria [pM] > 25% and ratio [pM/maximum] > 85%) and additionally listed as known or experimentally determined mitochondrial protein in one of the three major mitochondrial annotation repositories IMPI (Q2 2018; Smith and Robinson, 2009, 2019), MitoCarta2.0 (Calvo et al., 2016) or the Human Proteome Atlas HPA (Thul et al., 2017). To complement the MitoCoP proteins experimentally identified in HEK293T and HeLa cells in this study with MitoCoP pool 4 proteins that are only present or detectable in other human cells, we selected proteins with mitochondria in the name when the proteins were listed as known or experimentally determined in one of the three major databases or when they were listed in all three databases together, as well as proteins defined by literature curation of original, experimental publications describing mitochondrial proteins. The detailed criteria for each MitoCoP protein are listed in Table S1. During the revision of this manuscript, an updated MitoCarta version was released (MitoCarta3.0; Rath et al., 2021). Analysis with MitoCarta3.0 assigns 11 additional proteins to MitoCoP (see Table S1), e.g., FDPS, NUDT2 (both in class 1 of the Importomics dataset) and DHRS1 (in cluster 1 of the spatial proteomics dataset).
Carbonate and sonication assays
To assess the membrane association of MitoCoP proteins identified in ≥ 2/4 replicates of carbonate/sonication assays (i.e., 782 proteins), the percentage of ‘membrane-integrated’ (integral) and ‘membrane-associated’ was calculated based on non-normalized ratios between soluble (supernatant, SN) and corresponding insoluble fractions (pellet, P) obtained following carbonate extraction or sonification of gradient-purified mitochondria and using peptide stable isotope dimethyl labeling for relative protein quantification. To calculate ‘% integral’ and ‘% membrane-associated’, the formula
was used with P/SN ratios of carbonate extraction experiments for ‘% integral’ and P/SN ratios of sonication experiments for ‘% membrane-associated’.
To group MitoCoP proteins showing similar characteristics regarding their membrane association (integral, peripheral, or soluble), the data (‘% integral’ and ‘% membrane-associated’) were clustered using DBSCAN with ‘eps = 4.7’ and ‘minPts = 10’. 692 proteins were grouped into 3 clusters representing predominantly integral (172 proteins), peripheral (449 proteins) or soluble (71 proteins) proteins. The remaining 90 proteins (referred to as ‘ambiguous’) were not assigned to any cluster (see Figure S4E and Table S3).
Calculation of protein copy numbers
The calculation of protein copy numbers per cell was based on peptide MS1 intensities determined by MaxQuant for whole cell lysates (‘totals’) of the spatial proteomics experiments (n = 3) taking into account peptides unique for one protein group and peptides shared between multiple protein groups. The intensity of a shared peptide was distributed between protein groups that shared the respective peptide sequence as described by Zhang et al., 2015. A fraction of shared peptide intensity was assigned to each protein group based on the intensities of unique peptides of that protein group divided by the sum of unique intensities of all protein groups sharing the sequence. Based on the resulting distributed protein group intensities, protein copy numbers were essentially calculated following the ‘Total Protein Approach’ (Wiśniewski et al., 2012).
To determine the total protein content per single HEK cell, cells were counted using KOVA™ Glasstic™ slides 10 with grids (n = 3), lysed, and the protein concentration of the lysate was determined, yielding an average protein content of 290.2 pg/cell (±48.9). Protein copy numbers were then computed using the ‘proteomic ruler’ plugin for Perseus (Tyanova et al., 2016) with ‘Total protein amount’ selected as scaling mode and a value of 290 for protein amount per cell [pg]. The option ‘Detectability correction’ was enabled, and the number of theoretical peptides was deployed.
To determine protein copies per mitochondrial unit (referred to as mito-copies per cell), distributed protein group intensities for the pure mitochondrial (pM) fractions of the spatial proteomics experiments (n = 3) were calculated as described above. These intensity values were normalized to correct for differences in protein sequence length by dividing them by the number of theoretical tryptic peptides of a given protein, yielding pM iBAQ values. Next, we defined a set of bona fide mitochondrial proteins (i.e., class 1 proteins of the spatial proteomics dataset filtering with a sequence coverage of > 25% and additional mitochondrial evidence from at least one other dataset; see Table S4). Log10-transformed pM iBAQ values were then plotted replicate-wise against the corresponding log10-transformed copy numbers per cell (exemplarily shown for replicate 1 in Figure S5B). Based on the bona fide mitochondrial protein set, a regression line for each replicate was fitted (Figure S5B). The function of the regression fit was used to transform the pM iBAQ values into mito-copies per cell. The Pearson correlation for the bona fide mitochondrial proteins (log10 iBAQ pM versus log10 copy number per cell) was in the range of 0.91 - 0.93 for all three replicates. We report mean mito-copies per cell for MitoCoP proteins based on valid values for ≥ 2 replicates.
Complexome profiling
Complexome profiling of mitochondria from wild-type cells (n = 2) resulted in the identification of 3,616 proteins including 965 MitoCoP proteins in replicate 1 and 3,151 proteins/941 MitoCoP proteins in replicate 2. A total of 2,537 proteins, of which 904 are MitoCoP proteins, were identified in both replicates (see Table S5). Data were normalized by dividing each intensity by the respective row’s maximum intensity, which was set to 1. The normalized intensities were used for agglomerative hierarchical clustering following the Ward’s minimum variance linkage method (Murtagh and Legendre, 2014; Ward, 1963) (see Figure S6B and Table S5). To determine the similarity of protein profiles in both replicates, the Spearman correlation was calculated for each protein (omitting the last two slices of replicate 1). To compare the complexome data of mitochondria from LYRM9KO and control cells, data were normalized by dividing each intensity by the sum of the respective row’s intensity. For visualization, the difference between the normalized intensities of LYRM9KO and control cells is shown for selected MitoCoP proteins (see Figure S6H and Table S5).
Classification of contaminants in q-AP-MS data
To identify potential contaminants in our C22orf39, LYRM9, MBLAC2, NCBP2-AS2, NTPCR, and PIGBOS1 q-AP-MS datasets (two biological replicates each; see Table S5) that are not included in the list of common contaminants provided by MaxQuant/Andromeda, we performed DBSCAN (using the scikit-learn module for Python; Pedregosa et al., 2011) for each individual dataset applying default settings, except for the hyperparamters ‘eps’ (set to 0.55) and ‘min_samples’ (set to 15). This resulted in the definition of a central cluster of non-specifically co-purified proteins exhibiting a log2 bait/control ratio of ∼0. Proteins that are not part of the central cluster and exhibit a log2 bait/control ratio of < 0 in at least one replicate are considered as contaminant and are not depicted in the ratio-versus-ratio plots shown in Figures 6A–6D, 6F, and 6G.
Determination of protein half-lives for human mitochondrial proteins
Data obtained from HeLa cells (n = 3): Data on protein dynamics including protein degradation, synthesis, and half-lives were determined based on MS intensities for light, medium-heavy and heavy labeled peptides reported by MaxQuant in the ‘peptides.txt’ output file for pSILAC experiments. Only peptides that were (i) unique for a protein group and (ii) identified in at least one measurement were taken into account. The intensity ratios H/L and MH/L were used to compute the peptide profiles for synthesis and degradation, respectively (this applies to replicate 1 as shown in Figure S7A; for replicates 2 and 3, the respective label-switch has to be taken into account).
In the MaxQuant output file ‘proteinGroups.txt’, 7,609 proteins were identified in at least one pSILAC measurement. Of these, 985 are proteins of the MitoCoP. Profiles for MitoCoP proteins reflecting protein synthesis and degradation, respectively, were calculated based on the previously calculated peptide ratios for synthesis and degradation. For each replicate and time point, data were normalized such that the sum of the ratios for synthesis and degradation is 1, reflecting the steady-state conditions in our experiment, in which the total protein amount remains constant.
Next, for each time point, mean values for protein synthesis and degradation and the corresponding standard deviation (n = 3) were determined. To obtain protein dynamics data of high reliability, the following filter criteria were applied: (i) values outside the 99% quantile for the standard deviation determined for the time point 12 h (i.e., ≥ 0.193 for both synthesis and degradation) were removed and (ii) proteins were required to have ratios for synthesis and degradation for at least three connected time points (i.e., a connectivity of ≥ 3). 850 of the 985 MitoCoP proteins identified in this dataset fulfilled these criteria. Protein profiles were fitted to simple exponential functions using the nonlinear least square function ‘nls.lm’ in R with the following equations (Boisvert et al., 2012):
| (Equation 1) |
| (Equation 2) |
in which a is the maximum (normalized) amplitude, b the minimal (normalized) amplitude and t the time of the pulse from medium-heavy to heavy amino acids (for replicate 1). kdeg and ksyn are rate constants for protein degradation and synthesis, respectively.
For the estimation of the initial parameters, a linear model fit was performed. The intercept with the y axis of the linear model was then used as initial amplitude a and the slope of the linear model as initial rate constant. Based on a first evaluation using the residual sum of squares (RSOS) of curve fits with offset parameter b set to distinct fixed values in the range of −0.1 to 0.25, b was set to 0, the global optimum of the curve fits with the minimum RSOS. The deviation of the maximum amplitide a from an ideal value of 1.0 reflects the quality of the fitted curve. To report data of high confidence, values with high deviation from 1.0 were not considered for further calculations. 2% of the values exhibiting the highest deviation were removed (i.e., quantile 1% < 0.651, quantile 99% > 1.039) resulting in valid protein turnover data for 832 of the 850 MitoCoP proteins (Table S6).
The rates for degradation and synthesis were further corrected by the cell doubling rate to derive protein half-life lives. Based on the experimentally measured cell doubling time of 20.09 h, the cell doubling rate was calculated as kcd = ln(2)/20.09 h = 0.03450 h-1. For each protein, the final half-life T1/2 was computed from its mean rates of degradation and synthesis:
| (Equation 3) |
For 771 of the quantified MitoCoP proteins, a half-life was calculated. Of note, for proteins that have very slow rates of degradation and synthesis, the subtraction of rates in Equation 3 leads to large relative errors in the resulting half-life. For about 25% of the quantified MitoCoP proteins having half-lives ≥ 200 h, the relative confidence interval of the half-life typically exceeds ∼30%. For 61 of these proteins, the half-life is “infinite” (rate correction in Equation 3 leads to negative rate values) (Table S6).
Dataset obtained from Huh7 cells (n = 2): The analysis of protein dynamics was based on a double pSILAC experiment, and values for degradation and synthesis were calculated using the MS intensities for light and heavy labeled peptides (Figure S7F). Following the assumption that the total protein amount remains constant during the course of the experiment, intensities of light and heavy peptides were normalized by dividing them by their sum. Thus, the sum of light and heavy intensities is equal to one at each time point. For the following calculations, the normalized peptide intensities of the replicates were aggregated. Degradation and synthesis were calculated on peptide level using Equations 1 and 2 described above for peptides with at least three values for both light and heavy label. Half-lives were determined considering the Huh7 cell doubling time of 21.88 h following Equation 3. To report protein dynamics data of high reliability, the following criteria were applied: (i) 0.5 < a < 1.5, (ii) −0.3 < b < 0.3, and (iii) 0 < k < 5. Peptides for which these fitted parameters lay outside the defined ranges and for which negative half-lives were determined were removed. Peptides were assigned to proteins based on their MaxQuant protein group IDs. The median of the peptide half-lives is reported as the protein’s half-life (Table S6).
Acknowledgments
We thank Peter Rehling for experimental advice and discussion and the PRIDE team for data deposition to the ProteomeXchange Consortium. Work included in this study has also been performed in partial fulfillment of the requirements for the doctoral theses of M.M., P.L., C.D.P., and S.D. and the master theses of C.Kl. and O.A. at the University of Freiburg. This work was supported by the European Research Council (ERC) Consolidator grant 648235 (to N.W. and B.W.) and 769065 (to C.Kr.); the European Union Marie Curie Initial Training Networks (ITN) program PerICo grant agreement 812968 (to B.W.) and DRIVE grant agreement 765912 (to C.Kr.); and the Deutsche Forschungsgemeinschaft (DFG, German Research Foundation) project ID 403222702/SFB 1381 (to B.W., N.W., and C.Kr.), 259130777/SFB 1177 (to C.Kr.), 278002225/RTG 2202 (to B.W.), FOR 2743 (to B.W.), PF 202/9-1 – project ID 394024777 (to N.P.), WI 4506/1-1 – project ID 406757425 (to N.W.), project ID 409673687, and Germany’s Excellence Strategy CIBSS – EXC-2189 – project ID 390939984 to (B.W., N.W., N.P., and C.Kr.). This work reflects only the authors’ view and the European Union’s Horizon 2020 research and innovation program is not responsible for any use that may be made of the information it contains.
Author contributions
M.M., P.L., C.S., I.S., C.Kl., O.A., N.N., B.K., J.D.B., S.B.S., S.D., C.L., M.L., and C.E. designed and performed the experiments and analyzed the data together with C.D.P., F.D., L.M., A.S., W.W.D.M., V.K.P., R.G., R.M.Z., M.T.R., C.Kr., S.D., S.O., N.P., N.W. and B.W.; B.W., S.O., N.W., and N.P. designed and supervised the project; M.M., C.D.P., I.S., P.L., A.S., N.N., S.O., B.W. and N.W. prepared the figures and tables; B.W., S.O., M.M., N.W., and N.P. wrote the manuscript together with input of the other authors; all authors discussed results from the experiments and commented on the manuscript.
Declaration of interests
The authors declare no competing interests.
Published: November 19, 2021
Footnotes
Supplemental information can be found online at https://doi.org/10.1016/j.cmet.2021.11.001.
Contributor Information
Nils Wiedemann, Email: nils.wiedemann@biochemie.uni-freiburg.de.
Bettina Warscheid, Email: bettina.warscheid@biologie.uni-freiburg.de.
Supplemental information
Data and code availability
-
•
MS proteomics data have been deposited to the ProteomeXchange Consortium via the PRIDE (Perez-Riverol et al., 2019) partner repository and are publicly available as of the date of publication. Accession numbers are listed in the key resource table.
-
•
The paper does not report original code.
-
•
Any additional information required to reanalyze the data reported in this paper is available from the lead contact upon request.
References
- Anand R., Strecker V., Urbach J., Wittig I., Reichert A.S. Mic13 Is Essential for Formation of Crista Junctions in Mammalian Cells. PLoS One. 2016;11:e0160258. doi: 10.1371/journal.pone.0160258. [DOI] [PMC free article] [PubMed] [Google Scholar]
- Angerer H. Eukaryotic LYR Proteins Interact with Mitochondrial Protein Complexes. Biology (Basel) 2015;4:133–150. doi: 10.3390/biology4010133. [DOI] [PMC free article] [PubMed] [Google Scholar]
- Anton F., Dittmar G., Langer T., Escobar-Henriques M. Two deubiquitylases act on mitofusin and regulate mitochondrial fusion along independent pathways. Mol. Cell. 2013;49:487–498. doi: 10.1016/j.molcel.2012.12.003. [DOI] [PubMed] [Google Scholar]
- Araiso Y., Tsutsumi A., Qiu J., Imai K., Shiota T., Song J., Lindau C., Wenz L.-S., Sakaue H., Yunoki K., et al. Structure of the mitochondrial import gate reveals distinct preprotein paths. Nature. 2019;575:395–401. doi: 10.1038/s41586-019-1680-7. [DOI] [PubMed] [Google Scholar]
- Ashburner M., Ball C.A., Blake J.A., Botstein D., Butler H., Cherry J.M., Davis A.P., Dolinski K., Dwight S.S., Eppig J.T., et al. The Gene Ontology Consortium Gene ontology: tool for the unification of biology. Nat. Genet. 2000;25:25–29. doi: 10.1038/75556. [DOI] [PMC free article] [PubMed] [Google Scholar]
- Backes S., Hess S., Boos F., Woellhaf M.W., Gödel S., Jung M., Mühlhaus T., Herrmann J.M. Tom70 enhances mitochondrial preprotein import efficiency by binding to internal targeting sequences. J. Cell Biol. 2018;217:1369–1382. doi: 10.1083/jcb.201708044. [DOI] [PMC free article] [PubMed] [Google Scholar]
- Bekeova C., Anderson-Pullinger L., Boye K., Boos F., Sharpadskaya Y., Herrmann J.M., Seifert E.L. Multiple mitochondrial thioesterases have distinct tissue and substrate specificity and CoA regulation, suggesting unique functional roles. J. Biol. Chem. 2019;294:19034–19047. doi: 10.1074/jbc.RA119.010901. [DOI] [PMC free article] [PubMed] [Google Scholar]
- Bendall S.C., Hughes C., Stewart M.H., Doble B., Bhatia M., Lajoie G.A. Prevention of amino acid conversion in SILAC experiments with embryonic stem cells. Mol. Cell. Proteomics. 2008;7:1587–1597. doi: 10.1074/mcp.M800113-MCP200. [DOI] [PMC free article] [PubMed] [Google Scholar]
- Benjamini Y., Hochberg Y. Controlling the False Discovery Rate: A Practical and Powerful Approach to Multiple Testing. J. R. Stat. Soc. B. 1995;57:289–300. [Google Scholar]
- Bhattacharyya A. On a Measure of Divergence between Two Multinomial Populations. Sankhya. 1946;7:401–406. [Google Scholar]
- Boersema P.J., Raijmakers R., Lemeer S., Mohammed S., Heck A.J.R. Multiplex peptide stable isotope dimethyl labeling for quantitative proteomics. Nat. Protoc. 2009;4:484–494. doi: 10.1038/nprot.2009.21. [DOI] [PubMed] [Google Scholar]
- Boisvert F.-M., Ahmad Y., Gierliński M., Charrière F., Lamont D., Scott M., Barton G., Lamond A.I. A Quantitative Spatial Proteomics Analysis of Proteome Turnover in Human Cells. Mol. Cell. Proteomics. 2012;11 doi: 10.1074/mcp.M111.011429. M111.011429. [DOI] [PMC free article] [PubMed] [Google Scholar]
- Boos F., Krämer L., Groh C., Jung F., Haberkant P., Stein F., Wollweber F., Gackstatter A., Zöller E., van der Laan M., et al. Mitochondrial protein-induced stress triggers a global adaptive transcriptional programme. Nat. Cell Biol. 2019;21:442–451. doi: 10.1038/s41556-019-0294-5. [DOI] [PubMed] [Google Scholar]
- Calvo S.E., Clauser K.R., Mootha V.K. MitoCarta2.0: an updated inventory of mammalian mitochondrial proteins. Nucleic Acids Res. 2016;44(D1):D1251–D1257. doi: 10.1093/nar/gkv1003. [DOI] [PMC free article] [PubMed] [Google Scholar]
- Carroll J., He J., Ding S., Fearnley I.M., Walker J.E. TMEM70 and TMEM242 help to assemble the rotor ring of human ATP synthase and interact with assembly factors for complex I. Proc. Natl. Acad. Sci. USA. 2021;118 doi: 10.1073/pnas.2100558118. e2100558118. [DOI] [PMC free article] [PubMed] [Google Scholar]
- Chacinska A., Lind M., Frazier A.E., Dudek J., Meisinger C., Geissler A., Sickmann A., Meyer H.E., Truscott K.N., Guiard B., et al. Mitochondrial presequence translocase: switching between TOM tethering and motor recruitment involves Tim21 and Tim17. Cell. 2005;120:817–829. doi: 10.1016/j.cell.2005.01.011. [DOI] [PubMed] [Google Scholar]
- Chacinska A., Koehler C.M., Milenkovic D., Lithgow T., Pfanner N. Importing mitochondrial proteins: machineries and mechanisms. Cell. 2009;138:628–644. doi: 10.1016/j.cell.2009.08.005. [DOI] [PMC free article] [PubMed] [Google Scholar]
- Chacinska A., van der Laan M., Mehnert C.S., Guiard B., Mick D.U., Hutu D.P., Truscott K.N., Wiedemann N., Meisinger C., Pfanner N., Rehling P. Distinct forms of mitochondrial TOM-TIM supercomplexes define signal-dependent states of preprotein sorting. Mol. Cell. Biol. 2010;30:307–318. doi: 10.1128/MCB.00749-09. [DOI] [PMC free article] [PubMed] [Google Scholar]
- Chen Y.-C., Taylor E.B., Dephoure N., Heo J.-M., Tonhato A., Papandreou I., Nath N., Denko N.C., Gygi S.P., Rutter J. Identification of a protein mediating respiratory supercomplex stability. Cell Metab. 2012;15:348–360. doi: 10.1016/j.cmet.2012.02.006. [DOI] [PMC free article] [PubMed] [Google Scholar]
- Chibucos M.C., Siegele D.A., Hu J.C., Giglio M. The Evidence and Conclusion Ontology (ECO): Supporting GO Annotations. Methods Mol. Biol. 2017;1446:245–259. doi: 10.1007/978-1-4939-3743-1_18. [DOI] [PMC free article] [PubMed] [Google Scholar]
- Chu Q., Martinez T.F., Novak S.W., Donaldson C.J., Tan D., Vaughan J.M., Chang T., Diedrich J.K., Andrade L., Kim A., et al. Regulation of the ER stress response by a mitochondrial microprotein. Nat. Commun. 2019;10:4883. doi: 10.1038/s41467-019-12816-z. [DOI] [PMC free article] [PubMed] [Google Scholar]
- Cohen M.M., Amiott E.A., Day A.R., Leboucher G.P., Pryce E.N., Glickman M.H., McCaffery J.M., Shaw J.M., Weissman A.M. Sequential requirements for the GTPase domain of the mitofusin Fzo1 and the ubiquitin ligase SCFMdm30 in mitochondrial outer membrane fusion. J. Cell Sci. 2011;124:1403–1410. doi: 10.1242/jcs.079293. [DOI] [PMC free article] [PubMed] [Google Scholar]
- Cox J., Mann M. MaxQuant enables high peptide identification rates, individualized p.p.b.-range mass accuracies and proteome-wide protein quantification. Nat. Biotechnol. 2008;26:1367–1372. doi: 10.1038/nbt.1511. [DOI] [PubMed] [Google Scholar]
- Cox J., Neuhauser N., Michalski A., Scheltema R.A., Olsen J.V., Mann M. Andromeda: a peptide search engine integrated into the MaxQuant environment. J. Proteome Res. 2011;10:1794–1805. doi: 10.1021/pr101065j. [DOI] [PubMed] [Google Scholar]
- Delmotte N., Lasaosa M., Tholey A., Heinzle E., Huber C.G. Two-dimensional reversed-phase x ion-pair reversed-phase HPLC: an alternative approach to high-resolution peptide separation for shotgun proteome analysis. J. Proteome Res. 2007;6:4363–4373. doi: 10.1021/pr070424t. [DOI] [PubMed] [Google Scholar]
- Dibley M.G., Formosa L.E., Lyu B., Reljic B., McGann D., Muellner-Wong L., Kraus F., Sharpe A.J., Stroud D.A., Ryan M.T. The mitochondrial acyl-carrier protein interaction network highlights important roles for LYRM family members in complex I and mitoribosome assembly. Mol. Cell. Proteomics. 2020;19:65–77. doi: 10.1074/mcp.RA119.001784. [DOI] [PMC free article] [PubMed] [Google Scholar]
- Ding C., Wu Z., Huang L., Wang Y., Xue J., Chen S., Deng Z., Wang L., Song Z., Chen S. Mitofilin and CHCHD6 physically interact with Sam50 to sustain cristae structure. Sci. Rep. 2015;5:16064. doi: 10.1038/srep16064. [DOI] [PMC free article] [PubMed] [Google Scholar]
- Endo T., Yamano K., Kawano S. Structural insight into the mitochondrial protein import system. Biochim. Biophys. Acta. 2011;1808:955–970. doi: 10.1016/j.bbamem.2010.07.018. [DOI] [PubMed] [Google Scholar]
- Ester M., Kriegel H.-P., Sander J., Xu X. A density-based algorithm for discovering clusters in large spatial databases with noise. Proc. 2nd Int. Conf. Knowl. Discov. Data Min. KDD. 1996;96:226–231. [Google Scholar]
- Faou P., Hoogenraad N.J. Tom34: a cytosolic cochaperone of the Hsp90/Hsp70 protein complex involved in mitochondrial protein import. Biochim. Biophys. Acta. 2012;1823:348–357. doi: 10.1016/j.bbamcr.2011.12.001. [DOI] [PubMed] [Google Scholar]
- Formosa L.E., Ryan M.T. Mitochondrial OXPHOS complex assembly lines. Nat. Cell Biol. 2018;20:511–513. doi: 10.1038/s41556-018-0098-z. [DOI] [PubMed] [Google Scholar]
- Fornasiero E.F., Mandad S., Wildhagen H., Alevra M., Rammner B., Keihani S., Opazo F., Urban I., Ischebeck T., Sakib M.S., et al. Precisely measured protein lifetimes in the mouse brain reveal differences across tissues and subcellular fractions. Nat. Commun. 2018;9:4230. doi: 10.1038/s41467-018-06519-0. [DOI] [PMC free article] [PubMed] [Google Scholar]
- Frazier A.E., Thorburn D.R., Compton A.G. Mitochondrial energy generation disorders: genes, mechanisms, and clues to pathology. J. Biol. Chem. 2019;294:5386–5395. doi: 10.1074/jbc.R117.809194. [DOI] [PMC free article] [PubMed] [Google Scholar]
- Freyre C.A.C., Rauher P.C., Ejsing C.S., Klemm R.W. MIGA2 Links Mitochondria, the ER, and Lipid Droplets and Promotes De Novo Lipogenesis in Adipocytes. Mol. Cell. 2019;76:811–825. doi: 10.1016/j.molcel.2019.09.011. [DOI] [PubMed] [Google Scholar]
- Gaucher S.P., Taylor S.W., Fahy E., Zhang B., Warnock D.E., Ghosh S.S., Gibson B.W. Expanded coverage of the human heart mitochondrial proteome using multidimensional liquid chromatography coupled with tandem mass spectrometry. J. Proteome Res. 2004;3:495–505. doi: 10.1021/pr034102a. [DOI] [PubMed] [Google Scholar]
- Genin E.C., Plutino M., Bannwarth S., Villa E., Cisneros-Barroso E., Roy M., Ortega-Vila B., Fragaki K., Lespinasse F., Pinero-Martos E., et al. CHCHD10 mutations promote loss of mitochondrial cristae junctions with impaired mitochondrial genome maintenance and inhibition of apoptosis. EMBO Mol. Med. 2016;8:58–72. doi: 10.15252/emmm.201505496. [DOI] [PMC free article] [PubMed] [Google Scholar]
- Gomkale R., Cruz-Zaragoza L.D., Suppanz I., Guiard B., Montoya J., Callegari S., Pacheu-Grau D., Warscheid B., Rehling P. Defining the substrate spectrum of the TIM22 complex identifies pyruvate carrier subunits as unconventional cargos. Curr. Biol. 2020;30:1119–1127. doi: 10.1016/j.cub.2020.01.024. [DOI] [PMC free article] [PubMed] [Google Scholar]
- Guarani V., McNeill E.M., Paulo J.A., Huttlin E.L., Fröhlich F., Gygi S.P., Van Vactor D., Harper J.W. QIL1 is a novel mitochondrial protein required for MICOS complex stability and cristae morphology. eLife. 2015;4:e06265. doi: 10.7554/eLife.06265. [DOI] [PMC free article] [PubMed] [Google Scholar]
- Guarani V., Jardel C., Chrétien D., Lombès A., Bénit P., Labasse C., Lacène E., Bourillon A., Imbard A., Benoist J.-F., et al. QIL1 mutation causes MICOS disassembly and early onset fatal mitochondrial encephalopathy with liver disease. eLife. 2016;5:e17163. doi: 10.7554/eLife.17163. [DOI] [PMC free article] [PubMed] [Google Scholar]
- Gustafsson C.M., Falkenberg M., Larsson N.-G. Maintenance and Expression of Mammalian Mitochondrial DNA. Annu. Rev. Biochem. 2016;85:133–160. doi: 10.1146/annurev-biochem-060815-014402. [DOI] [PubMed] [Google Scholar]
- Harner M., Körner C., Walther D., Mokranjac D., Kaesmacher J., Welsch U., Griffith J., Mann M., Reggiori F., Neupert W. The mitochondrial contact site complex, a determinant of mitochondrial architecture. EMBO J. 2011;30:4356–4370. doi: 10.1038/emboj.2011.379. [DOI] [PMC free article] [PubMed] [Google Scholar]
- Harris C.R., Millman K.J., van der Walt S.J., Gommers R., Virtanen P., Cournapeau D., Wieser E., Taylor J., Berg S., Smith N.J., et al. Array programming with NumPy. Nature. 2020;585:357–362. doi: 10.1038/s41586-020-2649-2. [DOI] [PMC free article] [PubMed] [Google Scholar]
- Hoppins S., Collins S.R., Cassidy-Stone A., Hummel E., Devay R.M., Lackner L.L., Westermann B., Schuldiner M., Weissman J.S., Nunnari J. A mitochondrial-focused genetic interaction map reveals a scaffold-like complex required for inner membrane organization in mitochondria. J. Cell Biol. 2011;195:323–340. doi: 10.1083/jcb.201107053. [DOI] [PMC free article] [PubMed] [Google Scholar]
- Horwich A.L. Chaperonin studies: faith, luck, and a little help from our friends. Mol. Biol. Cell. 2017;28:2915–2918. doi: 10.1091/mbc.E17-07-0479. [DOI] [PMC free article] [PubMed] [Google Scholar]
- Hung V., Zou P., Rhee H.-W., Udeshi N.D., Cracan V., Svinkina T., Carr S.A., Mootha V.K., Ting A.Y. Proteomic mapping of the human mitochondrial intermembrane space in live cells via ratiometric APEX tagging. Mol. Cell. 2014;55:332–341. doi: 10.1016/j.molcel.2014.06.003. [DOI] [PMC free article] [PubMed] [Google Scholar]
- Hung V., Lam S.S., Udeshi N.D., Svinkina T., Guzman G., Mootha V.K., Carr S.A., Ting A.Y. Proteomic mapping of cytosol-facing outer mitochondrial and ER membranes in living human cells by proximity biotinylation. eLife. 2017;6:e24463. doi: 10.7554/eLife.24463. [DOI] [PMC free article] [PubMed] [Google Scholar]
- Hunter J.D. Matplotlib: A 2D Graphics Environment. Comput. Sci. Eng. 2007;9:90–95. [Google Scholar]
- Itzhak D.N., Tyanova S., Cox J., Borner G.H. Global, quantitative and dynamic mapping of protein subcellular localization. eLife. 2016;5:e16950. doi: 10.7554/eLife.16950. [DOI] [PMC free article] [PubMed] [Google Scholar]
- Jean Beltran P.M., Mathias R.A., Cristea I.M. A portrait of the human organelle proteome in space and time during cytomegalovirus infection. Cell Syst. 2016;3:361–373. doi: 10.1016/j.cels.2016.08.012. [DOI] [PMC free article] [PubMed] [Google Scholar]
- Kalderon B., Pines O. Protein folding as a driving force for dual protein targeting in eukaryotes. Front. Mol. Biosci. 2014;1:23. doi: 10.3389/fmolb.2014.00023. [DOI] [PMC free article] [PubMed] [Google Scholar]
- Kang Y., Stroud D.A., Baker M.J., De Souza D.P., Frazier A.E., Liem M., Tull D., Mathivanan S., McConville M.J., Thorburn D.R., et al. Sengers Syndrome-Associated Mitochondrial Acylglycerol Kinase Is a Subunit of the Human TIM22 Protein Import Complex. Mol. Cell. 2017;67:457–470. doi: 10.1016/j.molcel.2017.06.014. [DOI] [PubMed] [Google Scholar]
- Kang Y., Anderson A.J., Jackson T.D., Palmer C.S., De Souza D.P., Fujihara K.M., Stait T., Frazier A.E., Clemons N.J., Tull D., et al. Function of hTim8a in complex IV assembly in neuronal cells provides insight into pathomechanism underlying Mohr-Tranebjærg syndrome. eLife. 2019;8:e48828. doi: 10.7554/eLife.48828. [DOI] [PMC free article] [PubMed] [Google Scholar]
- Kim Y.E., Hipp M.S., Bracher A., Hayer-Hartl M., Hartl F.U. Molecular chaperone functions in protein folding and proteostasis. Annu. Rev. Biochem. 2013;82:323–355. doi: 10.1146/annurev-biochem-060208-092442. [DOI] [PubMed] [Google Scholar]
- Körner C., Barrera M., Dukanovic J., Eydt K., Harner M., Rabl R., Vogel F., Rapaport D., Neupert W., Reichert A.S. The C-terminal domain of Fcj1 is required for formation of crista junctions and interacts with the TOB/SAM complex in mitochondria. Mol. Biol. Cell. 2012;23:2143–2155. doi: 10.1091/mbc.E11-10-0831. [DOI] [PMC free article] [PubMed] [Google Scholar]
- Kozjak-Pavlovic V., Ross K., Benlasfer N., Kimmig S., Karlas A., Rudel T. Conserved roles of Sam50 and metaxins in VDAC biogenesis. EMBO Rep. 2007;8:576–582. doi: 10.1038/sj.embor.7400982. [DOI] [PMC free article] [PubMed] [Google Scholar]
- Kussmaul L., Hirst J. The mechanism of superoxide production by NADH:ubiquinone oxidoreductase (complex I) from bovine heart mitochondria. Proc. Natl. Acad. Sci. USA. 2006;103:7607–7612. doi: 10.1073/pnas.0510977103. [DOI] [PMC free article] [PubMed] [Google Scholar]
- Kustatscher G., Grabowski P., Schrader T.A., Passmore J.B., Schrader M., Rappsilber J. Co-regulation map of the human proteome enables identification of protein functions. Nat. Biotechnol. 2019;37:1361–1371. doi: 10.1038/s41587-019-0298-5. [DOI] [PMC free article] [PubMed] [Google Scholar]
- Labbé K., Murley A., Nunnari J. Determinants and functions of mitochondrial behavior. Annu. Rev. Cell Dev. Biol. 2014;30:357–391. doi: 10.1146/annurev-cellbio-101011-155756. [DOI] [PubMed] [Google Scholar]
- Labun K., Montague T.G., Krause M., Torres Cleuren Y.N., Tjeldnes H., Valen E. CHOPCHOP v3: expanding the CRISPR web toolbox beyond genome editing. Nucleic Acids Res. 2019;47(W1):W171–W174. doi: 10.1093/nar/gkz365. [DOI] [PMC free article] [PubMed] [Google Scholar]
- Le Vasseur M., Friedman J., Jost M., Xu J., Yamada J., Kampmann M., Horlbeck M.A., Salemi M.R., Phinney B.S., Weissman J.S., Nunnari J. Genome-wide CRISPRi screening identifies OCIAD1 as a prohibitin client and regulatory determinant of mitochondrial Complex III assembly in human cells. eLife. 2021;10:e67624. doi: 10.7554/eLife.67624. [DOI] [PMC free article] [PubMed] [Google Scholar]
- Lill R., Freibert S.-A. Mechanisms of Mitochondrial Iron-Sulfur Protein Biogenesis. Annu. Rev. Biochem. 2020;89:471–499. doi: 10.1146/annurev-biochem-013118-111540. [DOI] [PubMed] [Google Scholar]
- Małecki J.M., Willemen H.L.D.M., Pinto R., Ho A.Y.Y., Moen A., Eijkelkamp N., Falnes P.Ø. Human FAM173A is a mitochondrial lysine-specific methyltransferase that targets adenine nucleotide translocase and affects mitochondrial respiration. J. Biol. Chem. 2019;294:11654–11664. doi: 10.1074/jbc.RA119.009045. [DOI] [PMC free article] [PubMed] [Google Scholar]
- Mårtensson C.U., Priesnitz C., Song J., Ellenrieder L., Doan K.N., Boos F., Floerchinger A., Zufall N., Oeljeklaus S., Warscheid B., Becker T. Mitochondrial protein translocation-associated degradation. Nature. 2019;569:679–683. doi: 10.1038/s41586-019-1227-y. [DOI] [PubMed] [Google Scholar]
- Mathieson T., Franken H., Kosinski J., Kurzawa N., Zinn N., Sweetman G., Poeckel D., Ratnu V.S., Schramm M., Becher I., et al. Systematic analysis of protein turnover in primary cells. Nat. Commun. 2018;9:689. doi: 10.1038/s41467-018-03106-1. [DOI] [PMC free article] [PubMed] [Google Scholar]
- McKinney W. pandas: a Foundational Python Library for Data Analysis and Statistics. Python High Perform. Sci. Comput. 2011 [Google Scholar]
- McLaughlin K.L., Kew K.A., McClung J.M., Fisher-Wellman K.H. Subcellular proteomics combined with bioenergetic phenotyping reveals protein biomarkers of respiratory insufficiency in the setting of proofreading-deficient mitochondrial polymerase. Sci. Rep. 2020;10:3603. doi: 10.1038/s41598-020-60536-y. [DOI] [PMC free article] [PubMed] [Google Scholar]
- Mi H., Muruganujan A., Ebert D., Huang X., Thomas P.D. PANTHER version 14: more genomes, a new PANTHER GO-slim and improvements in enrichment analysis tools. Nucleic Acids Res. 2019;47(D1):D419–D426. doi: 10.1093/nar/gky1038. [DOI] [PMC free article] [PubMed] [Google Scholar]
- Mick D.U., Dennerlein S., Wiese H., Reinhold R., Pacheu-Grau D., Lorenzi I., Sasarman F., Weraarpachai W., Shoubridge E.A., Warscheid B., Rehling P. MITRAC links mitochondrial protein translocation to respiratory-chain assembly and translational regulation. Cell. 2012;151:1528–1541. doi: 10.1016/j.cell.2012.11.053. [DOI] [PubMed] [Google Scholar]
- Mishra P., Chan D.C. Mitochondrial dynamics and inheritance during cell division, development and disease. Nat. Rev. Mol. Cell Biol. 2014;15:634–646. doi: 10.1038/nrm3877. [DOI] [PMC free article] [PubMed] [Google Scholar]
- Mootha V.K., Bunkenborg J., Olsen J.V., Hjerrild M., Wisniewski J.R., Stahl E., Bolouri M.S., Ray H.N., Sihag S., Kamal M., et al. Integrated analysis of protein composition, tissue diversity, and gene regulation in mouse mitochondria. Cell. 2003;115:629–640. doi: 10.1016/s0092-8674(03)00926-7. [DOI] [PubMed] [Google Scholar]
- Morgenstern M., Stiller S.B., Lübbert P., Peikert C.D., Dannenmaier S., Drepper F., Weill U., Höß P., Feuerstein R., Gebert M., et al. Definition of a high-confidence mitochondrial proteome at quantitative scale. Cell Rep. 2017;19:2836–2852. doi: 10.1016/j.celrep.2017.06.014. [DOI] [PMC free article] [PubMed] [Google Scholar]
- Murtagh F., Legendre P. Ward’s Hierarchical Agglomerative Clustering Method: Which Algorithms Implement Ward’s Criterion? J. Classif. 2014;31:274–295. [Google Scholar]
- Nakabayashi H., Taketa K., Miyano K., Yamane T., Sato J. Growth of human hepatoma cells lines with differentiated functions in chemically defined medium. Cancer Res. 1982;42:3858–3863. [PubMed] [Google Scholar]
- Neupert W., Herrmann J.M. Translocation of proteins into mitochondria. Annu. Rev. Biochem. 2007;76:723–749. doi: 10.1146/annurev.biochem.76.052705.163409. [DOI] [PubMed] [Google Scholar]
- Nuebel E., Manganas P., Tokatlidis K. Orphan proteins of unknown function in the mitochondrial intermembrane space proteome: New pathways and metabolic cross-talk. Biochim. Biophys. Acta. 2016;1863:2613–2623. doi: 10.1016/j.bbamcr.2016.07.004. [DOI] [PMC free article] [PubMed] [Google Scholar]
- Onder Y., Laothamatas I., Berto S., Sewart K., Kilaru G., Bordieanu B., Stubblefield J.J., Konopka G., Mishra P., Green C.B. The Circadian Protein Nocturnin Regulates Metabolic Adaptation in Brown Adipose Tissue. iScience. 2019;19:83–92. doi: 10.1016/j.isci.2019.07.016. [DOI] [PMC free article] [PubMed] [Google Scholar]
- Ong S.-E., Blagoev B., Kratchmarova I., Kristensen D.B., Steen H., Pandey A., Mann M. Stable isotope labeling by amino acids in cell culture, SILAC, as a simple and accurate approach to expression proteomics. Mol. Cell. Proteomics. 2002;1:376–386. doi: 10.1074/mcp.m200025-mcp200. [DOI] [PubMed] [Google Scholar]
- Opalińska M., Parys K., Murcha M.W., Jańska H. The plant i-AAA protease controls the turnover of an essential mitochondrial protein import component. J. Cell Sci. 2018;131:jcs200733. doi: 10.1242/jcs.200733. [DOI] [PubMed] [Google Scholar]
- Osman C., Wilmes C., Tatsuta T., Langer T. Prohibitins interact genetically with Atp23, a novel processing peptidase and chaperone for the F1Fo-ATP synthase. Mol. Biol. Cell. 2007;18:627–635. doi: 10.1091/mbc.E06-09-0839. [DOI] [PMC free article] [PubMed] [Google Scholar]
- Otera H., Taira Y., Horie C., Suzuki Y., Suzuki H., Setoguchi K., Kato H., Oka T., Mihara K. A novel insertion pathway of mitochondrial outer membrane proteins with multiple transmembrane segments. J. Cell Biol. 2007;179:1355–1363. doi: 10.1083/jcb.200702143. [DOI] [PMC free article] [PubMed] [Google Scholar]
- Ott C., Ross K., Straub S., Thiede B., Götz M., Goosmann C., Krischke M., Mueller M.J., Krohne G., Rudel T., Kozjak-Pavlovic V. Sam50 functions in mitochondrial intermembrane space bridging and biogenesis of respiratory complexes. Mol. Cell. Biol. 2012;32:1173–1188. doi: 10.1128/MCB.06388-11. [DOI] [PMC free article] [PubMed] [Google Scholar]
- Pagliarini D.J., Calvo S.E., Chang B., Sheth S.A., Vafai S.B., Ong S.-E., Walford G.A., Sugiana C., Boneh A., Chen W.K., et al. A mitochondrial protein compendium elucidates complex I disease biology. Cell. 2008;134:112–123. doi: 10.1016/j.cell.2008.06.016. [DOI] [PMC free article] [PubMed] [Google Scholar]
- Palmieri F., Monné M. Discoveries, metabolic roles and diseases of mitochondrial carriers: A review. Biochim. Biophys. Acta. 2016;1863:2362–2378. doi: 10.1016/j.bbamcr.2016.03.007. [DOI] [PubMed] [Google Scholar]
- Paschen S.A., Waizenegger T., Stan T., Preuss M., Cyrklaff M., Hell K., Rapaport D., Neupert W. Evolutionary conservation of biogenesis of beta-barrel membrane proteins. Nature. 2003;426:862–866. doi: 10.1038/nature02208. [DOI] [PubMed] [Google Scholar]
- Pedregosa F., Varoquaux G., Gramfort A., Michel V., Thirion B., Grisel O., Blondel M., Prettenhofer P., Weiss R., Dubourg V., et al. Scikit-Learn: Machine Learning in Python. J. Mach. Learn. Res. 2011;12:2825–2830. [Google Scholar]
- Peikert C.D., Mani J., Morgenstern M., Käser S., Knapp B., Wenger C., Harsman A., Oeljeklaus S., Schneider A., Warscheid B. Charting organellar importomes by quantitative mass spectrometry. Nat. Commun. 2017;8:15272. doi: 10.1038/ncomms15272. [DOI] [PMC free article] [PubMed] [Google Scholar]
- Perez-Riverol Y., Csordas A., Bai J., Bernal-Llinares M., Hewapathirana S., Kundu D.J., Inuganti A., Griss J., Mayer G., Eisenacher M., et al. The PRIDE database and related tools and resources in 2019: improving support for quantification data. Nucleic Acids Res. 2019;47(D1):D442–D450. doi: 10.1093/nar/gky1106. [DOI] [PMC free article] [PubMed] [Google Scholar]
- Pfanner N., Tropschug M., Neupert W. Mitochondrial protein import: nucleoside triphosphates are involved in conferring import-competence to precursors. Cell. 1987;49:815–823. doi: 10.1016/0092-8674(87)90619-2. [DOI] [PubMed] [Google Scholar]
- Pfanner N., Warscheid B., Wiedemann N. Mitochondrial proteins: from biogenesis to functional networks. Nat. Rev. Mol. Cell Biol. 2019;20:267–284. doi: 10.1038/s41580-018-0092-0. [DOI] [PMC free article] [PubMed] [Google Scholar]
- Rainbolt T.K., Atanassova N., Genereux J.C., Wiseman R.L. Stress-regulated translational attenuation adapts mitochondrial protein import through Tim17A degradation. Cell Metab. 2013;18:908–919. doi: 10.1016/j.cmet.2013.11.006. [DOI] [PMC free article] [PubMed] [Google Scholar]
- Rampelt H., Sucec I., Bersch B., Horten P., Perschil I., Martinou J.-C., van der Laan M., Wiedemann N., Schanda P., Pfanner N. The mitochondrial carrier pathway transports non-canonical substrates with an odd number of transmembrane segments. BMC Biol. 2020;18:2. doi: 10.1186/s12915-019-0733-6. [DOI] [PMC free article] [PubMed] [Google Scholar]
- Ran F.A., Hsu P.D., Wright J., Agarwala V., Scott D.A., Zhang F. Genome engineering using the CRISPR-Cas9 system. Nat. Protoc. 2013;8:2281–2308. doi: 10.1038/nprot.2013.143. [DOI] [PMC free article] [PubMed] [Google Scholar]
- Rappsilber J., Mann M., Ishihama Y. Protocol for micro-purification, enrichment, pre-fractionation and storage of peptides for proteomics using StageTips. Nat. Protoc. 2007;2:1896–1906. doi: 10.1038/nprot.2007.261. [DOI] [PubMed] [Google Scholar]
- Rath S., Sharma R., Gupta R., Ast T., Chan C., Durham T.J., Goodman R.P., Grabarek Z., Haas M.E., Hung W.H.W., et al. MitoCarta3.0: an updated mitochondrial proteome now with sub-organelle localization and pathway annotations. Nucleic Acids Res. 2021;49(D1):D1541–D1547. doi: 10.1093/nar/gkaa1011. [DOI] [PMC free article] [PubMed] [Google Scholar]
- Reinders J., Zahedi R.P., Pfanner N., Meisinger C., Sickmann A. Toward the complete yeast mitochondrial proteome: multidimensional separation techniques for mitochondrial proteomics. J. Proteome Res. 2006;5:1543–1554. doi: 10.1021/pr050477f. [DOI] [PubMed] [Google Scholar]
- Rhee H.W., Zou P., Udeshi N.D., Martell J.D., Mootha V.K., Carr S.A., Ting A.Y. Proteomic mapping of mitochondria in living cells via spatially restricted enzymatic tagging. Science. 2013;339:1328–1331. doi: 10.1126/science.1230593. [DOI] [PMC free article] [PubMed] [Google Scholar]
- Richter F., Dennerlein S., Nikolov M., Jans D.C., Naumenko N., Aich A., MacVicar T., Linden A., Jakobs S., Urlaub H., et al. ROMO1 is a constituent of the human presequence translocase required for YME1L protease import. J. Cell Biol. 2019;218:598–614. doi: 10.1083/jcb.201806093. [DOI] [PMC free article] [PubMed] [Google Scholar]
- Richter-Dennerlein R., Korwitz A., Haag M., Tatsuta T., Dargazanli S., Baker M., Decker T., Lamkemeyer T., Rugarli E.I., Langer T. DNAJC19, a mitochondrial cochaperone associated with cardiomyopathy, forms a complex with prohibitins to regulate cardiolipin remodeling. Cell Metab. 2014;20:158–171. doi: 10.1016/j.cmet.2014.04.016. [DOI] [PubMed] [Google Scholar]
- Richter-Dennerlein R., Oeljeklaus S., Lorenzi I., Ronsör C., Bareth B., Schendzielorz A.B., Wang C., Warscheid B., Rehling P., Dennerlein S. Mitochondrial protein synthesis adapts to influx of nuclear-encoded protein. Cell. 2016;167:471–483. doi: 10.1016/j.cell.2016.09.003. [DOI] [PMC free article] [PubMed] [Google Scholar]
- Robb E.L., Hall A.R., Prime T.A., Eaton S., Szibor M., Viscomi C., James A.M., Murphy M.P. Control of mitochondrial superoxide production by reverse electron transport at complex I. J. Biol. Chem. 2018;293:9869–9879. doi: 10.1074/jbc.RA118.003647. [DOI] [PMC free article] [PubMed] [Google Scholar]
- Roesch K., Curran S.P., Tranebjaerg L., Koehler C.M. Human deafness dystonia syndrome is caused by a defect in assembly of the DDP1/TIMM8a-TIMM13 complex. Hum. Mol. Genet. 2002;11:477–486. doi: 10.1093/hmg/11.5.477. [DOI] [PubMed] [Google Scholar]
- Ross K., Rudel T., Kozjak-Pavlovic V. TOM-independent complex formation of Bax and Bak in mammalian mitochondria during TNFalpha-induced apoptosis. Cell Death Differ. 2009;16:697–707. doi: 10.1038/cdd.2008.194. [DOI] [PubMed] [Google Scholar]
- Rouault T.A. Mammalian iron-sulphur proteins: novel insights into biogenesis and function. Nat. Rev. Mol. Cell Biol. 2015;16:45–55. doi: 10.1038/nrm3909. [DOI] [PubMed] [Google Scholar]
- Salvatori R., Kehrein K., Singh A.P., Aftab W., Möller-Hergt B.V., Forne I., Imhof A., Ott M. Molecular Wiring of a Mitochondrial Translational Feedback Loop. Mol. Cell. 2020;77:887–900. doi: 10.1016/j.molcel.2019.11.019. [DOI] [PubMed] [Google Scholar]
- Schindelin J., Arganda-Carreras I., Frise E., Kaynig V., Longair M., Pietzsch T., Preibisch S., Rueden C., Saalfeld S., Schmid B., et al. Fiji: an open-source platform for biological-image analysis. Nat. Methods. 2012;9:676–682. doi: 10.1038/nmeth.2019. [DOI] [PMC free article] [PubMed] [Google Scholar]
- Setoguchi K., Otera H., Mihara K. Cytosolic factor- and TOM-independent import of C-tail-anchored mitochondrial outer membrane proteins. EMBO J. 2006;25:5635–5647. doi: 10.1038/sj.emboj.7601438. [DOI] [PMC free article] [PubMed] [Google Scholar]
- Shiota T., Imai K., Qiu J., Hewitt V.L., Tan K., Shen H.-H., Sakiyama N., Fukasawa Y., Hayat S., Kamiya M., et al. Molecular architecture of the active mitochondrial protein gate. Science. 2015;349:1544–1548. doi: 10.1126/science.aac6428. [DOI] [PubMed] [Google Scholar]
- Shpilka T., Haynes C.M. The mitochondrial UPR: mechanisms, physiological functions and implications in ageing. Nat. Rev. Mol. Cell Biol. 2018;19:109–120. doi: 10.1038/nrm.2017.110. [DOI] [PubMed] [Google Scholar]
- Sickmann A., Reinders J., Wagner Y., Joppich C., Zahedi R., Meyer H.E., Schönfisch B., Perschil I., Chacinska A., Guiard B., et al. The proteome of Saccharomyces cerevisiae mitochondria. Proc. Natl. Acad. Sci. USA. 2003;100:13207–13212. doi: 10.1073/pnas.2135385100. [DOI] [PMC free article] [PubMed] [Google Scholar]
- Smith A.C., Robinson A.J. MitoMiner, an integrated database for the storage and analysis of mitochondrial proteomics data. Mol. Cell. Proteomics. 2009;8:1324–1337. doi: 10.1074/mcp.M800373-MCP200. [DOI] [PMC free article] [PubMed] [Google Scholar]
- Smith A.C., Robinson A.J. MitoMiner v4.0: an updated database of mitochondrial localization evidence, phenotypes and diseases. Nucleic Acids Res. 2019;47(D1):D1225–D1228. doi: 10.1093/nar/gky1072. [DOI] [PMC free article] [PubMed] [Google Scholar]
- Stefely J.A., Pagliarini D.J. Biochemistry of Mitochondrial Coenzyme Q Biosynthesis. Trends Biochem. Sci. 2017;42:824–843. doi: 10.1016/j.tibs.2017.06.008. [DOI] [PMC free article] [PubMed] [Google Scholar]
- Stoldt S., Wenzel D., Kehrein K., Riedel D., Ott M., Jakobs S. Spatial orchestration of mitochondrial translation and OXPHOS complex assembly. Nat. Cell Biol. 2018;20:528–534. doi: 10.1038/s41556-018-0090-7. [DOI] [PubMed] [Google Scholar]
- Strogolova V., Furness A., Robb-McGrath M., Garlich J., Stuart R.A. Rcf1 and Rcf2, members of the hypoxia-induced gene 1 protein family, are critical components of the mitochondrial cytochrome bc1-cytochrome c oxidase supercomplex. Mol. Cell. Biol. 2012;32:1363–1373. doi: 10.1128/MCB.06369-11. [DOI] [PMC free article] [PubMed] [Google Scholar]
- Stroud D.A., Surgenor E.E., Formosa L.E., Reljic B., Frazier A.E., Dibley M.G., Osellame L.D., Stait T., Beilharz T.H., Thorburn D.R., et al. Accessory subunits are integral for assembly and function of human mitochondrial complex I. Nature. 2016;538:123–126. doi: 10.1038/nature19754. [DOI] [PubMed] [Google Scholar]
- Suomalainen A., Battersby B.J. Mitochondrial diseases: the contribution of organelle stress responses to pathology. Nat. Rev. Mol. Cell Biol. 2018;19:77–92. doi: 10.1038/nrm.2017.66. [DOI] [PubMed] [Google Scholar]
- Szczepanowska K., Senft K., Heidler J., Herholz M., Kukat A., Höhne M.N., Hofsetz E., Becker C., Kaspar S., Giese H., et al. A salvage pathway maintains highly functional respiratory complex I. Nat. Commun. 2020;11:1643. doi: 10.1038/s41467-020-15467-7. [DOI] [PMC free article] [PubMed] [Google Scholar]
- Tatsuta T., Langer T. Prohibitins. Curr. Biol. 2017;27:R629–R631. doi: 10.1016/j.cub.2017.04.030. [DOI] [PubMed] [Google Scholar]
- Taylor E.B. Functional Properties of the Mitochondrial Carrier System. Trends Cell Biol. 2017;27:633–644. doi: 10.1016/j.tcb.2017.04.004. [DOI] [PMC free article] [PubMed] [Google Scholar]
- Taylor S.W., Fahy E., Zhang B., Glenn G.M., Warnock D.E., Wiley S., Murphy A.N., Gaucher S.P., Capaldi R.A., Gibson B.W., Ghosh S.S. Characterization of the human heart mitochondrial proteome. Nat. Biotechnol. 2003;21:281–286. doi: 10.1038/nbt793. [DOI] [PubMed] [Google Scholar]
- Tebbenkamp A.T.N., Varela L., Choi J., Paredes M.I., Giani A.M., Song J.E., Sestan-Pesa M., Franjic D., Sousa A.M.M., Liu Z.-W., et al. The 7q11.23 Protein DNAJC30 Interacts with ATP Synthase and Links Mitochondria to Brain Development. Cell. 2018;175:1088–1104. doi: 10.1016/j.cell.2018.09.014. [DOI] [PMC free article] [PubMed] [Google Scholar]
- Thul P.J., Åkesson L., Wiking M., Mahdessian D., Geladaki A., Ait Blal H., Alm T., Asplund A., Björk L., Breckels L.M., et al. A subcellular map of the human proteome. Science. 2017;356:eaal3321. doi: 10.1126/science.aal3321. [DOI] [PubMed] [Google Scholar]
- Timón-Gómez A., Nývltová E., Abriata L.A., Vila A.J., Hosler J., Barrientos A. Mitochondrial cytochrome c oxidase biogenesis: Recent developments. Semin. Cell Dev. Biol. 2018;76:163–178. doi: 10.1016/j.semcdb.2017.08.055. [DOI] [PMC free article] [PubMed] [Google Scholar]
- Tucker K., Park E. Cryo-EM structure of the mitochondrial protein-import channel TOM complex at near-atomic resolution. Nat. Struct. Mol. Biol. 2019;26:1158–1166. doi: 10.1038/s41594-019-0339-2. [DOI] [PMC free article] [PubMed] [Google Scholar]
- Tyanova S., Temu T., Sinitcyn P., Carlson A., Hein M.Y., Geiger T., Mann M., Cox J. The Perseus computational platform for comprehensive analysis of (prote)omics data. Nat. Methods. 2016;13:731–740. doi: 10.1038/nmeth.3901. [DOI] [PubMed] [Google Scholar]
- Vafai S.B., Mootha V.K. Mitochondrial disorders as windows into an ancient organelle. Nature. 2012;491:374–383. doi: 10.1038/nature11707. [DOI] [PubMed] [Google Scholar]
- van der Bliek A.M., Sedensky M.M., Morgan P.G. Cell Biology of the Mitochondrion. Genetics. 2017;207:843–871. doi: 10.1534/genetics.117.300262. [DOI] [PMC free article] [PubMed] [Google Scholar]
- Van Haute L., Lee S.-Y., McCann B.J., Powell C.A., Bansal D., Vasiliauskaitė L., Garone C., Shin S., Kim J.-S., Frye M., et al. NSUN2 introduces 5-methylcytosines in mammalian mitochondrial tRNAs. Nucleic Acids Res. 2019;47:8720–8733. doi: 10.1093/nar/gkz559. [DOI] [PMC free article] [PubMed] [Google Scholar]
- Virtanen P., Gommers R., Oliphant T.E., Haberland M., Reddy T., Cournapeau D., Burovski E., Peterson P., Weckesser W., Bright J., et al. SciPy 1.0 Contributors SciPy 1.0: fundamental algorithms for scientific computing in Python. Nat. Methods. 2020;17:261–272. doi: 10.1038/s41592-019-0686-2. [DOI] [PMC free article] [PubMed] [Google Scholar]
- von der Malsburg K., Müller J.M., Bohnert M., Oeljeklaus S., Kwiatkowska P., Becker T., Loniewska-Lwowska A., Wiese S., Rao S., Milenkovic D., et al. Dual role of mitofilin in mitochondrial membrane organization and protein biogenesis. Dev. Cell. 2011;21:694–707. doi: 10.1016/j.devcel.2011.08.026. [DOI] [PubMed] [Google Scholar]
- Vukotic M., Oeljeklaus S., Wiese S., Vögtle F.N., Meisinger C., Meyer H.E., Zieseniss A., Katschinski D.M., Jans D.C., Jakobs S., et al. Rcf1 mediates cytochrome oxidase assembly and respirasome formation, revealing heterogeneity of the enzyme complex. Cell Metab. 2012;15:336–347. doi: 10.1016/j.cmet.2012.01.016. [DOI] [PubMed] [Google Scholar]
- Vukotic M., Nolte H., König T., Saita S., Ananjew M., Krüger M., Tatsuta T., Langer T. Acylglycerol Kinase Mutated in Sengers Syndrome Is a Subunit of the TIM22 Protein Translocase in Mitochondria. Mol. Cell. 2017;67:471–483. doi: 10.1016/j.molcel.2017.06.013. [DOI] [PubMed] [Google Scholar]
- Walther D.M., Rapaport D. Biogenesis of mitochondrial outer membrane proteins. Biochim. Biophys. Acta. 2009;1793:42–51. doi: 10.1016/j.bbamcr.2008.04.013. [DOI] [PubMed] [Google Scholar]
- Ward J.H. Hierarchical Grouping to Optimize an Objective Function. J. Am. Stat. Assoc. 1963;58:236–244. [Google Scholar]
- Waskom M. seaborn: statistical data visualization. J. Open Source Softw. 2021;6:3021. [Google Scholar]
- Weidberg H., Amon A. MitoCPR-A surveillance pathway that protects mitochondria in response to protein import stress. Science. 2018;360:eaan4146. doi: 10.1126/science.aan4146. [DOI] [PMC free article] [PubMed] [Google Scholar]
- Wiedemann N., Pfanner N. Mitochondrial machineries for protein import and assembly. Annu. Rev. Biochem. 2017;86:685–714. doi: 10.1146/annurev-biochem-060815-014352. [DOI] [PubMed] [Google Scholar]
- Wiedemann N., Kozjak V., Chacinska A., Schönfisch B., Rospert S., Ryan M.T., Pfanner N., Meisinger C. Machinery for protein sorting and assembly in the mitochondrial outer membrane. Nature. 2003;424:565–571. doi: 10.1038/nature01753. [DOI] [PubMed] [Google Scholar]
- Williams E.G., Wu Y., Wolski W., Kim J.Y., Lan J., Hasan M., Halter C., Jha P., Ryu D., Auwerx J., Aebersold R. Quantifying and Localizing the Mitochondrial Proteome Across Five Tissues in A Mouse Population. Mol. Cell. Proteomics. 2018;17:1766–1777. doi: 10.1074/mcp.RA118.000554. [DOI] [PMC free article] [PubMed] [Google Scholar]
- Wiśniewski J.R., Ostasiewicz P., Duś K., Zielińska D.F., Gnad F., Mann M. Extensive quantitative remodeling of the proteome between normal colon tissue and adenocarcinoma. Mol. Syst. Biol. 2012;8:611. doi: 10.1038/msb.2012.44. [DOI] [PMC free article] [PubMed] [Google Scholar]
- Wiśniewski J.R., Hein M.Y., Cox J., Mann M. A “proteomic ruler” for protein copy number and concentration estimation without spike-in standards. Mol. Cell. Proteomics. 2014;13:3497–3506. doi: 10.1074/mcp.M113.037309. [DOI] [PMC free article] [PubMed] [Google Scholar]
- Wrobel L., Topf U., Bragoszewski P., Wiese S., Sztolsztener M.E., Oeljeklaus S., Varabyova A., Lirski M., Chroscicki P., Mroczek S., et al. Mistargeted mitochondrial proteins activate a proteostatic response in the cytosol. Nature. 2015;524:485–488. doi: 10.1038/nature14951. [DOI] [PubMed] [Google Scholar]
- Young J.C., Hoogenraad N.J., Hartl F.U. Molecular chaperones Hsp90 and Hsp70 deliver preproteins to the mitochondrial import receptor Tom70. Cell. 2003;112:41–50. doi: 10.1016/s0092-8674(02)01250-3. [DOI] [PubMed] [Google Scholar]
- Zecha J., Meng C., Zolg D.P., Samaras P., Wilhelm M., Kuster B. Peptide Level Turnover Measurements Enable the Study of Proteoform Dynamics. Mol. Cell. Proteomics. 2018;17:974–992. doi: 10.1074/mcp.RA118.000583. [DOI] [PMC free article] [PubMed] [Google Scholar]
- Zeharia A., Friedman J.R., Tobar A., Saada A., Konen O., Fellig Y., Shaag A., Nunnari J., Elpeleg O. Mitochondrial hepato-encephalopathy due to deficiency of QIL1/MIC13 (C19orf70), a MICOS complex subunit. Eur. J. Hum. Genet. 2016;24:1778–1782. doi: 10.1038/ejhg.2016.83. [DOI] [PMC free article] [PubMed] [Google Scholar]
- Zeng X., Neupert W., Tzagoloff A. The metalloprotease encoded by ATP23 has a dual function in processing and assembly of subunit 6 of mitochondrial ATPase. Mol. Biol. Cell. 2007;18:617–626. doi: 10.1091/mbc.E06-09-0801. [DOI] [PMC free article] [PubMed] [Google Scholar]
- Zhang Y., Wen Z., Washburn M.P., Florens L. Improving label-free quantitative proteomics strategies by distributing shared peptides and stabilizing variance. Anal. Chem. 2015;87:4749–4756. doi: 10.1021/ac504740p. [DOI] [PubMed] [Google Scholar]
- Zhang S., Reljić B., Liang C., Kerouanton B., Francisco J.C., Peh J.H., Mary C., Jagannathan N.S., Olexiouk V., Tang C., et al. Mitochondrial peptide BRAWNIN is essential for vertebrate respiratory complex III assembly. Nat. Commun. 2020;11:1312. doi: 10.1038/s41467-020-14999-2. [DOI] [PMC free article] [PubMed] [Google Scholar]
- Zhou W., Ma D., Sun A.X., Tran H.-D., Ma D.-L., Singh B.K., Zhou J., Zhang J., Wang D., Zhao Y., et al. PD-linked CHCHD2 mutations impair CHCHD10 and MICOS complex leading to mitochondria dysfunction. Hum. Mol. Genet. 2019;28:1100–1116. doi: 10.1093/hmg/ddy413. [DOI] [PMC free article] [PubMed] [Google Scholar]
Associated Data
This section collects any data citations, data availability statements, or supplementary materials included in this article.
Supplementary Materials
Data Availability Statement
-
•
MS proteomics data have been deposited to the ProteomeXchange Consortium via the PRIDE (Perez-Riverol et al., 2019) partner repository and are publicly available as of the date of publication. Accession numbers are listed in the key resource table.
-
•
The paper does not report original code.
-
•
Any additional information required to reanalyze the data reported in this paper is available from the lead contact upon request.