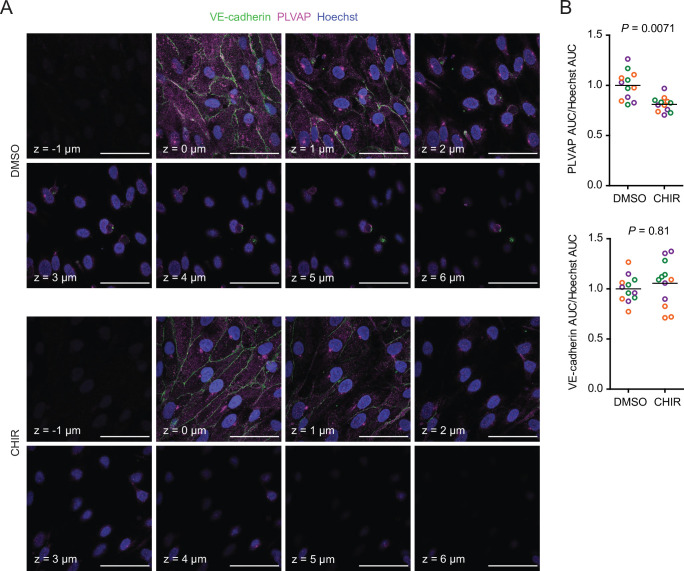
Figure 3. Effect of CHIR on endothelial PLVAP expression.
(A) Confocal immunocytochemistry analysis of VE-cadherin and PLVAP expression in Passage 1 endothelial cells (ECs) treated with DMSO or CHIR. Hoechst nuclear counterstain is overlaid. Eight serial confocal Z-slices with 1 μm spacing are shown. Scale bars: 50 μm. (B) Quantification of PLVAP and VE-cadherin area under the curve (AUC) of mean fluorescence intensity versus Z-position normalized to Hoechst AUC. Points represent replicate wells from three independent differentiations of the IMR90-4 line, each differentiation indicated with a different color. Bars indicate mean values, with values normalized within each differentiation such that the mean of the DMSO condition equals 1. p-values: two-way ANOVA on unnormalized data.

