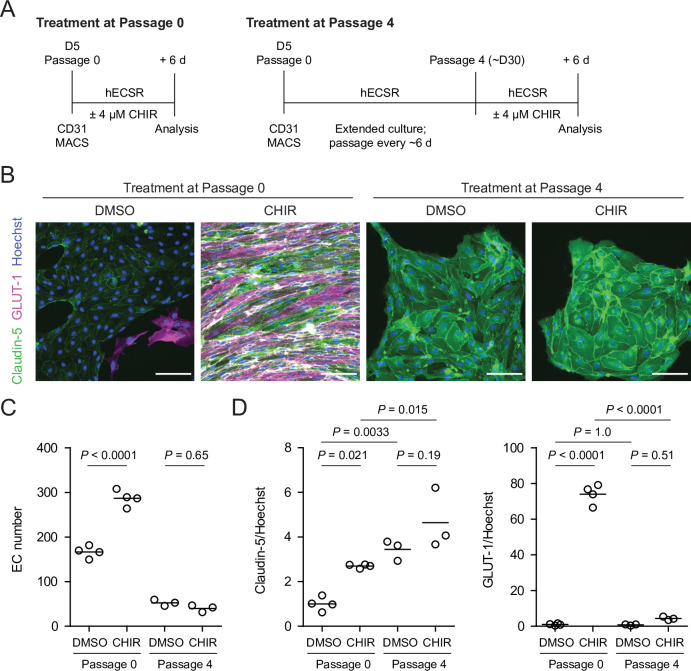
Figure 6. Effect of CHIR treatment in endothelial progenitor cells (EPCs) and matured endothelium.
(A) Overview of the endothelial differentiation, extended culture, and CHIR treatment protocols. (B) Immunocytochemistry analysis of claudin-5 and GLUT-1 expression in endothelial cells (ECs) treated with DMSO or CHIR as outlined in (A). Images from the IMR90-4 line are shown. Hoechst nuclear counterstain is overlaid. Scale bars: 100 μm. (C) Quantification of images from the conditions described in (B) for number of ECs per 30× field. Points represent replicate wells from one differentiation of the IMR90-4 line. Bars indicate mean values. p-values: ANOVA followed by Tukey’s honest significant difference (HSD) test. (D) Quantification of images from the conditions described in (B) for GLUT-1 and claudin-5 mean fluorescence intensity normalized to Hoechst mean fluorescence intensity within the area of claudin-5+ ECs only. Points represent replicate wells from one differentiation of the IMR90-4 line. Bars indicate mean values, with values normalized such that the mean of the DMSO condition equals 1. p-values: ANOVA followed by Tukey’s HSD test.


