Abstract
A real-time PCR assay for quantitation of Kaposi's sarcoma-associated herpes virus (KSHV or human herpesvirus 8) DNA was evaluated. The linear dynamic range was 10 to 105 copies of KSHV DNA (r2 > 0.99). The accuracy of DNA purification and quantitation was less than ±0.4 log10 copies for samples that contained from 10 to 105 copies of KSHV DNA. Cell-associated KSHV DNA was quantitated over a range of infected cell frequencies from 0.1 to 10−5, and cell-free KSHV DNA in plasma was quantitated over a range of 100 to 106 copies/ml. Real-time PCR provides a convenient method for quantitation of cell-free and cell-associated KSHV DNA in laboratory and clinical specimens.
Detection of Kaposi's sarcoma-associated herpesvirus (KSHV) DNA in peripheral blood mononuclear cells (PBMC) from human immunodeficiency virus type 1-infected persons is associated with an increased risk of subsequent development of Kaposi's sarcoma (13, 15) and with Kaposi's sarcoma clinical stage (3, 10). However, previous studies of the relationship between peripheral blood KSHV load and Kaposi's sarcoma pathogenesis were limited by the use of qualitative or semiquantitative estimates of KSHV load. Techniques that provide accurate and reproducible measurements of the amount of KSHV in the circulatory compartment are needed.
Real-time quantification of specific PCR products allows the accurate determination of the amount of DNA template present at the start of the reaction (for reviews, see references 6 and 7). During each PCR cycle, the amount of fluorescence that occurs when a fluorogenic oligonucleotide probe is activated by 5′ to 3′ exonuclease activity of Taq polymerase after binding to a specific PCR product is monitored (Taqman PCR). The number of PCR cycles required to reach a threshold fluorescence (CT) is determined for each sample, and the measured value of CT is compared to the values of standards with known DNA template concentrations to determine the starting template concentration in the sample. Because CT is determined during the exponential phase of PCR, the value of CT has a linear relationship to the logarithm of the template DNA concentration. The purpose of the present study was to evaluate the performance of a real-time PCR assay to quantitate both cell-free and cell-associated KSHV DNA.
The real-time PCR assay used forward (5′-CTCGAATCCAACGGATTTGAC-3′) and reverse (5′-TGCTGCAGAATAGCGTGCC-3′) primers (Oligos Etc., Wilsonville, Oreg.) and the fluorogenic Taqman probe (5′-CCATGGTCGTGCCGCAGCA-3′; PE Applied Biosystems, Foster City, Calif.) to amplify and detect a 74-base pair amplicon in the KSHV minor capsid protein gene (open reading frame 26, from nucleotides 47311 to 47384 of the KSHV genome). The nucleotide sequence targeted by the primers and probe is highly conserved amongst isolates from the three major subgroups of KSHV (2, 5, 14, 16). To prepare KSHV DNA standards, a plasmid (pMCP) that contains nucleotides 47239 to 47554 of the KSHV genome was linearized with HindIII and serially diluted into a salmon sperm DNA carrier so that the total DNA concentration in all standards was 0.2 μg/μl.
Human blood specimens were separated into plasma and PBMC by centrifugation in Vacutainer cell preparation tubes containing 0.1 M sodium citrate according to the manufacturer's instructions (Becton Dickinson, Franklin Lakes, N.J.). BCP-1 cell growth conditions and the BCP-1 cell immunofluorescent assay to detect antibodies to KSHV latency-associated nuclear antigen were as previously described (12). Prior to DNA extraction, PBMC or BCP-1 cells were washed with phosphate-buffered saline and stored at −70°C as a dry pellet of 3 × 10⁶ cells.
Frozen cell pellets were thawed and resuspended in 200 μl of phosphate-buffered saline, and DNA was extracted and purified with the QIAamp Blood kit (Qiagen, Inc., Chatsworth, Calif.). Purified cell DNA was quantitated by absorption spectroscopy at 260 nm and by real-time PCR quantification of human β-actin DNA with Taqman β-actin reagents according to the manufacturer's instructions (PE Applied Biosystems). Culture supernatants or plasma was centrifuged at 500 × g for 15 min to remove cell debris, and the DNA present in 0.2 ml of clarified culture supernatant or plasma was extracted and purified with the QIAamp Blood kit after the addition of 10 μg of salmon sperm DNA as a carrier. Prior to use in PCRs, the DNA concentration of all samples was adjusted to 0.2 μg/μl. During all DNA extractions and purifications, strict precautions were taken to reduce the risk of false-positive results (9).
Each PCR contained 2 μg of sample DNA (10 μl), 0.3 μM forward and 0.9 μM reverse primers, 0.2 μM fluorogenic Taqman probe, 0.3 mM (each) dATP, dCTP, and dGTP, 0.6 mM dUTP, 50 mM KCl, 10 mM Tris-HCl (pH 8.3), 10 mM EDTA, 5.5 mM MgCl2, and 1.25 U of Taq polymerase in a final volume of 50 μl. PCR mixtures were incubated at 95°C for 12 min and then cycled at 95°C for 15 s and 60°C for 1 min for a total of 50 cycles in an ABI PRISM 7700 Sequence Detection system. The KSHV DNA copy number per microgram of PBMC DNA was converted to KSHV DNA copy numbers per 105 PBMC with 6.6 × 10⁹ base pairs as an estimate of the size of the diploid human genome. The value of CT was determined by the first cycle number at which fluorescence was greater than or equal to 10 times the background. All PCR analyses were performed by a person who was blinded to the identity of the samples.
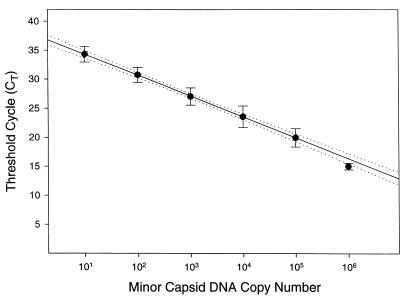
In replicate independent experiments, the value of CT had a linear relationship with the logarithm of the amount of minor capsid DNA added to a PCR (Fig. 1). This relationship extended over a 10,000-fold range, from 10 to 105 copies of KSHV minor capsid gene DNA. The values of CT obtained with 106 copies of KSHV minor capsid gene DNA differed significantly from the linear relationship. Based on these findings, all subsequent experiments used serial 10-fold dilutions of KSHV minor capsid DNA (from 10 to 105 copies per reaction) as a standard curve to determine the amount of KSHV DNA in samples. If the estimated KSHV DNA copy number in a PCR was greater than 105, the sample DNA was diluted 10- to 1,000-fold into salmon sperm carrier DNA, and PCR quantitation was repeated.
FIG. 1.
Relationship of threshold cycle to KSHV minor capsid DNA copy number. The number of minor capsid DNA copies present in a PCR reaction is indicated on the x axis, and the cycle number in which fluorescence exceeded background is indicated on the y axis (CT). For data obtained with 10 to 105 copies, the values of CT are the mean of 12 replicates from seven independent experiments. The value of CT at 106 copies is the mean of four replicates from two independent experiments. Error bars indicate the standard deviation for values of CT. The solid line was obtained by linear regression analysis of the data from 10 to 105 copies (r2 > 0.99; P < 0.001), and dotted lines indicate the 95% confidence intervals for the regression.
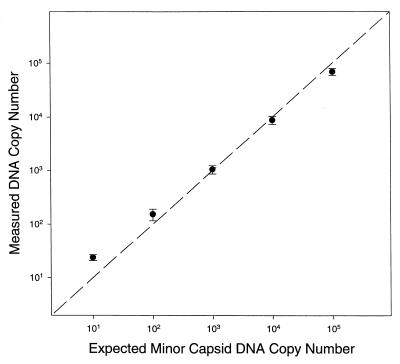
The accuracy of KSHV DNA purification and quantitation was determined by extraction of DNA from replicate samples that contained from 10 to 105 copies of minor capsid DNA. The amount of KSHV DNA present in the purified preparations was determined by real-time PCR and compared to the amount that was expected if recovery was 100% (Fig. 2). The accuracy (i.e., the difference between the true copy number value and the measured value) of DNA purification and quantitation was ±0.37 log10 for samples that contained 10 copies of minor capsid DNA and was less than ±0.2 log10 for samples that contained between 100 and 105 copies of minor capsid DNA. The 95% confidence interval for the intersample variation (the sum of the variances from the mean of replicate samples) was ±0.14 log10. Thus, the method used for extraction and purification of DNA gave quantitative recovery of template DNA over a 10,000-fold range of template DNA concentrations.
FIG. 2.
Accuracy and reproducibility of minor capsid DNA quantitation. The x axis indicates the expected copy number and the y axis indicates the measured copy number in each PCR. Data points and error bars are the values of the mean and standard deviation of triplicate DNA extractions and purifications. The dashed line indicates the relationship expected if the accuracy of minor capsid DNA quantitation was 100% (i.e., if y = x).
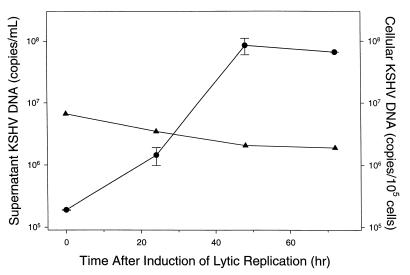
The ability of the assay to detect and quantitate KSHV DNA in cultured cells was assessed by the induction of KSHV lytic replication in latently infected BCP-1 cells. Induction of viral lytic replication in BCP-1 cells with 3 mM n-butyrate resulted in a 450-fold increase in the amount of KSHV DNA in the culture supernatant within 48 h (Fig. 3). In contrast, the amount of cell-associated DNA decreased slightly after the induction of lytic replication, from an estimated 67 copies per latently infected cell to 21 copies per cell at 48 h after induction of lytic replication. Our estimate of 67 copies of KSHV DNA per latently infected BCP-1 cell by real-time PCR is within our margin of error (±0.4 log10 copies), similar to a previously reported value of 150 KSHV genomes per BCP-1 cell (4).
FIG. 3.
Quantitation of KSHV DNA in virions and infected cells. BCP-1 cells were treated with n-butyrate at time zero. Samples were removed from the culture at the indicated time points, and the amount of KSHV DNA present in purified DNA was determined by real-time PCR. Solid circles and error bars indicate the mean and range of KSHV DNA levels determined for duplicate supernatant samples. Solid triangles indicate the amount of cell-associated DNA obtained from single BCP-1 cell samples.
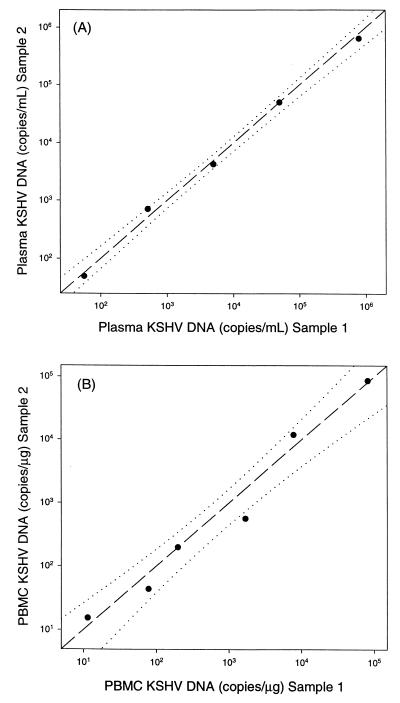
The performance of real-time PCR for the quantitation of cell-free KSHV DNA in human plasma was determined by serial dilution of the 72-h culture supernatant from induced BCP-1 cells into plasma from a KSHV-seronegative donor. Analysis of DNA purified from the duplicate plasma samples found that cell-free KSHV DNA could be detected and quantitated in human plasma at levels ranging from 100 to 106 copies/ml (Fig. 4A). The 95% confidence interval for the intersample variation among duplicate plasma samples was ±0.09 log10 copies/ml. The 72-h culture supernatant used in this experiment contained 7.8 log10 copies of KSHV DNA/ml (Fig. 3). After a 1:100 dilution of this culture supernatant into human plasma, the measured amount of KSHV DNA was 5.9 log10 copies/ml. Since the measured value was, within error, similar to the expected value of 5.8 log10 copies/ml, this finding provides evidence that quantitation of cell-free KSHV DNA was not affected by human plasma.
FIG. 4.
Quantitation of KSHV DNA in plasma and PBMC. (A) Culture supernatant from lytic cycle-induced BCP-1 cells was diluted in plasma from a KSHV-seronegative donor. (B) Latently infected BCP-1 cells were diluted in PBMC from a KSHV-seronegative donor. Two replicate DNA extractions, purifications, and PCR analyses were performed for each data point. Dashed lines indicate the relationships expected for 100% reproducibility (y = x). Dotted lines indicate 95% confidence intervals for linear regression of the data.
The performance of real-time PCR for quantitation of cell-associated KSHV DNA was evaluated by serial dilution of latently infected BCP-1 cells into PBMC from a KSHV-seronegative donor. Each dilution was split into duplicate samples that contained 3 × 10⁶ cells, and the DNA present in each duplicate was extracted and purified. Real-time PCR analysis of purified DNA from the duplicate samples found that KSHV-infected cells could be detected and quantitated over a range of infected cell frequencies from 0.1 to 10−5 (from 5 to 5 × 10⁴ copies/μg of PBMC DNA [Fig. 4B]). The 95% confidence interval for the intersample variation among duplicate PBMC samples was ±0.24 log10 copies/mg.
Since clinical specimens are sometimes exposed to conditions that affect subsequent DNA quantitation, we determined the effects of room temperature incubation and multiple freeze-thaw cycles on KSHV DNA in plasma and culture supernatant. Although the amount of KSHV DNA in plasma was not affected by incubation at room temperature for 48 h (≤0.1 log10 copies/ml decrease from baseline), the amount of KSHV DNA present in BCP-1 culture supernatant decreased 0.5 log10 after 48 h at room temperature. The amount of KSHV DNA in plasma or culture supernatant was not affected by five freeze-thaw cycles (≤0.1 log10 copies/ml decrease from baseline).
The specificity of real-time PCR quantitation of KSHV DNA was evaluated by analysis of plasma and PBMC samples collected from eight KSHV- and human immunodeficiency virus type 1-seronegative American female laboratory workers. In all eight samples, the amount of human genomic DNA present in the purified PBMC DNA specimens estimated by real-time β-actin DNA quantitation was similar to the expected level of 0.2 μg/μl (estimated by absorbance at 260 nm). Thus, in all cases the purified PBMC DNA was of sufficient quality for use in quantitative real-time PCR. Quantifiable levels of KSHV DNA were not detected in any of eight plasma and PBMC specimens. For a single PBMC specimen, fluorescence exceeded background in cycle 37 of PCR amplification, but the value of CT corresponded to a KSHV DNA level of 0.2 copies/2 μg of PBMC DNA (a value below the theoretical minimum level of detection of 1 copy/2 μg). This finding suggests that nonspecific amplification signals may occur in later PCR cycles, and the specificity of the assay for detecting PBMC KSHV DNA at levels less than 5 copies/μg is unknown.
In summary, we have described a real-time PCR assay for quantitation of both cell-free and cell-associated KSHV DNA in clinical and laboratory samples. The sensitivity and linear range of the real-time PCR assay is similar to those of previously described quantitative competitive PCR KSHV DNA assays (1, 8, 11). However, compared to quantitative competitive PCR, the real-time PCR assay is performed in a single closed tube and does not require post-PCR analysis of PCR product. Since the real-time PCR assay is performed in a 96-well format, it also provides convenient analysis of large numbers of samples. Our findings suggest that real-time PCR quantitation of KSHV DNA will be useful for future studies on peripheral blood KSHV load.
Acknowledgments
PCR assays were performed by Uma Pugazhenthi in the Quantitative PCR Laboratory of the University of Colorado Cancer Center.
This work was supported by a grant from the National Cancer Institute (CA79398).
REFERENCES
- 1.Boivin G, Gaudreau A, Toma E, Lalonde R, Routy J P, Murray G, Handfield J, Bergeron M G. Human herpesvirus 8 DNA load in leukocytes of human immunodeficiency virus-infected subjects: correlation with the presence of Kaposi's sarcoma and response to anticytomegalovirus therapy. Antimicrob Agents Chemother. 1999;43:377–380. doi: 10.1128/aac.43.2.377. [DOI] [PMC free article] [PubMed] [Google Scholar]
- 2.Caterino-de-Araujo A. Human herpesvirus 8 group B and C variants circulating in Sao Paulo, Brazil. J Infect Dis. 1998;177:1136–1137. doi: 10.1086/515242. [DOI] [PubMed] [Google Scholar]
- 3.Cattani P, Capuano M, Lesnoni La Parola I, Guido R, Santangelo R, Cerimele F, Masini C, Nanni G, Fadda G, Cerimele D. Human herpesvirus 8 in Italian HIV-seronegative patients with Kaposi sarcoma. Arch Dermatol. 1998;134:695–699. doi: 10.1001/archderm.134.6.695. [DOI] [PubMed] [Google Scholar]
- 4.Drexler H G, Uphoff C C, Gaidano G, Carbone A. Lymphoma cell lines: in vitro models for the study of HHV-8+ primary effusion lymphomas (body cavity-based lymphomas) Leukemia. 1998;12:1507–1517. doi: 10.1038/sj.leu.2401160. [DOI] [PubMed] [Google Scholar]
- 5.Foreman K E, Alkan S, Krueger A E, Panella J R, Swinnen L J, Nickoloff B J. Geographically distinct HHV-8 DNA sequences in Saudi Arabian iatrogenic Kaposi's sarcoma lesions. Am J Pathol. 1998;153:1001–1004. doi: 10.1016/S0002-9440(10)65642-8. [DOI] [PMC free article] [PubMed] [Google Scholar]
- 6.Freeman W M, Walker S J, Vrana K E. Quantitative RT-PCR: pitfalls and potential. BioTechniques. 1999;26:112–125. doi: 10.2144/99261rv01. [DOI] [PubMed] [Google Scholar]
- 7.Heid C A, Stevens J, Livak K J, Williams P M. Real time quantitative PCR. Genome Res. 1996;6:986–994. doi: 10.1101/gr.6.10.986. [DOI] [PubMed] [Google Scholar]
- 8.Hoang M P, Barton Rogers B, Dawson B, Scheuermann R H. Quantitation of 8 human herpesviruses in peripheral blood of human immunodeficiency virus-infected patients and healthy blood donors by polymerase chain reaction. Am J Clin Pathol. 1999;111:655–659. doi: 10.1093/ajcp/111.5.655. [DOI] [PubMed] [Google Scholar]
- 9.Kwok S, Higuchi R. Avoiding false positives with PCR. Nature. 1990;339:237–238. doi: 10.1038/339237a0. [DOI] [PubMed] [Google Scholar]
- 10.Lebbe C, Agbalika F, de Cremoux P, Deplanche M, Rybojad M, Masgrau E, Morel P, Calvo F. Detection of human herpesvirus 8 and human T-cell lymphotropic virus type 1 sequences in Kaposi sarcoma. Arch Dermatol. 1997;133:25–30. [PubMed] [Google Scholar]
- 11.Lock M J, Griffiths P D, Emery V C. Development of a quantitative competitive polymerase chain reaction for human herpesvirus 8. J Virol Methods. 1997;64:19–26. doi: 10.1016/s0166-0934(96)02139-8. [DOI] [PubMed] [Google Scholar]
- 12.Moore P S, Gao S, Dominguez G, Cesarman E, Lungu O, Knowles D M, Garber R, Pellett P E, McGeoch D J, Chang Y. Primary characterization of a herpesvirus agent associated with Kaposi's sarcoma. J Virol. 1996;70:549–558. doi: 10.1128/jvi.70.1.549-558.1996. [DOI] [PMC free article] [PubMed] [Google Scholar]
- 13.Moore P S, Kingsley L A, Holmberg S D, Spira T, Gupta P, Hoover D R, Parry J P, Conley L J, Jaffe H W, Chang Y. Kaposi's sarcoma-associated herpesvirus infection prior to onset of Kaposi's sarcoma. AIDS. 1996;10:175–180. doi: 10.1097/00002030-199602000-00007. [DOI] [PubMed] [Google Scholar]
- 14.Poole L J, Zong J, Ciufo D M, Alcendor D J, Cannon J S, Ambinder R, Orenstein J M, Reitz M S, Hayward G S. Comparison of genetic variability at multiple loci across the genomes of the major subtypes of Kaposi's sarcoma-associated herpesvirus reveals evidence for recombination and for two distinct types of open reading frame K15 alleles at the right-hand end. J Virol. 1999;73:6646–6660. doi: 10.1128/jvi.73.8.6646-6660.1999. [DOI] [PMC free article] [PubMed] [Google Scholar]
- 15.Whitby D, Howard M R, Tenant-Flowers M, Brink N S, Copas A, Boshoff C, Hatzioannou T, Suggett F E A, Aldam D M, Denton A S, Miller R F, Weller I V D, Weiss R A, Tedder R S, Schulz T F. Detection of Kaposi's sarcoma associated herpes virus in peripheral blood of HIV-infected individuals and progression to Kaposi's sarcoma. Lancet. 1995;346:799–802. doi: 10.1016/s0140-6736(95)91619-9. [DOI] [PubMed] [Google Scholar]
- 16.Zong J-C, Metroka C, Reitz M S, Nicholas J, Hayward G S. Strain variability among Kaposi sarcoma-associated herpesvirus (human herpesvirus 8) genomes: evidence that a large cohort of United States AIDS patients may have been infected by a single common isolate. J Virol. 1997;71:2505–2511. doi: 10.1128/jvi.71.3.2505-2511.1997. [DOI] [PMC free article] [PubMed] [Google Scholar]


