

Abstract
Background:
Diagnosis of non-esophageal eosinophilic gastrointestinal disorders requires quantification of tissue eosinophils. Our objective was to evaluate eosinophil peroxidase (EPX) immunohistochemistry (IHC) as a method for histologic diagnosis of eosinophilic gastritis (EG) and eosinophilic duodenitis (EoD).
Methods:
We performed a retrospective analysis of biopsies from pediatric EG/EoD cases and controls. Subjects with EG or EoD had ≥30 eosinophils per high power field (eos/hpf) in ≥5 hpf in the stomach and/or ≥3 hpf in the duodenum, respectively. Controls had no histopathologic diagnosis recorded. Tissue eosinophil counts were assessed by hematoxylin & eosin stains. EPX stains were assessed using a unique histopathologic scoring system. Slides were digitized and EPX+ staining area/mm2 was quantified by image analysis.
Results:
Twenty-six EG/EoD cases and 40 controls were analyzed. EPX scores and EPX/mm2 levels were markedly elevated in EG/EoD (p≤0.0001). Eosinophil density (eos/mm2) correlated strongly with EPX scores and EPX/mm2 levels in the stomach (r≥0.77) and moderately with EPX scores and EPX/mm2 levels in the duodenum (r≥0.52); (p<0.0001). EPX quantification identified EG/EoD subjects with high diagnostic accuracy (EPX score: AUC=1 for EG and EoD; EPX/mm2: AUC=0.98 (95%CI 0.96-1) for EG, AUC=0.91 (95%CI 0.81-1) for EoD).
Conclusion:
EPX-based assessment of eosinophilic inflammation may facilitate automated histologic diagnosis.
Keywords: eosinophilic gastritis, eosinophilic gastroenteritis, eosinophilic esophagitis, image analysis, digital pathology
Introduction
Eosinophilic gastrointestinal disorders (EGIDs) are defined by symptoms of esophageal or gastrointestinal dysfunction and eosinophilic inflammation of the gastrointestinal tract in the absence of other causes of tissue eosinophilia or underlying inflammatory disease.1–3 Classification of EGIDs as eosinophilic esophagitis (EoE), eosinophilic gastritis (EG), eosinophilic duodenitis (EoD)/eosinophilic enteritis or eosinophilic colitis (EC) is based on the nature of the clinical symptoms and location of tissue eosinophilia. EoE is the most prevalent EGID and has well-defined diagnostic criteria.2,4 EoD was first recognized by Kaijser in 1937 5; however, consensus guidelines for EG/EoD diagnosis have not been developed. This is likely due to the following factors:
Non-esophageal EGIDs are relatively rare. The prevalence of non-esophageal EGIDs is between 3.3 and 8.4 cases/100,000 persons compared to 10 and 57 cases/100,000 for EoE.4,6,7
Eosinophils are resident cells in the gastric and intestinal mucosa of healthy individuals. This is in contrast to the esophagus where any tissue eosinophilia is abnormal.8
Assessment of eosinophilic inflammation requires manual quantification of tissue eosinophils – a process that is time-consuming and labor intensive for pathologists.
Proposed histologic criteria for EG/EoD are defined as ≥30 eosinophils per high power field (eos/hpf) in at least 5 hpf in the gastric mucosa and ≥30 eos/hpf in at least 3 hpf in the duodenal mucosa with associated architectural disruption.9,10 Eosinophil peroxidase (EPX) is an eosinophil-specific secondary granule protein.11 We have previously demonstrated the utility of EPX staining in multiple allergic diseases, including EoE.12–15 In EoE, a majority of tissue eosinophils undergo cytolytic degranulation16; as a result, quantification of intact eosinophils by conventional staining may underestimate the degree and extent of eosinophilic inflammation.17,18 We hypothesized that the same would be true in non-esophageal EGIDs and that EPX would serve as a histologic marker of disease activity in EG/EoD. In this study we adapted our novel EPX histopathologic scoring system for gastrointestinal biopsies obtained from pediatric subjects with EG/EoD and controls.15 To overcome inefficiencies with manual counting of eosinophils we also applied a novel semi-automated detection method for assessing EPX staining in gastrointestinal biopsy samples.12
Materials and Methods
Study Population
We performed a retrospective analysis of clinical information and gastrointestinal biopsies collected during clinically indicated endoscopies from children ages 0-18 years old at Phoenix Children’s Hospital from 2012 to 2017. This study was approved by the Phoenix Children’s Hospital Institutional Review Board (PCH IRB #16-040, Approved 10/20/2016). A convenience sample of subjects with EG/EoD was identified using ICD-9 (535.70, 558.41) and ICD-10 (K52.81) codes for EG/EoD. A chart review was conducted (SS) to ensure each participant with EG/EoD met the following inclusion criteria: (1) symptoms of gastrointestinal dysfunction (e.g. abdominal pain, vomiting, failure to thrive, or diarrhea) and (2) exclusion of other causes of gastrointestinal eosinophilia. Existing hematoxylin and eosin (H&E) stains of gastrointestinal biopsies were then reviewed by a single pathologist (SG) to ensure they met histologic criteria for EG/EoD based on pre-specified eosinophil thresholds in at least one gastric or duodenal biopsy (see case definitions below). Gastric or duodenal sections from EG/EoD subjects without tissue eosinophilia based on the clinical pathology report were excluded from the analysis. CoPath (Sunquest Information Systems, Tucson, AZ), a pathology lab information system, was used to identify control subjects among patients with archived, paraffin-embedded gastrointestinal biopsies at Phoenix Children’s Hospital. Controls underwent upper endoscopy for similar clinical indications but did not have a pathologic diagnosis.
Case Definitions, Clinical Data, and Endoscopic Findings
A histopathologic diagnosis of EG was based on the presence of ≥30 eos/hpf in mucosal biopsies of the gastric body or gastric antrum in at least 5 hpf based on the histologic threshold published by Lwin et al.9 Patients with EoD were required to have ≥30 eos/hpf in at least 3 hpf in the duodenal bulb or duodenal body. There are no consensus guidelines for histologic diagnosis of EG/EoD; however these criteria have been used in a recent clinical trial.10 Relevant information including demographics, medical history, atopic comorbidities, clinical symptoms, and final diagnosis were obtained from the electronic health record. Endoscopic findings were evaluated retrospectively based on images and descriptions provided in the clinical endoscopy report. Specifically, we evaluated the gastric and duodenal segments for the presence of ulceration, superficial hemorrhage/erythema, hyperplastic gastric folds, and gastric nodularity. We also evaluated the esophagus for erosions, edema, linear furrows, exudates or micro-abscesses, rings and strictures.
Histopathology
The initial microscopic analysis was performed using a Nikon Eclipse 50i microscope (Nikon Instruments, Melville, NY) with a 40x/0.65 lens and a 10x eyepiece with a field diameter of 22. This provided an hpf diameter of 0.55mm and an area of 0.24mm2. H&E slides were assessed by a single board-certified anatomic pathologist (SG) for eosinophil counts in 5 hpf for gastric biopsies and 3 hpf for duodenal biopsies. Biopsies were subsequently assessed for the following histologic features: (1) sheets of eosinophils in the lamina propria; (2) eosinophilic glandulitis or infiltration of the surface lining epithelium of gastric foveolae; (3) eosinophilic gland micro-abscesses (≥4 eosinophils clustered together); (4) eosinophil involvement of the muscularis mucosae or submucosa; and (5) intraepithelial eosinophil infiltration (scored on a scale of 0-2: 0 – absent, 1 – mild/rare and 2 – moderate to marked).
EPX Immunohistochemistry
EPX was assessed using a proprietary mouse monoclonal anti-EPX antibody (clone MM25-82.2) validated for immunohistochemical staining.15 Tissue sectioning and IHC staining was performed at the histology department (Phoenix Children’s Hospital, Phoenix, AZ) using the Leica Bond III platform (Leica). Training in EPX scoring and image analysis was provided (BLW). Slides were reviewed with Dr. Wright to ensure consistency and accuracy with both techniques. Slides were scored (ST) using a modified version of the EPX scoring system previously developed for EoE15. The primary adaptation of this score was to increase the ranges assigned to the scores for peak and average eosinophil counts as eosinophils are resident cells in the gastric and intestinal mucosae. EPX stains were scored based on reproducibility, patchiness, degranulation, peak eosinophil infiltration, and average eosinophil infiltration. In addition to manual assessment using the EPX scoring system, we quantified tissue EPX levels using semi-automated image analysis as previously described (SHH). Tissue sections were digitized (Aperio AT Turbo, Leica Biosystems) and EPX staining was measured using Aperio ImageScope software. Additional details regarding methods for EPX staining, the EPX EG/EoD scoring system, and image analysis are found in the Supplement of this article’s online repository.
Statistical Analysis
The study was powered for the receiver operating characteristic (ROC) curve analysis of EPX. Assuming α = 0.05 and β = 0.8 and using an allocation ratio of 1.5:1, we estimated we would need to analyze at least 20 biopsies from controls and 13 biopsies from EG/EoD cases in order to detect an AUC of 0.75 (modest clinical utility). Categorical variables were compared using a Fisher’s exact test. Non-parametric statistics (Mann-Whitney-U) were used to compare eosinophil densities (eos/mm2), EPX scores, and EPX levels (EPX/mm2). Correlations between eos/mm2, EPX scores and EPX/mm2 were assessed by Spearman’s correlation analysis. The sensitivity and specificity of the EPX score and EPX/mm2 were assessed by generating receiver operating characteristic (ROC) curves and Youden’s index as used to determine cutoffs for EG/EoD diagnosis. Statistical comparisons and plots were generated using GraphPad Prism version 8.0.2 for Windows (GraphPad software, San Diego, CA).
Results
Study Population
The flow diagram in Supplemental Figure 1 details the subjects and biopsy specimens analyzed. We identified 36 subjects diagnosed with EG and/or EoD based on ICD-9/ICD-10 codes. Of these, 26 met pre-defined eosinophil density thresholds in at least one biopsy of stomach (gastric body or antrum) and/or duodenum (duodenal bulb or body). Forty control subjects without a specific histologic diagnosis or eosinophilia noted on the pathology report were randomly selected for comparison. Demographic and clinical information including sex, ethnicity, age, co-morbid atopy, clinical symptoms, endoscopic findings, and final diagnosis is found in Table 1. A majority of EG/EoD subjects had a history of atopy and abdominal pain. The most common allergic disease seen among EG/EoD patients was allergic rhinitis. Half of EG/EoD patients had co-morbid EoE. Among controls, functional gastrointestinal disorder was the most common diagnosis.
Table 1.
Study Population Characteristics
| Controls (n=40) | EGID cases (n=26) | p value* | |
|---|---|---|---|
| Males (n, %) | 11 (27.5) | 12 (46.2) | NS |
|
|
|||
| Race (n, %) | |||
|
|
|||
| White | 24 (60) | 22 (84.6) | NS |
|
|
|||
| Black/African American | 1 (2.5) | 3 (11.5) | NS |
|
|
|||
| Native American | 1 (2.5) | 0 | NS |
|
|
|||
| Other | 7 (17.5) | 1 (3.8) | NS |
|
|
|||
| Ethnicity (n, %) | |||
|
|
|||
| Hispanic | 6 (15) | 1 (3.8) | NS |
|
|
|||
| Age (median yrs, (IQR)) | 9.5 (5-15.75) | 11.5 (7-16) | NS |
|
|
|||
| Atopy (any) (n, %) | 6 (15) | 25 (96.2) | p < 0.0001 |
|
|
|||
| Allergic rhinitis | 4 (10) | 16 (61.5) | p < 0.0001 |
|
|
|||
| Asthma | 2 (5) | 8 (30.8) | NS |
|
|
|||
| Food allergy | 1 (2.5) | 12 (46.2) | p < 0.0001 |
|
|
|||
| Atopic dermatitis | 0 | 3 (11.5) | NS |
|
|
|||
| Symptoms (n, %) | |||
|
|
|||
| Abdominal pain | 25 (62.5) | 17 (65.4) | NS |
|
|
|||
| Nausea | 12 (30) | 10 (38.5) | NS |
|
|
|||
| Vomiting | 12 (30) | 14 (53.8) | NS |
|
|
|||
| Weight loss | 8 (20) | 7 (26.9) | NS |
|
|
|||
| Dysphagia | 5 (12.5) | 7 (26.9) | NS |
|
|
|||
| Reflux | 5 (12.5) | 5 (19.2) | NS |
|
|
|||
| Constipation | 9 (22.5) | 4 (15.4) | NS |
|
|
|||
| Diarrhea | 5 (12.5) | 3 (11.5) | NS |
|
|
|||
| Feeding problems | 5 (12.5) | 4 (15.5) | NS |
|
|
|||
| Diagnosis (n, %) | |||
|
|
|||
| EG | 0 | 17 (65.4) | p < 0.0001 |
|
|
|||
| EoD | 0 | 5 (19.2) | p = 0.007 |
|
|
|||
| EG + EoD | 0 | 4 (15.4) | p < 0.02 |
|
|
|||
| EoE + EG/EoD | 0 | 13 (50) | p < 0.0001 |
|
|
|||
| Functional GI disorder | 25 (62.5) | 0 | p < 0.0001 |
|
|
|||
| Feeding problem | 4 (10) | 0 | NS |
|
|
|||
| Other (FPIES, med related, infection) | 6 (15) | 0 | NS |
|
|
|||
| Lactose intolerance | 5 (12.5) | 0 | NS |
|
|
|||
| Gastrointestinal endoscopic findings (n, %) | |||
|
|
|||
| Ulcers (any) | 0 | 14 (53.8) | p < 0.0001 |
|
|
|||
| Gastric ulcer | 0 | 5 (19.2) | p = 0.007 |
|
|
|||
| Duodenal bulb ulcer | 0 | 7 (26.9) | p = 0.0008 |
|
|
|||
| Duodenal body ulcer | 0 | 2 (7.7) | NS |
|
|
|||
| Superficial hemorrhage/erythema | 4 (10) | 13 (50) | p = 0.0005 |
|
|
|||
| Hyperplastic gastric folds | 0 | 13 (50) | p < 0.0001 |
|
|
|||
| Gastric nodularity | 0 | 6 (23.1) | p = 0.0025 |
|
|
|||
| Esophageal endoscopic findings (n, %) | |||
|
|
|||
| Erosions | 0 | 0 | NS |
|
|
|||
| Edema | 2 (5) | 12 (46.2) | p = 0.0001 |
|
|
|||
| Linear furrows | 2 (5) | 7 (26.9) | p = 0.02 |
|
|
|||
| Exudates/micro-abscesses | 0 | 3 (11.5) | NS |
|
|
|||
| Rings | 0 | 2 (7.7) | NS |
|
|
|||
| Stricture | 0 | 0 | NS |
|
|
|||
Categorical variables are compared using the Fisher’s exact test. Median age (continuous variable) is compared using a Mann-Whitney U test.
Endoscopic Findings
Endoscopically, the most common findings in EG/EoD were superficial hemorrhage or erythema, gross ulcers, hyperplastic folds, and antral nodularity (Table 1). Patients with EoD alone were more likely to have isolated bulb ulcers and superficial hemorrhage that spared the duodenal body. Edema and linear furrows were the most common endoscopic findings observed in the esophagi of EG/EoD subjects. A majority of the control subjects were endoscopically normal.
Histopathology
For the 26 EG/EoD patients, 62.5% (15/24) of gastric body biopsies, 65% (13/20) of gastric antrum biopsies, 33.3% (5/15) of duodenal bulb biopsies, and 17.6% (3/17) of duodenal body biopsies crossed eosinophil thresholds for diagnosis. None of the control biopsies met histologic criteria for EG/EoD. Sheets of eosinophils, eosinophilic glandulitis, and eosinophilic gland abscesses were only seen in gastric biopsies of patients with EG/EoD and were most commonly seen in biopsies of the gastric body (Figure 1 and Table 2). In contrast, eosinophilia of the submucosa and muscularis mucosa was most commonly seen in the gastric antrum. Intraepithelial eosinophils were noted in cases and controls in each segment of the stomach and duodenum; however, marked or abundant eosinophilia was only seen in biopsies from EG/EoD subjects.
Figure 1. Histopathologic features of EG/EoD.
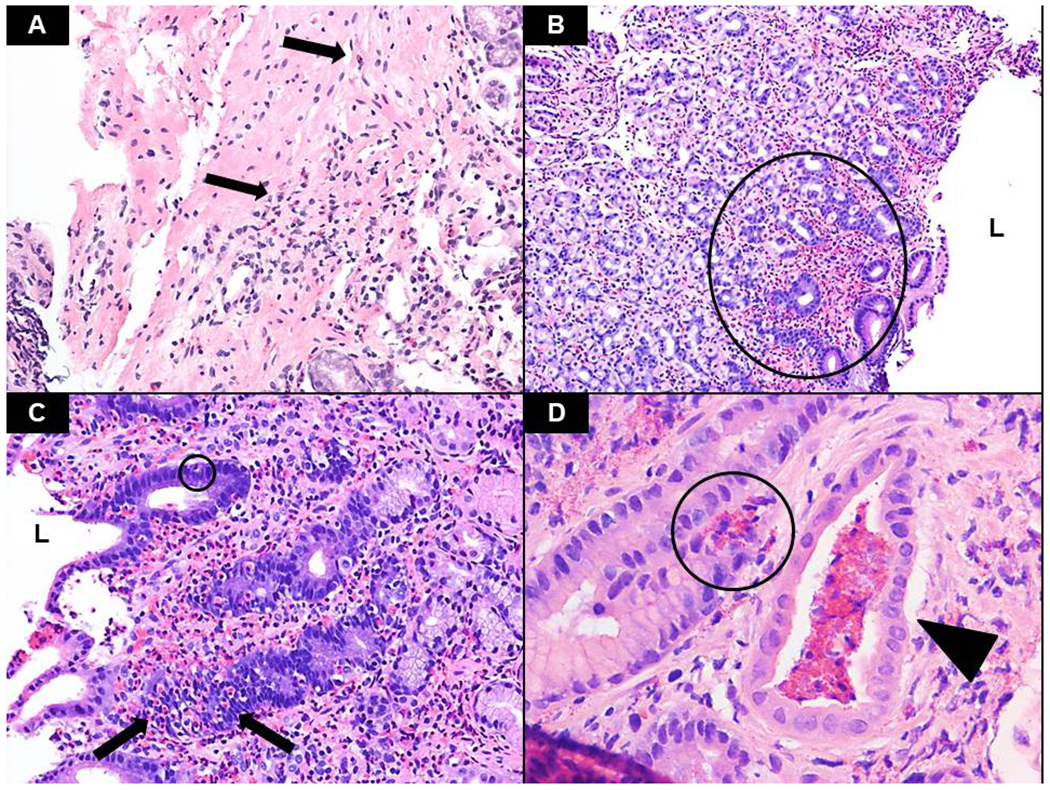
Following hematoxylin and eosin (H&E) staining, the biopsies were assessed for several histologic features commonly seen in eosinophilic gastritis and gastroenteritis, including the presence of eosinophils in the muscularis mucosae and/or submucosa (A – arrows, antrum, x200), sheets of eosinophils in the lamina propria (B – circle, antrum, x100), intraepithelial eosinophils (circle) as well as marked glandular permeation/involvement by eosinophils (C – arrows, antrum, x200) and eosinophilic microabscesses (D – circle, antrum, x400). Note the presence of a pit abscess in the lumen of the adjacent gland (wedge). L – indicates lumen.
Table 2.
Histologic Features of Gastric and Duodenal Biopsies
| Controls | Cases | p-value* | |
|---|---|---|---|
| Gastric Body | (n = 39) | (n=24) | |
|
|
|||
| Sheets of eosinophils | 0 (0.0) | 13 (54.2) | p < 0.0001 |
|
|
|||
| Eosinophilic glandulitis | 0 (0.0) | 15 (62.5) | p < 0.0001 |
|
|
|||
| Eosinophilic gland abscesses | 0 (0.0) | 11 (45.8) | p < 0.0001 |
|
|
|||
| Eosinophils in the SM/MM | 4 (10.3) | 12 (50.0) | p = 0.0008 |
|
|
|||
| Intraepithelial eosinophils | 8 (20.5) | 23 (95.8) | p < 0.0001 |
|
|
|||
| Grade 1 | 8 (20.5) | 11 (45.8) | p = 0.048 |
|
|
|||
| Grade 2 | 0 (0.0) | 12 (50) | p < 0.0001 |
|
|
|||
| Gastric Antrum | (n= 39) | (n=20) | |
|
|
|||
| Sheets of eosinophils | 0 (0.0) | 6 (30.0) | p = 0.0009 |
|
|
|||
| Eosinophilic glandulitis | 0 (0.0) | 10 (50.0) | p < 0.0001 |
|
|
|||
| Eosinophilic gland abscesses | 0 (0.0) | 4 (20.0) | p = 0.01 |
|
|
|||
| Eosinophils in the SM/MM | 24 (61.5) | 16 (80.0) | NS |
|
|
|||
| Intraepithelial eosinophils | 6 (15.4) | 19 (95.0) | p < 0.0001 |
|
|
|||
| Grade 1 | 6 (15.4) | 11 (55.0) | p = 0.002 |
|
|
|||
| Grade 2 | 0 (0.0) | 8 (40.0) | p < 0.0001 |
|
|
|||
| Duodenal Bulb | (n= 33) | (n=15) | |
|
|
|||
| Sheets of eosinophils | 0 (0.0) | 2 (13.3) | NS |
|
|
|||
| Eosinophilic glandulitis | 1 (3.0) | 3 (20.0) | NS |
|
|
|||
| Eosinophilic gland abscesses | 0.0 (0.0) | 2 (13.3) | NS |
|
|
|||
| Eosinophils in the SM/MM | 7 (21.2) | 8 (53.3) | p = 0.04 |
|
|
|||
| Intraepithelial eosinophils | 19 (57.6) | 14 (93.3) | p = 0.018 |
|
|
|||
| Grade 1 | 19 (57.6) | 11 (73.3) | NS |
|
|
|||
| Grade 2 | 0 (0.0) | 3 (20) | P = 0.026 |
|
|
|||
| Duodenal Body | (n=40) | (n=17) | |
|
|
|||
| Sheets of eosinophils | 0 (0.0) | 1 (5.9) | NS |
|
|
|||
| Eosinophilic glandulitis | 1 (2.5) | 3 (17.6) | NS |
|
|
|||
| Eosinophilic gland abscesses | 0 (0.0) | 3 (17.6) | p = 0.02 |
|
|
|||
| Eosinophils in the SM/MM | 13 (32.5) | 9 (52.9) | NS |
|
|
|||
| Intraepithelial eosinophils | 34 (85.0) | 13 (76.5) | NS |
|
|
|||
| Grade 1 | 34 (85.0) | 10 (58.8) | p = 0.04 |
|
|
|||
| Grade 2 | 0 (0.0) | 3 (17.6) | p = 0.02 |
|
|
|||
The n values reported are the number of biopsies analyzed for each segment of the stomach or duodenum. Duodenal biopsies from EG/EoD cases were excluded if the clinical pathology report did not mention eosinophilia.
Fisher’s exact test
Eosinophil Assessments
Figure 2A, B illustrates the peak (1 hpf) and average (5 hpf) eosinophil counts in each patient according to anatomical location (gastric body, gastric antrum, duodenal bulb, and duodenal body) compared to controls. Peak and average eosinophil counts were significantly increased in each segment of the gastrointestinal tract of EG/EoD subjects and differences were greatest in the gastric body. Similar trends were noted when the same biopsies were analyzed for EPX (Figure 2C, D). Manual assessment of EPX staining also revealed significant differences in each component of the EPX score (Supplemental Figure 2). Importantly, EPX immunohistochemistry enhanced detection of intact eosinophils and extracellular eosinophil granule proteins (Figure 3). In order to compare methods for EPX quantification, we then evaluated correlations between eos/mm2, the EPX score and measurement of EPX/mm2 by image analysis. We found moderate (defined as r≥0.3) to strong (defined as r≥0.7) positive correlations between eos/mm2, EPX score and EPX/mm2 for measurements obtained from the same biopsy for each segment of the upper gastrointestinal tract (Table 3).
Figure 2. Eosinophil counts and EPX levels are markedly increased in EG/EoD.
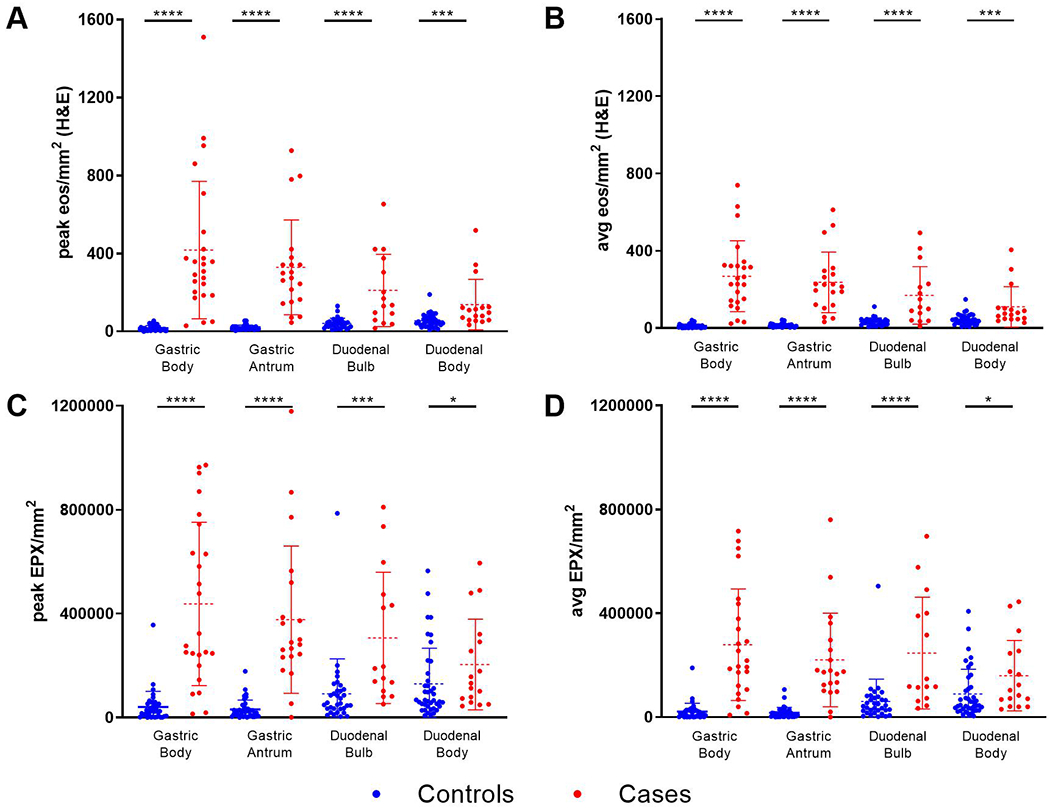
Peak (1 hpf) and average (stomach = 5 hpf; duodenum = 3 hpf) eos/mm2 and EPX/mm2 were compared for cases (n=26) and controls (n=40) in biopsies from the gastric body, gastric antrum, duodenal bulb and duodenal body.
Figure 3. EPX immunohistochemistry enhances assessment of eosinophilic inflammation.
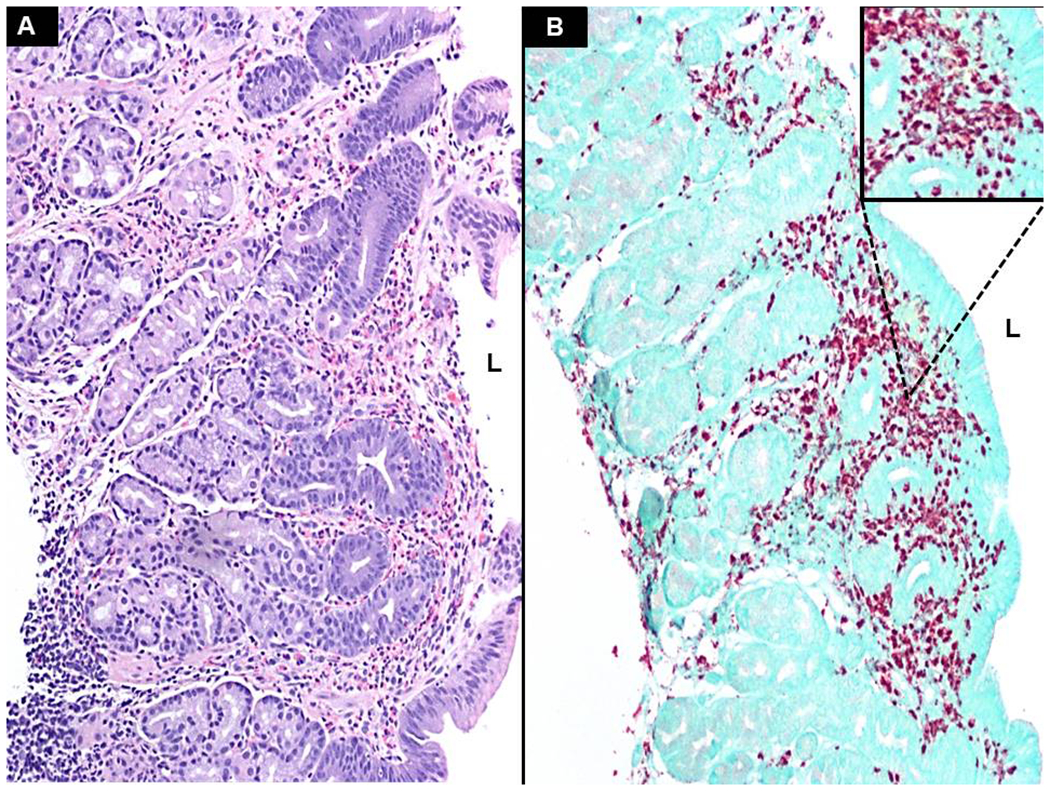
This gastric biopsy reveals a marked eosinophil infiltration with sheet-like involvement of the lamina propria as well as moderate intraepithelial glandular permeation (A – x100). The numbers of eosinophils, coupled with the levels of degranulation, introduce difficulty when trying to accurately assess both eosinophil counts and the extracellular presence of EPX. EPX staining highlights both eosinophils and degranulated material (B – x100, inset magnified). L - indicates lumen
Table 3.
Spearman correlation coefficients between eos/mm2, EPX scores, and EPX/mm2*
| EPX score vs. eos/mm2 | EPX/mm2 vs. eos/mm2 |
EPX score vs. EPX/mm2 | |
|---|---|---|---|
| Gastric Body | 0.90 | 0.81 | 0.80 |
|
|
|||
| Gastric Antrum | 0.83 | 0.77 | 0.85 |
|
|
|||
| Duodenal Bulb | 0.83 | 0.70 | 0.80 |
|
|
|||
| Duodenal Body | 0.67 | 0.52 | 0.67 |
|
|
|||
Spearman’s rho (r) values reported, p-values < 0.0001 for all correlation coefficients listed.
EG/EoD subjects only had to exceed eosinophil thresholds in a single biopsy; therefore, we restricted our next analysis to only those biopsies that met eosinophil-based criteria for EG and/or EoD diagnosis. For the analysis, we combined the biopsies taken from either gastric body or gastric antrum for EG and biopsies taken from the duodenal bulb or duodenal body for EoD. Figure 4 demonstrates marked differences in eos/mm2 {[stomach median = 12.24 (IQR 7.81-21.73) vs 312.2 (IQR 227.4-457.4), p<0.0001]; [duodenum median 43.60 (IQR 30.24-60.13) vs. 334.7 (IQR 227.8-410.3), p<0.0001]}, EPX scores {[stomach median = 3 (IQR 3-5) vs. 41 (IQR 33.5-45), p<0.0001], [duodenum median 12 (IQR 8.5-17) vs. 45 (IQR 40.5-46)], p<0.0001} and EPX/mm2 {[stomach median = 18,786 (IQR 5,116-29,212) vs. 339,008 (IQR 159,840-479,022) p<0.0001]; [duodenum median = 58,858 (IQR 32,855-113,478) vs. 366,329 (IQR 164,914-555,379)], p<0.0001}. We noted overlap in the degranulation component of the EPX scores (Supplemental Figure 2) and levels of EPX/mm2 (Figure 2), particularly in the duodenum. In order to assess diagnostic accuracy, we generated receiver operator characteristic (ROC) curves for the EPX score and EPX/mm2 (Figure 5). Both of these assessment tools identified known EG/EoD subjects with high diagnostic accuracy [(stomach EPX score AUC = 1, EPX/mm2 = 0.98 (95%CI 0.96-1), p<0.0001); (duodenum EPX score AUC = 1, EPX/mm2 = 0.91 (95%CI 0.81-1)), p<0.0001].
Figure 4. EG/EoD biopsies have increased eosinophil counts, EPX scores and EPX/mm2.
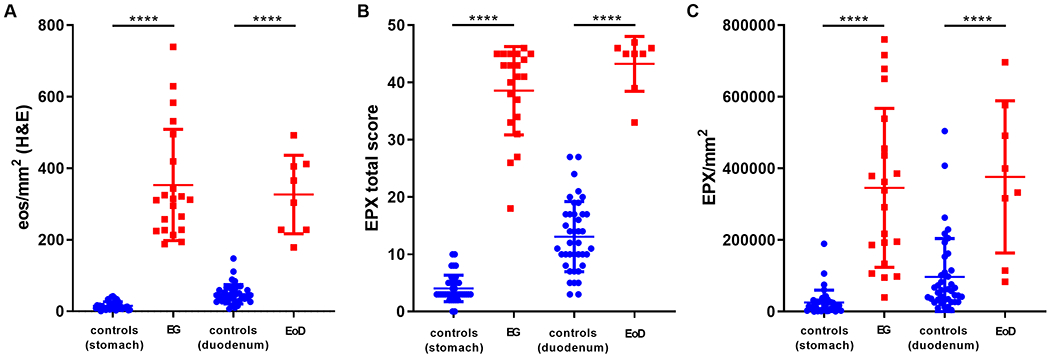
Biopsies meeting or exceeding histologic thresholds for EG (≥30 eos/hpf in at least 5 hpf) and/or EoD (≥30 eos/hpf in at least 3 hpf) are compared between cases and controls.
Figure 5. The EPX score and EPX/mm2 identify subjects with EG and EoD with high diagnostic accuracy.
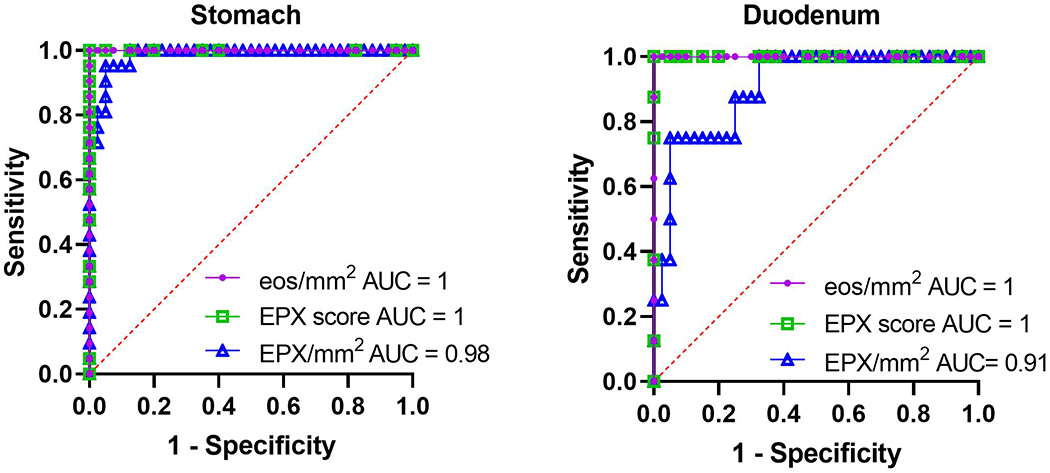
Receiver operator characteristic (ROC) curves for eos/mm2, EPX scores, and EPX/mm2 shown. p<0.0001 for all values reported.
Of the 10 subjects we identified with ICD-9/ICD-10 codes for EG/EoD who did not meet stringent histologic thresholds for EG based on eosinophil counts, 7/10 had EPX scores and 4/10 had EPX/mm2 levels above the proposed cutoffs in Table 4. One subject who did not meet criteria for EoD in the duodenum, had an EPX score of 50 (maximum possible score), and an EPX/mm2 level of 474,225, almost twice the proposed diagnostic threshold (Supplemental Figure 3).
Table 4.
Diagnostic Thresholds for the EPX Score and EPX/mm2
| Cutoff value | YI* | Sensitivity | 95% CI† | Specificity | 95% CI | |
|---|---|---|---|---|---|---|
| Gastric biopsies | ||||||
|
|
||||||
| EPX score | >14 | 1 | 1 | 0.85-1 | 1 | 0.91-1 |
|
|
||||||
| EPX/mm2 | >85,323 | 0.90 | 0.95 | 0.77-1 | 0.95 | 0.84-0.99 |
|
|
||||||
| Duodenal biopsies | ||||||
|
|
||||||
| EPX score | >30 | 1 | 1 | 0.68-1 | 1 | 0.91-1 |
|
|
||||||
| EPX/mm2 | >246,123 | 0.68 | 0.75 | 0.41-0.96 | 0.93 | 0.80-0.97 |
|
|
||||||
Youden’s Index
Confidence Interval
Discussion
In this study, we compared two methods for quantification of eosinophilic inflammation in EG/EoD to the current gold standard of tissue eosinophil counts: (1) a manual EPX score; and (2) digital pixel quantification of EPX staining (EPX/mm2). We found that EPX scores and EPX/mm2 were markedly elevated in biopsies that exceeded histologic thresholds for EG/EoD when compared to controls in all anatomical locations, with strong correlation to eosinophil density in the stomach and moderate correlation in the duodenum. Furthermore, we demonstrated that EPX quantification identifies EG/EoD subjects with high diagnostic accuracy and may be useful for diagnosis of patients who may not necessarily cross eosinophil thresholds based on eosinophil counts alone.
Although the current standard diagnostic approach accounts for intact eosinophils in EGID, several studies highlight a need to also evaluate eosinophil degranulation products 15,18. We and others have examined staining for various proteins including eosinophil derived neurotoxin (EDN) 19,20, major basic protein (MBP) 20–22, eosinophil cationic protein (ECP) 23, and EPX 15,24 as tissue biomarkers in EoE. The advantage of EPX over other granule proteins is that it is exclusively released by eosinophils.11 We recently demonstrated the utility of automated image analysis of EPX staining in EoE 12. This study extends application of this novel method to EG/EoD. Current approaches to histologic diagnosis of EG/EoD are time-consuming, especially in light of the fact that eosinophils are resident cells in the gastric and intestinal mucosa. Unlike in EoE, where a single high power field may clinch the histologic diagnosis, eosinophil counts in multiple high power fields must be counted and averaged in biopsies of the stomach and duodenum. In addition, H&E staining often only detects intact eosinophils and does not fully capture the extent of eosinophil degranulation.
Our EPX histopathologic scoring algorithm incorporates assessment of degranulation with comparable diagnostic accuracy to current methods; however, this method itself is a labor-intensive process. Application of digital pathology methods in EG/EoD can help increase efficiency. Although there is still some level of subjectivity in our current approach (i.e. technician selects areas of highest EPX staining), an automated detection method can also improve reproducibility. We demonstrated how this method correlates well with our histopathologic scoring system, offering a new way to assess eosinophil counts in EG/EoD biopsies that accounts for degranulation products with increased efficiency. Widespread application of this method in EGIDs and disorders characterized by eosinophilic tissue inflammation will require further optimization and standardization of the staining and digital quantification methods. The EPX staining protocol utilized for this study was optimized for the Leica Bond staining platform in the clinical pathology lab at Phoenix Children’s Hospital outside of the research laboratory setting at Mayo Clinic Arizona where the original research laboratory studies of EPX staining were conducted. Provided an institution has the infrastructure to scan and view digital pathology slides, this approach should be feasible in the clinical setting.
There are several limitations in this study. This is a single-center retrospective study of pediatric subjects; therefore, the results may not be generalizable to all subjects (including adults) with non-esophageal EGID. Additionally, in an attempt to avoid accounting for increased extracellular degradation secondary to trauma from handling, specimens were measured at least one hpf from the edge of tissue, but some specimens were too small to accomplish this. The noted overlap between EG/EoD cases and controls in the EPX degranulation component scores and levels of EPX/mm2, particularly in the duodenum, may reflect either artefactual degranulation or disruption of resident eosinophils during biopsy procurement or increased detection of eosinophil degranulation products. The low levels of extracellular granule proteins observed in the control subjects are likely artefactual. Given the specificity of EPX/mm2, we do not suspect this significantly influenced the results. Finally, the sensitivity, specificity, AUC, and Youden’s Index values were arrived at using the same data that was used to model the ROC curve so the value of the performance metrics may be optimistic and require additional validation. Future studies using prospectively collected biopsies before and after treatment are required to determine the actual diagnostic accuracy of our approach.
In summary, we have developed a novel automated detection system for EPX analysis that can quantify eosinophilic infiltration and degranulation in EG that may enhance diagnostic sensitivity, efficiency and reproducibility. We acknowledge that optimization of the staining platform and slide digitization require additional effort at the outset. However, once incorporated into existing workflows, they largely do not require a pathologist’s effort and save time by facilitating automation. In the future, we aim to compare EPX assessments with other clinical outcome measures evaluating symptoms and endoscopic findings in order to validate EPX staining as a histologic biomarker of EG/EoD.
Supplementary Material
Acknowledgments:
The authors would like to thank Melissa Pecak BSN, RNfor her efforts in coordinating the care of patients in the Phoenix Children’s Hospital Multidisciplinary EGID Clinic. They would also like to thank Nora Odisho, MD for her work in submitting the IRB protocol and Jamie Smith for assisting as a research coordinator.
Funding:
This study was funded by the Phoenix Children’s Hospital Foundation. BLW also reports funding from the Arizona Biomedical Research Commission (ADHS18-198880), the Mayo Foundation, and the Consortium of Eosinophilic Gastrointestinal Disease Researchers (CEGIR). CEGIR (U54 AI117804) is part of the Rare Disease Clinical Research Network (RDCRN), an initiative of the Office of Rare Diseases Research (ORDR), NCATS, and is funded through collaboration between NIAID, NIDDK, and NCATS. CEGIR is also supported by patient advocacy groups including American Partnership for Eosinophilic Disorders (APFED), Campaign Urging Research for Eosinophilic Diseases (CURED), and Eosinophilic Family Coalition (EFC). As a member of the RDCRN, CEGIR is also supported by its Data Management and Coordinating Center (DMCC) (U2CTR002818).
Abbreviations:
- AUC
area under the curve
- CI
confidence interval
- ECP
eosinophil cationic protein
- EDN
eosinophil derived neurotoxin
- EPX
eosinophil peroxidase
- EC
eosinophilic colitis
- EG
eosinophilic gastritis
- EoD
eosinophilic gastroenteritis
- EGID
eosinophilic gastrointestinal disorder
- EoE
eosinophilic esophagitis
- eos/hpf
eosinophils per high power field
- FFPE
formalin-fixed paraffin-embedded
- H&E
hematoxylin and eosin
- IHC
immunohistochemistry
- IQR
interquartile range
- MBP
major basic protein
- ROC
receiver operating characteristic curve
Footnotes
Conflicts of interest:
Dr. Wright has received research funding from Allakos. Dr. Schroeder has received research funding from Allakos, Regeneron, and Takeda.
References
- 1.Rothenberg ME. Eosinophilic gastrointestinal disorders (EGID). Journal of Allergy and Clinical Immunology 2004;113:11–28. [DOI] [PubMed] [Google Scholar]
- 2.Dellon ES, Liacouras CA, Molina-Infante J, et al. Updated International Consensus Diagnostic Criteria for Eosinophilic Esophagitis: Proceedings of the AGREE Conference. Gastroenterology 2018;155:1022–33 e10. [DOI] [PMC free article] [PubMed] [Google Scholar]
- 3.Collins MH, Capocelli K, Yang GY. Eosinophilic Gastrointestinal Disorders Pathology. Front Med (Lausanne) 2017;4:261. [DOI] [PMC free article] [PubMed] [Google Scholar]
- 4.Moawad FJ. Eosinophilic Esophagitis: Incidence and Prevalence. Gastrointest Endosc Clin N Am 2018;28:15–25. [DOI] [PubMed] [Google Scholar]
- 5.Kaijser R Allergic disease of the gut from the point of view of the surgeon. Arch Klin Chir 1937;188:36–64. [Google Scholar]
- 6.Mansoor E, Saleh MA, Cooper GS. Prevalence of Eosinophilic Gastroenteritis and Colitis in a Population-Based Study, From 2012 to 2017. Clin Gastroenterol Hepatol 2017;15:1733–41. [DOI] [PubMed] [Google Scholar]
- 7.Jensen ET, Martin CF, Kappelman MD, Dellon ES. Prevalence of Eosinophilic Gastritis, Gastroenteritis, and Colitis: Estimates From a National Administrative Database. J Pediatr Gastroenterol Nutr 2016;62:36–42. [DOI] [PMC free article] [PubMed] [Google Scholar]
- 8.Mehta P, Furuta GT. Eosinophils in Gastrointestinal Disorders: Eosinophilic Gastrointestinal Diseases, Celiac Disease, Inflammatory Bowel Diseases, and Parasitic Infections. Immunology and allergy clinics of North America 2015;35:413–37. [DOI] [PMC free article] [PubMed] [Google Scholar]
- 9.Lwin T, Melton SD, Genta RM. Eosinophilic gastritis: histopathological characterization and quantification of the normal gastric eosinophil content. Mod Pathol 2011;24:556–63. [DOI] [PubMed] [Google Scholar]
- 10.Dellon ES, Peterson KA, Murray JA, et al. Anti-Siglec-8 Antibody for Eosinophilic Gastritis and Duodenitis. N Engl J Med 2020;383:1624–34. [DOI] [PMC free article] [PubMed] [Google Scholar]
- 11.Ochkur SI, Kim JD, Protheroe CA, et al. A sensitive high throughput ELISA for human eosinophil peroxidase: a specific assay to quantify eosinophil degranulation from patient-derived sources. J Immunol Methods 2012;384:10–20. [DOI] [PMC free article] [PubMed] [Google Scholar]
- 12.Wright BL, Doyle AD, Shim KP, et al. Image Analysis of Eosinophil Peroxidase Immunohistochemistry for Diagnosis of Eosinophilic Esophagitis. Dig Dis Sci. 2021. March;66(3):775–783. [DOI] [PMC free article] [PubMed] [Google Scholar]
- 13.Wright BL, Fernandez-Becker NQ, Kambham N, et al. Gastrointestinal Eosinophil Responses in a Longitudinal, Randomized Trial of Peanut Oral Immunotherapy. Clin Gastroenterol Hepatol 2020. [DOI] [PMC free article] [PubMed] [Google Scholar]
- 14.Lal D, Wright BL, Shim KP, et al. Eosinophil peroxidase, GATA3, and T-bet as tissue biomarkers in chronic rhinosinusitis. J Allergy Clin Immunol 2019;143:2284–7 e6. [DOI] [PubMed] [Google Scholar]
- 15.Protheroe C, Woodruff SA, de Petris G, et al. A novel histologic scoring system to evaluate mucosal biopsies from patients with eosinophilic esophagitis. Clin Gastroenterol Hepatol 2009;7:749–55 e11. [DOI] [PMC free article] [PubMed] [Google Scholar]
- 16.Saffari H, Hoffman LH, Peterson KA, et al. Electron microscopy elucidates eosinophil degranulation patterns in patients with eosinophilic esophagitis. J Allergy Clin Immunol 2014;133:1728–34 e1. [DOI] [PubMed] [Google Scholar]
- 17.Peterson KA, Cobell WJ, Clayton FC, et al. Extracellular Eosinophil Granule Protein Deposition in Ringed Esophagus with Sparse Eosinophils. Dig Dis Sci 2015;60:2646–53. [DOI] [PubMed] [Google Scholar]
- 18.Peterson KA, Gleich GJ, Limaye NS, et al. Eosinophil granule major basic protein 1 deposition in eosinophilic esophagitis correlates with symptoms independent of eosinophil counts. Dis Esophagus. 2019. Dec 30;32(11):doz055. [DOI] [PubMed] [Google Scholar]
- 19.Kephart GM, Alexander JA, Arora AS, et al. Marked deposition of eosinophil-derived neurotoxin in adult patients with eosinophilic esophagitis. The American journal of gastroenterology 2010;105:298–307. [DOI] [PMC free article] [PubMed] [Google Scholar]
- 20.Sridhara S, Ravi K, Smyrk TC, et al. Increased numbers of eosinophils, rather than only etiology, predict histologic changes in patients with esophageal eosinophilia. Clin Gastroenterol Hepatol 2012;10:735–41. [DOI] [PubMed] [Google Scholar]
- 21.Dellon ES, Chen X, Miller CR, Woosley JT, Shaheen NJ. Diagnostic utility of major basic protein, eotaxin-3, and leukotriene enzyme staining in eosinophilic esophagitis. Am J Gastroenterol 2012;107:1503–11. [DOI] [PMC free article] [PubMed] [Google Scholar]
- 22.Mueller S, Aigner T, Neureiter D, Stolte M. Eosinophil infiltration and degranulation in oesophageal mucosa from adult patients with eosinophilic oesophagitis: a retrospective and comparative study on pathological biopsy. J Clin Pathol 2006;59:1175–80. [DOI] [PMC free article] [PubMed] [Google Scholar]
- 23.Strasser DS, SEoDr S, Bussmann C, et al. Eosinophilic oesophagitis: relevance of mast cell infiltration. Histopathology 2018;73:454–63. [DOI] [PubMed] [Google Scholar]
- 24.Wright BL, Ochkur SI, Olson NS, et al. Normalized serum eosinophil peroxidase levels are inversely correlated with esophageal eosinophilia in eosinophilic esophagitis. Dis Esophagus. 2018. Feb 1;31(2):dox139. [DOI] [PMC free article] [PubMed] [Google Scholar]
Associated Data
This section collects any data citations, data availability statements, or supplementary materials included in this article.