

Abstract
Background:
Novel temporal-spatial features of the 12-lead ECG can conceptually optimize culprit lesions’ detection beyond that of classical ST amplitude measurements. We sought to develop a data-driven approach for ECG feature selection to build a clinically relevant algorithm for real-time detection of culprit lesion.
Methods:
This was a prospective observational cohort study of chest pain patients transported by emergency medical services to three tertiary care hospitals in the US. We obtained raw 10-s, 12-lead ECGs (500 s/s, HeartStart MRx, Philips Healthcare) during prehospital transport and followed patients 30 days after the encounter to adjudicate clinical outcomes. A total of 557 global and lead-specific features of P-QRS-T waveform were harvested from the representative average beats. We used Recursive Feature Elimination and LASSO to identify 35/557, 29/557, and 51/557 most recurrent and important features for LAD, LCX, and RCA culprits, respectively. Using the union of these features, we built a random forest classifier with 10-fold cross-validation to predict the presence or absence of culprit lesions. We compared this model to the performance of a rule-based commercial proprietary software (Philips DXL ECG Algorithm).
Results:
Our sample included 2400 patients (age 59 ± 16, 47% female, 41% Black, 10.7% culprit lesions). The area under the ROC curves of our random forest classifier was 0.85 ± 0.03 with sensitivity, specificity, and negative predictive value of 71.1%, 84.7%, and 96.1%. This outperformed the accuracy of the automated interpretation software of 37.2%, 95.6%, and 92.7%, respectively, and corresponded to a net reclassification improvement index of 23.6%. Metrics of ST80; Tpeak-Tend; spatial angle between QRS and T vectors; PCA ratio of STT waveform; T axis; and QRS waveform characteristics played a significant role in this incremental gain in performance.
Conclusions:
Novel computational features of the 12-lead ECG can be used to build clinically relevant machine learning-based classifiers to detect culprit lesions, which has important clinical implications.
Keywords: ECG, Culprit lesion, ACS, Machine learning, Features selection, Dimensionality reduction
Introduction
The standard 12-lead ECG remains the mainstay for evaluating patients with suspected acute coronary syndrome (ACS) during first medical contact. [1,2] Detecting the presence and severity of coronary occlusion (i.e., culprit lesions) can guide timely therapeutic interventions and significantly improve patient outcomes. However, current automated algorithms are suboptimal in detecting or localizing culprit lesions in ST segment elevation ACS. [3] Furthermore, we currently lack tools to detect the presence of actionable culprit lesions in those with non-ST elevation ACS.
Acute myocardial ischemia affects the configuration of the QRS complexes, the ST segments and the T waves; yet most existing ECG algorithms primarily analyze ST segment deviation alone, which constitutes a missed opportunity and may contribute to the suboptimal performance seen in many automated algorithms. [4] Markers of electrical dispersion incorporate much more information in the ECG than that provided by measuring elevation of the ST segment and constitute powerful and robust means of assessing ECG morphology and dynamics in addition to classical interval and amplitude measurements. [5–7]
We have previously demonstrated that markers of ventricular depolarization and repolarization dispersion on the standard 12-lead ECG, other than ST segment, can improve the classification performance for detecting potential ACS during first medical contact. [8,9] However, identifying ACS patients with acute coronary occlusion has important implications for timely decision making and resource utilization in the emergency department. Thus, we sought to explore whether using novel features of ventricular depolarization and repolarization dispersion on the standard 12-lead ECG can optimize the classification performance for detecting the presence of culprit lesions in patients evaluated with suspected ACS.
Materials and methods
Design and settings
Details on the methods of this study have been previously published in detail. [10] Briefly, this was a prospective observational cohort study recruiting consecutive patients with chest pain transported by emergency medical services to 1 of 3 tertiary care hospitals in the United States between 2013 and 2016. The patients were enrolled under a waiver of informed consent. We conducted an offline analysis on prehospital 10-s 12-lead ECGs stored after being recorded by prehospital personnel. The study outcomes were then adjudicated up to 30 days after the indexed encounter. The University of Pittsburgh Institutional Review Board approved this study.
Study outcomes
We used guidelines proposed by the American College of Cardiology to define and measure the degree of coronary artery occlusion among patients who had diagnostic angiography. [11] Major coronary arteries of interest were the Left Anterior Descending (LAD), Left Circumflex (LCX), Right Coronary Artery (RCA), and Left Main Coronary artery (LMCA). Major coronary branches of interest included the first Obtuse Marginal (OM1), first Diagonal (D1), and the Right Posterior Descending Artery (RPDA). Additional variables for consideration included percent occlusion for previously grafted arteries, percutaneous coronary intervention (PCI) type (balloon angioplasty or new stent), or performance of angiography only. Major coronary artery with >70% occlusion or a newly placed stent were labeled as a culprit vessel, excluding the LMCA where >50% occlusion or a newly placed stent met criteria for culprit. Major coronary branches with >70% occlusion or newly placed stents were labeled as culprit equivalents (e.g., D1 = LAD equivalent, OM1 = LCX equivalent, RPDA = RCA equivalent). Notably, if the LMCA was labeled culprit, the LAD and LCX were labeled culprit as well.
ECG data preprocessing and features extraction
Before any preprocessing, all ECGs were manually reviewed and overread by an independent reviewer. ECGs with excessive noise or artifact were replaced by the next serial ECGs collected before emergency evaluation (n = 24, 1%). All available ECGs were included in the study, including those with confounders (e.g., BBB, LVH, etc.). Then, the 10-s 12-lead ECGs (500 samples per second, 5 μV per least significant bit; 0.05–150 Hz, HeartStart MRx, Philips Healthcare) were preprocessed by Philips Healthcare Advanced Algorithm Research Center (Andover, MA). Signal was filtered to eliminate noise, baseline wander, and artifact, and ectopic beats were removed. Averaged representative beats from each of the 12 leads were computed to remove residual baseline noise and artifacts.
Next, using the 12 representative beats, a total of 557 global and lead-specific features of the P-QRS-T waveform were captured from each 12-lead ECG as previously described in detail. [8,9] In short, 444 temporal ECG features represent durations, amplitudes, and areas of various waveform deflections harvested from individual leads. Also, 6 more temporal ECG features represent global intervals and subintervals obtained after superimposing all representative beats. Next, 13 spatial ECG features representing principal component analysis (PCA) ratios of time-voltage data of various ECG waveforms were computed on orthogonal leads I, II, and V1–V6. Finally, 91 additional spatial ECG features were identified representing axes, angles, loops, and gradients of QRS and T vectors from Frank lead xy, xz, yz, and xyz planes. Feature values were normalized (L2 norm), and missing values were imputed using the mean over the corresponding feature.
Data-driven feature selection
Two feature selection algorithms were used to pinpoint features that are most associated with individual culprit lesion detection. These algorithms are finetuned to result in an optimal performance of the classification algorithm while reducing the number of used ECG features. First, we applied Least Absolute Shrinkage and Selection Operator (LASSO) algorithm with a random selection of the coefficient to update at each iteration rather than the default sequential update of all coefficients, in order to expedite the convergence. Second, Recursive Feature Elimination (RFE) with 5% of features to remove at each iteration was implemented. Every method is applied on the full dataset, containing all the available ECG features. Then, the two sets of features selected by these algorithms were combined by keeping only the common features to obtain a final set. The latter was used in exploring the performance of the classifier.
This process was applied in three separate models for the different culprit lesions (LAD, LCX and RCA) to obtain three reduced sets of features for identifying each outcome. For the LCX outcome, only the LASSO set was used due to the decreased performance obtained by combining the feature selection results. It is important to note that feature selection algorithms are used as opposed to feature extraction algorithms for interpretability reasons. Indeed, feature extraction algorithms may result in a set of new features that are the combination of the original ones so it would be harder to trace back the contribution of the initial features set.
Finally, we combined the three reduced feature sets obtained for individual culprit lesions to form a global reduced set for the prediction of the presence or absence of any culprit lesion, yielding a set of 90 features. The features of this set were used as predictors for the classifier of the ‘any culprit lesion’ outcome. We plotted the feature importance bar graph with respect to each outcome as a function of the Gini importance (or mean decrease impurity) computed for the Random Forest (RF) structure.
Machine learning algorithm and performance metrics
Considering the sample size of our data and the prevalence of the outcomes, we decided to use RF. These classifiers are partially interpretable, reliable in unbalanced and non-linear datasets, and robust to outliers. Four RF classifiers were built: LAD model, LCX model, RCA model, and any culprit model. We used 10-fold cross-validation on the data sets. Specifically, we implemented the stratified version so that each split had the same proportions of specific coronary occlusions as the global unbalanced datasets. The modeling was done using Python which is an open-source coding language, and built-in functions from the sklearn machine learning library were mainly used, such as sklearn.ensemble.RandomForestClassifier.
The area under the receiver operating characteristic (ROC) curve was computed for each classifier to assess its performance. We used the Geometric Mean method to select an adequate threshold, which is an effective approach in imbalanced classification. The maximum of the Geometric Mean between the true positive rate (TPR, or sensitivity) and the specificity = 1 - false positive rate (FPR) over 10 thresholds (one for each fold) was considered to be the best threshold to apply on the fold results computed in the validation step. Using this cutoff, we obtained the 2 × 2 confusion matrix for each classifier and calculated the sensitivity, specificity, positive predictive value, and negative predictive value. We opted to use ROC-optimized cutoffs to derive a clinically applicable model with maximized sensitivity and negative predictive value while maintaining a reasonable specificity, which constitute pre-requisites for good screening tools in clinical practice.
ECG reference standard
We compared our final classifier (any culprit model) against Philips diagnostic 12/16-lead ECG analysis program (Philips DXL ECG Algorithm). Using this commercially available software for automated ECG interpretation, we processed each 12-lead ECG to denote the diagnostic likelihood “***Acute MI***” or “Acute Ischemia”. Both categories were combined to compute the 2 × 2 confusion matrix and corresponding sensitivity, specificity, and positive and negative predictive values for the presence of ‘any culprit lesion’. These metrics were compared against our final RF model. The metric chosen for a concrete quantification of the incremental gain or loss in performance was the net reclassification improvement (NRI) index computed for the RF classifier against the reference standard.
Results
Baseline characteristics
Our sample size consisted of 2400 patients (age 59 ± 16, 47% female, 41% Black). Overall, 84.3% of the recruited patients had non-ACS etiology and 15.8% had confirmed ACS. Among the latter, 21.1% had no culprit lesions, 41% had single vessel disease, and another 37.9% had multi-vessel disease, reflecting the complexity of these patients. The prevalence of the individual culprit lesions in our dataset was 7.2% for LAD, 4.8% for LCX, 5.7% for RCA, and 10.7% for any culprit, again reflecting the severe imbalance of our binary outcomes. Table 1 shows the baseline characteristics of the study sample and across culprit lesion subgroups (not mutually exclusive). When comparing those with any culprit lesion to those without, those with culprits were more likely to be older white men with a history of dyslipidemia, CAD, old MI, and coronary revascularization.
Table 1.
Demographic and clinical characteristics across study subgroups.
| Study sample (n = 2400) |
LAD Culprit (n = 172) |
LCX Culprit (n = 114) |
RCA Culprit (n = 136) |
|
|---|---|---|---|---|
| Demographics | ||||
| Age (years) | 59 ± 16 | 63 ± 13 | 67 ± 12 | 66 ± 13 |
| Sex (Female) | 1119 (47%) | 62 (32%) | 44 (39%) | 55 (40%) |
| Race (Black) | 988 (41%) | 44 (26%) | 30 (26%) | 35 (26%) |
| Past Medical History | ||||
| Hypertension | 1684 (70%) | 117 (68%) | 90 (79%) | 104 (77%) |
| Diabetes | 682 (28%) | 53 (31%) | 44 (39%) | 45 (33%) |
| Dyslipidemia | 973 (41%) | 88 (51%) | 65 (57%) | 70 (52%) |
| COPD | 566 (24%) | 27 (16%) | 17 (15%) | 18 (13%) |
| Heart Failure | 433 (18%) | 26 (15%) | 22 (19%) | 18 (13%) |
| Known CAD | 851 (36%) | 90 (52%) | 63 (55%) | 74 (54%) |
| Old MI | 627 (26%) | 69 (40%) | 48 (42%) | 55 (40%) |
| Prior PCI | 578 (24%) | 81 (47%) | 53 (47%) | 62 (46%) |
| Prior CABG | 215 (9%) | 31 (18%) | 26 (23%) | 27 (20%) |
| Current Smoking | 743 (31%) | 41 (24%) | 30 (26%) | 42 (31%) |
| ECG Over-Read by Physician | ||||
| Normal Sinus Rhythm | 2061 (86%) | 160 (93%) | 105 (92%) | 124 (91%) |
| Atrial Fibrillation | 252 (11%) | 6 (4%) | 4 (4%) | 6 (4%) |
| LBBB or RBBB | 176 (7%) | 16 (9%) | 14 (12%) | 14 (10%) |
| LVH with a strain pattern | 80 (3%) | 5 (3%) | 4 (4%) | 4 (3%) |
| At least one wall with ST elevation | 163 (7%) | 62 (36%) | 39 (34%) | 47 (35%) |
| At least one wall with ST depression | 406 (17%) | 78 (45%) | 54 (47%) | 60 (44%) |
LAD: Left Anterior Descending Artery, LCX: Left Circumflex Artery, RCA: Right Coronary Artery, COPD: Chronic Obstructive Pulmonary Disease, CAD: Coronary Artery Disease, MI: Myocardial Infarction, PCI: Percutaneous Coronary Intervention, CABG: Coronary Artery Bypass Graft, LBBB: Left Bundle Branch Block, RBBB: Right Bundle Branch Block, LVH: Left Ventricular Hypertrophy. The columns in the table are not mutually exclusive.
Performance of the machine learning classifier
Fig. 1 shows the areas under the ROC curves (AUC-ROC) for the four different classifiers in the study. The AUC-ROC for LAD, LCX, and RCA culprit lesions were equal to 0.82 ± 0.03, 0.84 ± 0.03, and 0.85 ± 0.05, respectively. Using the union of these subsets, the AUC-ROC for the ‘any culprit lesion’ model was equal to 0.85 ± 0.03 (Fig. 1, right lower panel), suggesting that the selected feature subsets had very good classification performance for separating cases and controls for each culprit artery.
Fig. 1.
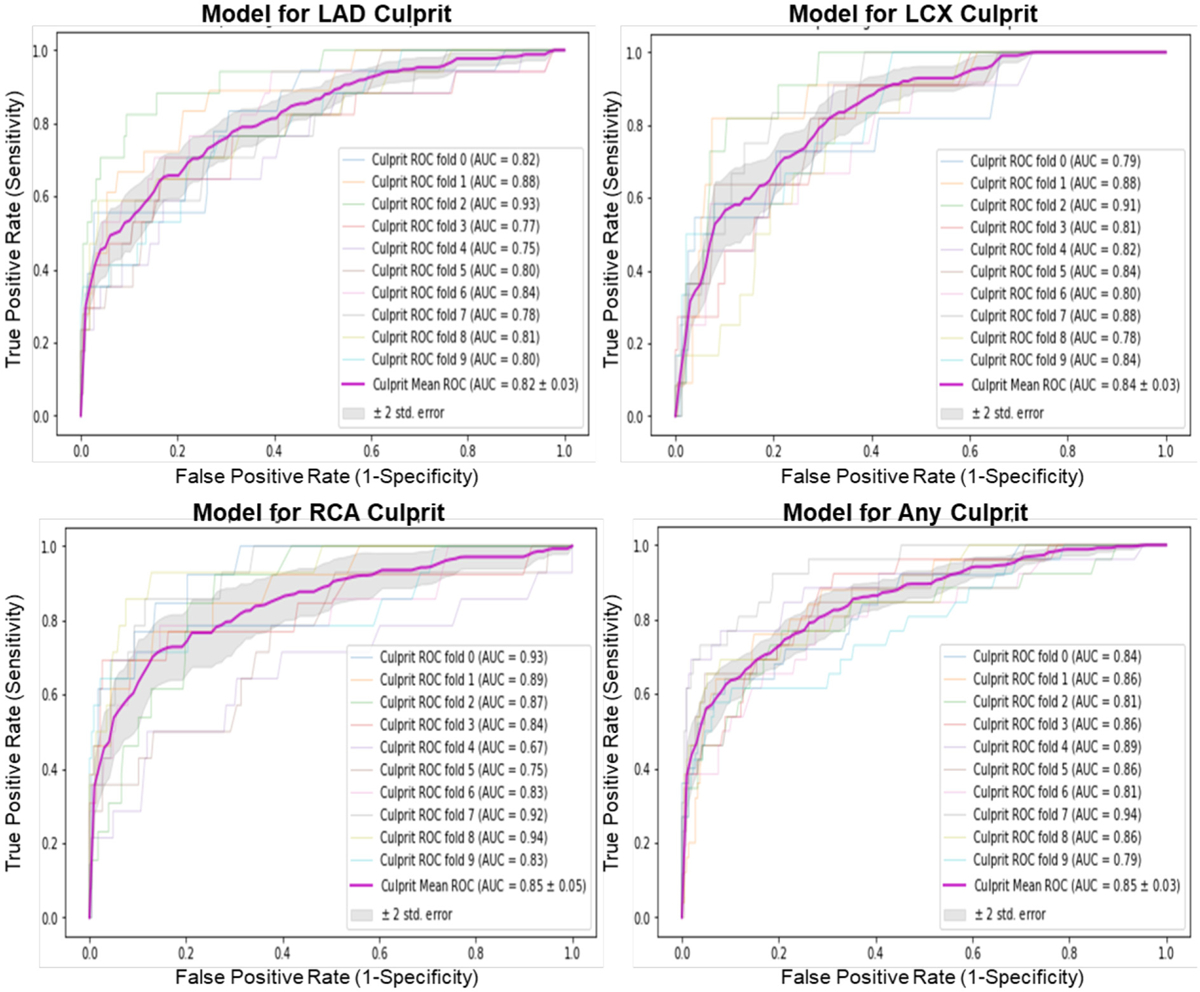
Classification performance of the different random forest classifiers.
Each plot shows the individual 10-fold curves, the mean ROC curve, and the corresponding AUC for LAD, LCX, RCA, and any culprit models. The ±2 standard error of the mean ROC curve is based on the different 10 folds. ROC: Receiver Operating Characteristic, AUC: Area Under the Curve, LAD: Left Anterior Descending, LCX: Left Circumflex, RCA: Right Coronary Artery.
Table 2 shows the diagnostic accuracy metrics of the final “any culprit lesion” model and an ECG reference standard. Compared to the commercial interpretation program, our classifier not only yielded a 34.5% gain in sensitivity (71.7% vs. 37.2%) but it also maintained a higher negative predictive value (96.1% vs. 92.7%). The NRI of our RF model was 23.6%, which means that, among the 2400 patients in our study, nearly 1 in 4 patients screened with a prehospital ECG can be reclassified correctly using our machine-learning algorithm as compared to the automated software. Of note, using ROC-cutoff value at fixed specificity of 96% yields a sensitivity of 53%, which still outperforms the commercial model with NRI index of 16%.
Table 2.
Diagnostic accuracy metrics of the final RF model and the ECG reference standard.
| Performance Metrics |
Available automated ECG interpretation | Radom Forest model for ‘any culprit lesion’ |
|---|---|---|
| Sensitivity | 37.21% | 71.71% |
| Specificity | 95.61% | 84.73% |
| Positive predictive value | 50.53% | 36.13% |
| Negative predictive value | 92.66% | 96.13% |
| NRI index | Reference | 23.60% |
NRI: Net Reclassification Improvement.
To better understand the clinical implications of these results, we present two ECG examples that illustrate the importance of our findings. Fig. 2 displays the ECG of a 60-year-old male patient with 80% occlusion in one of LAD branches that subsequently had a stent placed in that artery. The automated algorithm detected a Q wave in V1 and V2 and suggested potential infarct but remained inconclusive. Our model reclassified this patient correctly for LAD occlusion. More interestingly, Fig. 3 shows the ECG of a 58-year-old male patient with 50% occlusion in LAD and 90% occlusion in LCX. The automated algorithm detected a right bundle branch block and did not interpret for infarct (i.e., false negative for culprit class). Our model reclassified this patient correctly, identifying a culprit lesion.
Fig. 2.
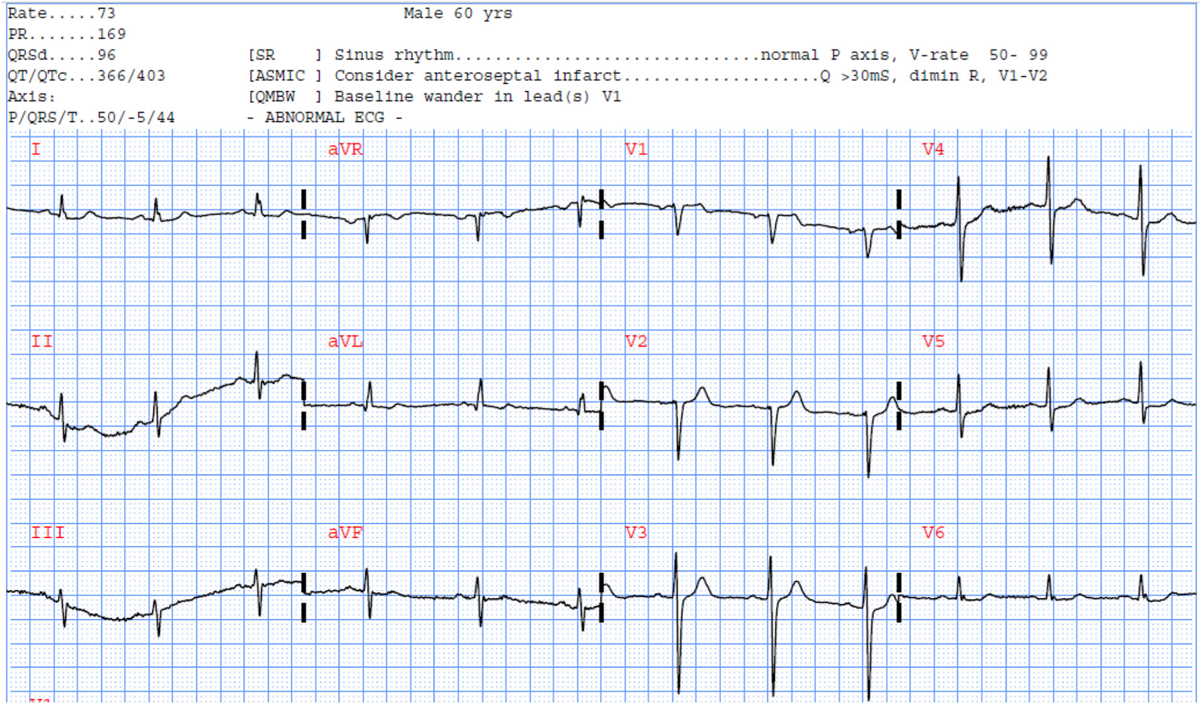
Selected ECG example #1 reclassified correctly using our RF model.
A 60-year-old male with 80% LAD occlusion.
Fig. 3.
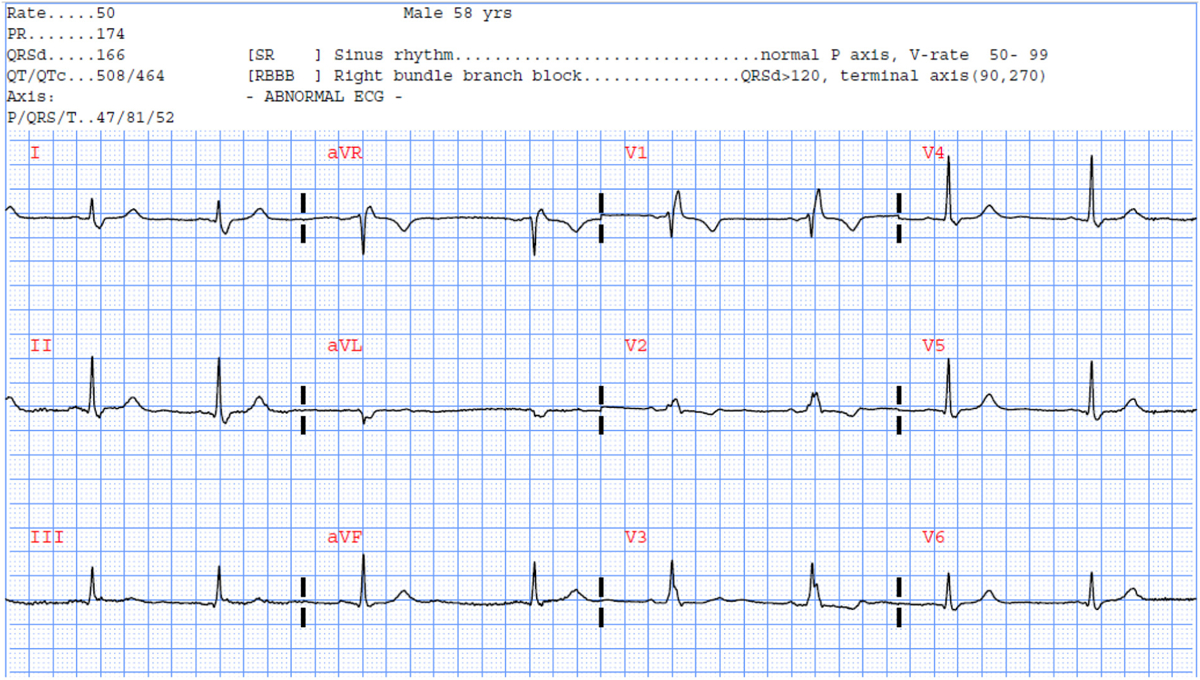
Selected ECG example #2 reclassified correctly using our RF model.
A 58-year-old male with 50% LAD occlusion and 90% LCX occlusion.
Furthermore, to interrogate the sources of misclassification in our model, we compared the demographic and clinical characteristics of our false negatives (n = 73, 3%) and true positives (n = 185, 8%). We found that our model tends to misclassify patient with true culprits who are diabetic and with significant coronary history (known CAD, old MI, prior PCI), and those with more subtle ST elevation or depression. Fig. 4 shows the 12-lead ECG of a 43-year-old male with history of hypertension, smoking, hyperlipidemia, known CAD, old MI, and prior catheterization. His angiogram revealed multiple 70%–80% occlusions of the diagonal and marginal branches of the LAD and received multiple stents. The commercial software noted the old anterior infarct but no acute changes, and our RF model predicted no culprit lesions.
Fig. 4.
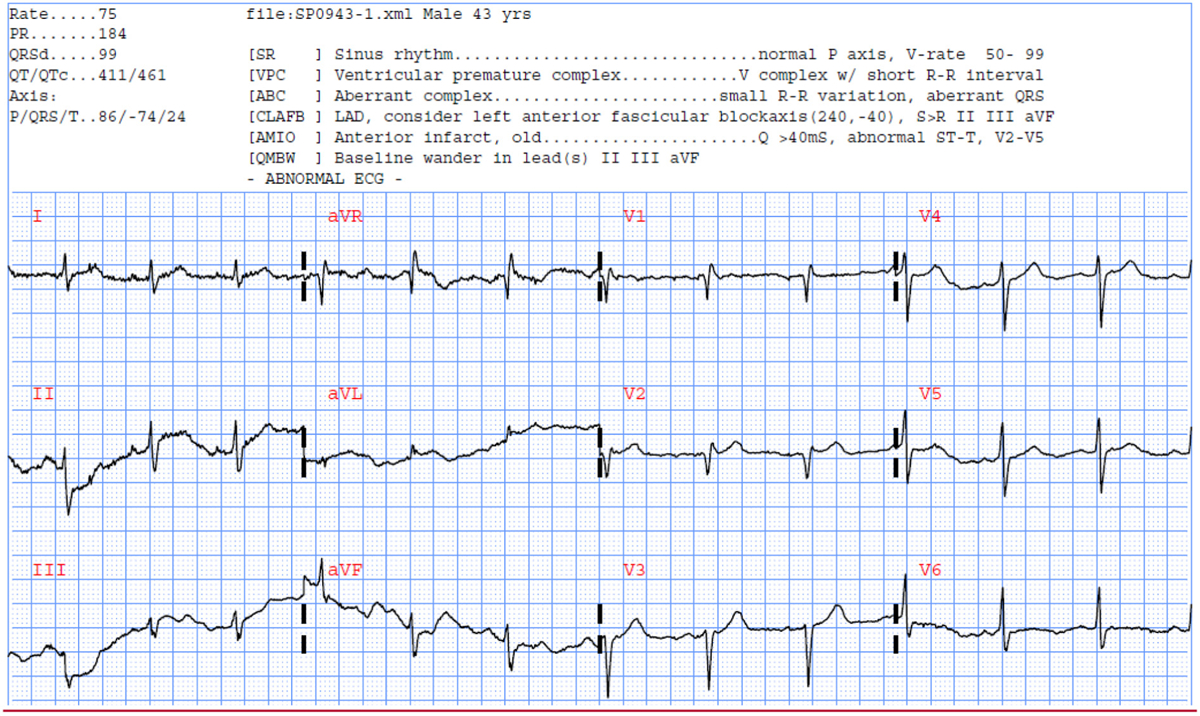
Selected ECG example #3 misclassified using our RF model.
A 43-year-old male with in-hospital STEMI and multivessel occlusions.
Insights into model interpretability
Finally, to enhance the interpretability of our findings, we plotted the features selected by each classifier according to their classification importance (Fig. 5). For the ‘any culprit lesion’ outcome, the union of the previously selected subsets for individual culprits (k = 90) were reviewed by experienced clinical scientists to investigate a plausible mechanistic link between the important features used by the machine learning algorithm and acute myocardial ischemia. The following features were found to be the most important predictive features contributing to the observed incremental gain in performance: metrics of ST80; Tpeak-Tend; spatial angle between QRS and T vectors; PCA ratio of STT waveform; T axis; and QRS waveform characteristics.
Fig. 5.
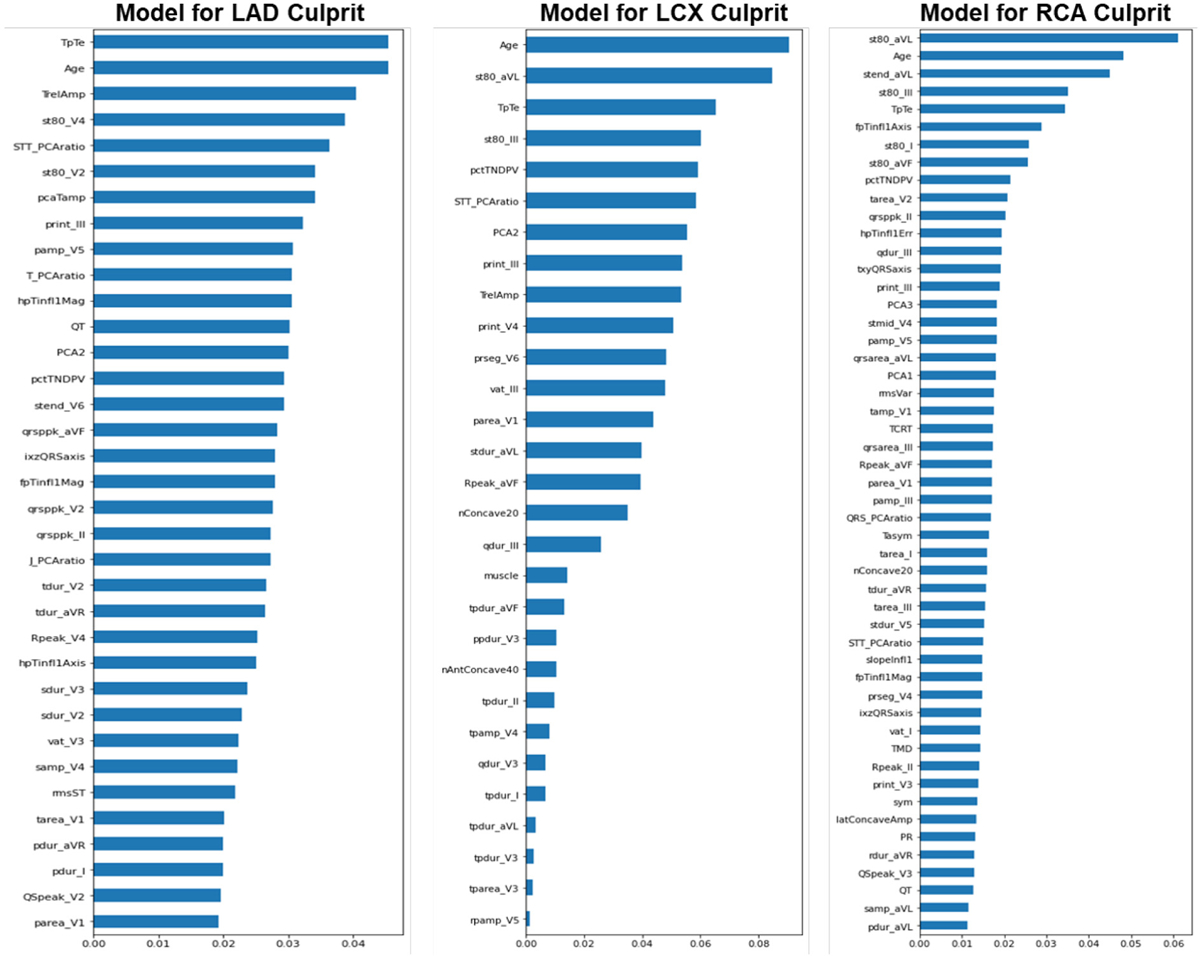
Importance rank of ECG features subset for predicting culprit lesions.
These plots show the feature importance bar graph as a function of the Gini importance (or mean decrease impurity) computed for the Random Forest structures of LAD, LCX, and RCA models. The 10 most important features for the LAD model were: TpTe, Age, TrelAmp (global T-wave amplitude relative to global R-wave peak), st80_V4, STT_PCAratio (ratio 2nd to 1st principal component, STT), st80_V2, pcaTamp, PR_int_III, P_amp_V5 and T_PCAratio (ratio 2nd to 1st principal component, T-wave). The 10 most important features for the LCX model were: Age, st80_aVL, TpTe, st80_III, pctTNDPV (relative % T-wave non-dipolar components, RMS), STT_PCAratio, PCA2, PR_int_III, TrelAmp and PR_int_V4. The 10 most important features for the RCA model were: st80_aVL, Age, stend_aVL, st80_III, TpTe, fpTinfl1Axis (frontal plane axis of global T-wave inflection point before T-wave peak), st80_I, st80_aVF, pctTNDPV and tarea_V2. LAD: Left Anterior Descending, LCX: Left Circumflex, RCA: Right Coronary Artery.
Discussion
In this study, we sought to explore whether using novel features of ventricular depolarization and repolarization dispersion on the standard 12-lead ECG can optimize the classification performance of the presence of culprit lesions in patients evaluated for suspected ACS. While maintaining a specificity of ~85%, our final RF model improved sensitivity over existing commercial interpretation software by ~35%, with an NRI of 23.6%. Novel metrics of ventricular activation time (i.e., transmural conduction delays), QRS and T axes and angles (i.e., global remodeling), non-dipolar electrical dispersion (i.e., circumferential ischemia), and PCA ratio of ECG waveforms (i.e., regional heterogeneity) played an important role in this improved reclassification performance.
Acute myocardial ischemia affects the configuration of the QRS complexes, the ST segments and the T waves, thus novel computational ECG features quantifying global depolarization and repolarization dispersion have been previously shown to contain prognostic information on myocardial injury beyond those captured by the amplitude of the ST segment alone. Waveform principal eigenvalues and corresponding ratios, as well as non-dipolar voltage beyond the 3rd eigenvalue, have been shown to specifically correlate with acute myocardial injury. [5,7,12] These metrics can quantify the magnitude of diffusion or widespread global changes secondary to altered signal propagation speed and velocity between healthy and ischemic myocardium.
Furthermore, the angles between depolarization and repolarization vectors and loops have been shown to correlate with ischemia. [6,13] These metrics can quantify the altered electromechanical forces in the ventricular myocardium secondary to global remodeling after myocardial injury. Other T wave indices (e.g., T peak-end) have also been shown to correlate with ischemia in prior studies. [14]
In this study, we reported the ECG features which have been selected by the RF models across the various culprit endpoints (Fig. 5). It is worth noting that the RCA model tended to detect different features than the LAD/LCX models. While all models were heavily influenced by age, T peak-end, and various ST80 features, the LAD/LCX models were more influenced by features based on the principal component analysis (PCA) of the 12-lead ECG. This in part seemed reasonable given that PCA analysis focuses on the orthogonal leads I, II, V1–V6, and repolarization distortions in the antero-lateral walls are likely to yield more spatial dispersion in the ECG signal. On the other hand, the RCA model was more influenced by the T axis dispersion in the frontal plane, as well as the non-dipolar voltage beyond main principal components, both which constitute markers of circumferential ischemia as one would expect with RCA occlusion.
Another important finding in our post-hoc sensitivity analyses was that patients with diabetes and pre-existing coronary history (CAD, old MI, prior revascularization) were more likely to be missed by our model (false negatives). This is an intriguing finding and supports the longstanding notion that such patients undergo chronic ischemic preconditioning and are likely to have existing collateral circulations, both of which can attenuate cellular and electrophysiological responses to ischemia. [15,16] This was further supported by our data that showed such patients were also less likely to manifest clinically significant ST elevation or ST depression. Such observations suggest that it is likely our incremental gain in accuracy (although suboptimal) might have hit the plateau of the 12-lead ECG’s diagnostic yield, and biomarker-driven approach would be the next step in the clinical diagnostic paradigm to triage such patients.
Finally, this study has important clinical implications. Nearly 10 million patients are evaluated for chest pain at the emergency department annually in the US. Nearly half of these patients are admitted because the initial evaluation is inadequate to rule in or out acute coronary disease. Our results indicate that novel features of ischemia, combined with RF-based intelligent classifiers, can help reclassify 1 in 4 of these patients evaluated for suspected ACS. This can potentially expedite treatment in those who need immediate care and save unnecessary costs (e.g., diagnostics, admissions) in those without acute coronary occlusions.
Conclusions
Metrics of ventricular electrical dispersion on the standard 12-lead ECG can augment the prediction of culprit coronary lesions during first medical contact in patients with suspected ACS, which has important clinical implications.
Acknowledgements
We thank the paramedics and leadership of the City of Pittsburgh Bureau of EMS for their partnership in completing this research, and for the acquisition and transmission of 12-lead ECGs for the study cohort as part of clinical care.
Funding
National Institute of Health grant # R01HL137761.
Footnotes
Declaration of Competing Interest
US Patent # 10820822.
References
- [1].Amsterdam EA, Wenger NK, Brindis RG, Casey DE Jr, Ganiats TG, Holmes DR Jr, et al. 2014 AHA/ACC guideline for the management of patients with non–ST-elevation acute coronary syndromes: executive summary: a report of the American College of Cardiology/American Heart Association task force on practice guidelines. Circulation. 2014;130(25):2354–94. [DOI] [PubMed] [Google Scholar]
- [2].O’gara PT, Kushner FG, Ascheim DD, Casey DE, Chung MK, De Lemos JA, et al. 2013 ACCF/AHA guideline for the management of ST-elevation myocardial infarction: a report of the American College of Cardiology Foundation/American Heart Association task force on practice guidelines. J Am Coll Cardiol. 2013;61(4):e78–140. [DOI] [PubMed] [Google Scholar]
- [3].Garvey JL, Zegre-Hemsey J, Gregg R, Studnek JR. Electrocardiographic diagnosis of ST segment elevation myocardial infarction: an evaluation of three automated interpretation algorithms. J Electrocardiol. 2016;49(5):728–32. [DOI] [PMC free article] [PubMed] [Google Scholar]
- [4].Birnbaum Y, Nikus K, Kligfield P, Fiol M, Barrabés JA, Sionis A, et al. The role of the ECG in diagnosis, risk estimation, and catheterization laboratory activation in patients with acute coronary syndromes: a consensus document. Ann Noninvasive Electrocardiol. 2014;19(5):412–25. [DOI] [PMC free article] [PubMed] [Google Scholar]
- [5].Lux RL. Non-ST-segment elevation myocardial infarction: a novel and robust approach for early detection of patients at risk. J Am Heart Assoc. 2015;4(7):e002279. [DOI] [PMC free article] [PubMed] [Google Scholar]
- [6].Strebel I, Twerenbold R, Wussler D, Boeddinghaus J, Nestelberger T, de Lavallaz JdF, et al. Incremental diagnostic and prognostic value of the QRS-T angle, a 12-lead ECG marker quantifying heterogeneity of depolarization and repolarization, in patients with suspected non-ST-elevation myocardial infarction. Int J Cardiol. 2019;277: 8–15. [DOI] [PubMed] [Google Scholar]
- [7].Al-Zaiti S, Callaway CW, Kozik TM, Carey M, Pelter M. Clinical utility of ventricular repolarization dispersion for real-time detection of non-ST elevation myocardial infarction in emergency departments. J Am Heart Assoc. 2015;4(7):e002057. [DOI] [PMC free article] [PubMed] [Google Scholar]
- [8].Al-Zaiti S, Besomi L, Bouzid Z, Faramand Z, Frisch S, Martin-Gill C, et al. Machine learning-based prediction of acute coronary syndrome using only the pre-hospital 12-lead electrocardiogram. Nat Commun. 2020;11(1):1–10. [DOI] [PMC free article] [PubMed] [Google Scholar]
- [9].Bouzid Z, Faramand Z, Gregg Richard E, Frisch Stephanie O, Martin-Gill C, Saba S, et al. In search of an optimal subset of ECG features to augment the diagnosis of acute coronary syndrome at the emergency department. J Am Heart Assoc. 2021; 10(3):e017871. [DOI] [PMC free article] [PubMed] [Google Scholar]
- [10].Al-Zaiti SS, Martin-Gill C, Sejdic E, Alrawashdeh M, Callaway C. Rationale, development, and implementation of the electrocardiographic methods for the Prehospital identification of non-ST elevation myocardial infarction events (EMPIRE). J Electrocardiol. 2015;48(6):921–6. [DOI] [PubMed] [Google Scholar]
- [11].Cannon CP, Battler A, Brindis RG, Cox JL, Ellis SG, Every NR, et al. American College of Cardiology key data elements and definitions for measuring the clinical management and outcomes of patients with acute coronary syndromes: A report of the American College of Cardiology Task Force on Clinical Data Standards (Acute Coronary Syndromes Writing Committee) Endorsed by the American Association of Cardiovascular and Pulmonary Rehabilitation, American College of Emergency Physicians, American Heart Association, Cardiac Society of Australia & New Zealand, National Heart Foundation of Australia, Society for Cardiac Angiography and Interventions, and the Taiwan Society of Cardiology. J Am Coll Cardiol. 2001; 38(7):2114–30. [DOI] [PubMed] [Google Scholar]
- [12].Abächerli R, Twerenbold R, Boeddinghaus J, Nestelberger T, Mächler P, Sassi R, et al. Diagnostic and prognostic values of the V-index, a novel ECG marker quantifying spatial heterogeneity of ventricular repolarization, in patients with symptoms suggestive of non-ST-elevation myocardial infarction. Int J Cardiol. 2017;236:23–9. [DOI] [PubMed] [Google Scholar]
- [13].Strebel I, Twerenbold R, Boeddinghaus J, Abächerli R, Rubini Giménez M, Wildi K, et al. Diagnostic value of the cardiac electrical biomarker, a novel ECG marker indicating myocardial injury, in patients with symptoms suggestive of non-ST-elevation myocardial infarction. Ann Noninvasive Electrocardiol. 2018;23(4):e12538. [DOI] [PMC free article] [PubMed] [Google Scholar]
- [14].Lines G, Oliveira B, Skavhaug O, Maleckar M. Simple T wave metrics may better predict early ischemia as compared to ST segment. IEEE Trans Biomed Eng. 2016;PP (99):1. [DOI] [PubMed] [Google Scholar]
- [15].Al-Zaiti SS, Abu-Jaradeh O, Faramand Z, Al-Ghouleh I, Conley Y. Effect of Ischemic preconditioning on apoptosis and autophagy: a potential key role in ST-elevation vs. non-ST elevation acute myocardial infarction. Circulation. 2019;140(Suppl_1) A16285–A. [Google Scholar]
- [16].Cohen M, Yang X-M, Downey J. Attenuation of ST segment elevation during repetitive coronary occlusions truly reflects the protection of ischemic preconditioning and is not an epiphenomenon. Basic Res Cardiol. 1997;92(6):426–34. [DOI] [PubMed] [Google Scholar]