Abstract
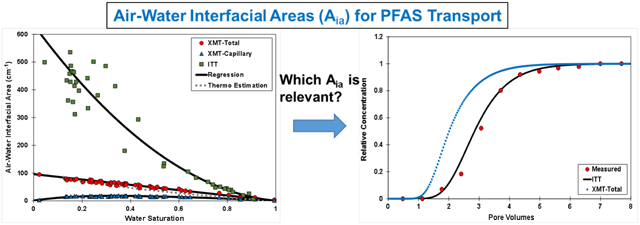
Per and polyfluoroalkyl substances (PFAS) present in the soil pose a long-term threat to groundwater. Robust characterization and modeling of PFAS retention and transport in unsaturated systems requires an accurate determination of the magnitude of air-water interfacial area (AWIA). Multiple methods are available for measuring or estimating air-water interfacial area, including x-ray microtomography (XMT), various aqueous and gas-phase interfacial tracer-test (ITT) methods, and thermodynamic-based estimation methods. AWIAs determined with the different methods can vary significantly. Therefore, it is critical to determine which measurement methods are relevant for application to PFAS retention and transport. This is achieved by employing AWIAs determined with different methods to simulate the results of miscible-displacement experiments reported in the literature for the transport of perfluorooctanoic acid (PFOA) in an unsaturated quartz sand. Measured PFOA breakthrough curves were successfully predicted using AWIA values measured by aqueous ITT methods. Conversely, AWIAs measured with the XMT method and estimated with the thermodynamic method under-predicted the magnitude of retardation and could not successfully simulate the measured transport data. These results indicate that the ITT method appears to provide the most appropriate AWIA values for robust characterization and modeling of PFAS transport in unsaturated systems. The long-term impact of employing different AWIA values on PFOA leaching in the vadose zone was simulated for a representative AFFF application scenario. The predicted timeframes for PFOA migration to groundwater varied from 3 to 6 to 20 years depending on which AWIA was used in the simulation. These relatively large differences would result in significantly different risk-assessment outcomes. These results illustrate that it is critical to employ the AWIA that is most representative of PFAS retention for accurate predictions of PFAS leaching in the vadose zone.
Keywords: PFAS, adsorption, retention, variably saturated, leaching
Graphical Abstract
1. Introduction
Per and polyfluoroalkyl substances (PFAS) are contaminants of critical concern given their widespread occurrence, environmental persistence, and deleterious impacts to human and ecosystem health. Soil has been identified as a primary long-term source of PFAS for many sites (e.g., Xiao et al., 2015; Weber et al., 2017; Anderson et al., 2019; Dauchy et al., 2019; Høisæter et al., 2019; Washington et al., 2019; Brusseau et al., 2020a). As such, there is great interest in the transport behavior of PFAS in soil and the vadose zone, and their potential for leaching to groundwater. Adsorption at the air-water interface has been demonstrated to be a critical retention process for the transport of PFAS in unsaturated porous media, as illustrated by the results of miscible-displacement experiments and mathematical-model simulations (Lyu et al., 2018; Brusseau et al., 2019; Brusseau, 2020; Guo et al., 2020; Lyu and Brusseau, 2020; Lyu et al., 2020; Silva et al., 2020; Yan et al., 2020; Brusseau et al., 2021; Li et al., 2021). An accurate determination of the magnitude of air-water interfacial area present in the system is therefore required for robust characterization and modeling of PFAS retention and transport in unsaturated systems.
Multiple methods are available for measuring or estimating air-water interfacial area (AWIA) for unsaturated porous media. These include advanced-imaging measurement methods such as x-ray microtomography (XMT), various aqueous and gas-phase interfacial tracer-test (ITT) methods, and thermodynamic-based estimation methods (e.g., Bradford and Leij, 1997; Brusseau et al., 1997; Kim et al., 1997; Anwar and Matsubayashi, 2000; Anwar et al., 2000; Schaefer et al., 2000; Anwar, 2001; Culligan et al., 2004; Brusseau et al., 2006, 2007). Because the different methods characterize different air-water interfacial domains, they typically produce differing measurements of AWIA for the same porous medium. For example, AWIAs ranging from 18 to ~100 cm−1 depending upon the method have been measured for a quartz sand with a water saturation (Sw) of ~0.65 (Araujo and Brusseau, 2020; Brusseau, 2021). The use of inaccurate AWIAs may cause significant errors in the development of conceptual site models and in the outcomes of risk assessments. Hence, it is critical to determine which measurements are most representative for characterizing PFAS retention and transport.
The objective of this work is to examine the relevancy of different air-water interfacial area measurement methods for application to PFAS retention and transport in unsaturated porous media. This is achieved by employing AWIAs determined with different methods to simulate the results of miscible-displacement experiments reported in the literature for the transport of perfluorooctanoic acid (PFOA) in a quartz sand. The long-term impact of employing different AWIAs on PFOA leaching and mass-discharge to groundwater is then investigated through a series of modeling simulations conducted for a representative aqueous film-forming foam (AFFF) application at a model fire training area site.
2. Materials and Methods
2.1. PFOA Transport Data
The transport of PFOA, perfluorooctane sulfonic acid (PFOS), and GenX in unsaturated quartz sand has been successfully simulated in our prior studies using measured AWIAs (Brusseau et al., 2019; Brusseau, 2020; Yan et al., 2020; Brusseau et al., 2021). However, the impact of employing different sources of measured AWIA was not examined. For the present study, the primary PFOA transport data sets to be simulated were reported recently by a separate research group (Lyu et al., 2020; Li et al., 2021). The use of separate literature data increases the degree of difficulty of the evaluation. The experiments were conducted with quartz sands purchased from Unimin Corp., including one with a diameter of 0.35–0.45 mm. The two studies in combination include two sets of replicate experiments conducted with an electrolyte solution comprised of 1.5 mM NaCl, one with a water saturation of 0.45 (Lyu et al., 2020) and the other 0.64 (Li et al., 2021). These measured PFOA breakthrough-curve data were not simulated with a transport model in the original studies.
The experiments were conducted under steady, unsaturated-flow conditions. The measured effluent recoveries were close to 100% for the experiments. Complementary experiments were conducted for saturated conditions to characterize the impact of solid-phase sorption on PFOA transport. A relatively low input concentration of ~7 μg/L was used for the experiments. This concentration is much lower than PFOA’s critical reference concentration, which is ~10 mg/L (Brusseau and Van Glubt, 2021). Prior research has demonstrated that PFOA transport under unsaturated conditions is ideal for this case (Brusseau et al., 2021). This includes effectively linear air-water interfacial adsorption and the absence of surfactant-induced flow phenomena.
2.2. Mathematical Modeling
Two one-dimensional transport models are used for the study. The first model accounts for nonlinear, rate-limited solid-phase sorption and nonlinear, rate-limited air-water interfacial adsorption (Brusseau, 2020). Flow is assumed to be steady and surfactant-induced flow is not incorporated. The second model includes nonsteady flow and the potential for surfactant induced flow, as well as nonlinear, rate-limited solid-phase sorption and nonlinear, rate-limited air-water interfacial adsorption (Guo et al., 2020). Full descriptions of the governing equations, simulation conditions, and solution methods are provided in the cited references. These two models have been demonstrated to produce accurate independently-predicted simulations of PFAS transport measured in unsaturated-flow miscible-displacement experiments (Brusseau et al., 2019; Brusseau, 2020; Yan et al., 2020; Brusseau et al., 2021). The first model is used to simulate the miscible-displacement transport experiment data, whereas the second model is used to conduct simulations of long-term PFAS leaching under field conditions.
The first model was employed in a predictive mode for simulating the experiment data, with values for all input parameters determined independently. Hence, no model calibration or fitting to the measured PFOA breakthrough curves is used for the study. The retardation factor (R) for aqueous phase transport of solute undergoing retention by adsorption to solid–water and air–water interfaces is given as (e.g., Lyu et al., 2018):
| (1) |
where Kd is the solid-phase adsorption coefficient (cm3/g), Kia is the air-water adsorption coefficient (cm), AWIA is the specific air–water interfacial area (cm2/cm3), ρb is porous-medium bulk density (g/cm3), and θw is volumetric water content (volume of water per volume of porous medium,-). θa is volumetric air content (−) and n is porosity, by phase balance, θw + θa = n. Water saturation is defined as Sw= θw/n.
The air-water interfacial adsorption coefficient was determined from surface-tension data reported by Li et al. (2021). Recent results have demonstrated that Kia values determined from surface-tension data are representative of PFAS retention during transport in unsaturated media (Lyu et al., 2018; Brusseau et al., 2019; Brusseau, 2020, 2021; Yan et al., 2020; Brusseau et al., 2021). The Kd for PFOA was obtained from analysis of the reported saturated-flow transport experiments. Values for bulk density, porosity, and water content are reported in the source papers. Reported values for dispersivity were obtained from analysis of the nonreactive tracer transport data presented in the source papers. Robust measurements of air-water interfacial area have been reported for Accusand quartz sand in our prior studies. These data are discussed in the forthcoming section.
The second model was used to conduct long-term leaching simulations for a representative AFFF application scenario. The simulations were designed to match the original simulations presented in Guo et al. (2020), with the current set focused on investigating the impact of employing different AWIA values. It is assumed that PFOA is released to the vadose zone due to periodic fire training activities that occur every 10 days for a period of 20 years. An initial concentration of 0.9 mg/L is used for PFOA in the diluted AFFF solution (Høisæter et al., 2019). The AFFF application rate is based on standard practices, as discussed in Guo et al. (2020). The impact of precipitation and evaporation on PFOA migration is accounted for in the simulations in addition to infiltration associated with AFFF applications. A 10-year long, 30-min resolution rainfall dataset measured at a site in Arizona (representing a semiarid climate) is repeated to generate longer-term rainfall datasets used for the simulations. The Szyszkowski equation was fit to surface-tension data measured for PFOA in synthetic groundwater to parameterize air-water interfacial adsorption. Measured data for sorption of PFOA by the Accusand is used to parameterize solid-phase sorption. The simulation domain, 4-m in depth, is assumed to be homogeneous with properties representative of the Accusand. Additional details about the numerical methods, model setup, and input-parameter values are provided in Guo et al. (2020).
3. Results and Discussion
3.1. Measured and Estimated Air-Water Interfacial Areas
Measurements of air-water interfacial area reported in our prior studies for the 0.35-mm diameter Accusand quartz sand are aggregated in Figure 1. These data include measurements obtained with a modified version of the standard aqueous ITT method (Brusseau et al., 2015, 2020b; El Ouni et al., 2021), a dual-surfactant ITT method (Brusseau et al., 2015), a mass-balance ITT method (Araujo et al., 2015), and XMT (Araujo and Brusseau, 2020). Air-water interfacial area is comprised of both capillary interfaces (terminal menisci, pendular rings, wedges) and interfaces associated with wetting-fluid films solvating solid surfaces. The XMT method allows quantitative delineation between capillary and film-associated interfacial area. Conversely, ITT methods produce measures of total (capillary + film) AWIA. In addition, they characterize the contributions of solid surface roughness to film-associated AWIA whereas XMT typically does not (Brusseau et al., 2007).
Figure 1.
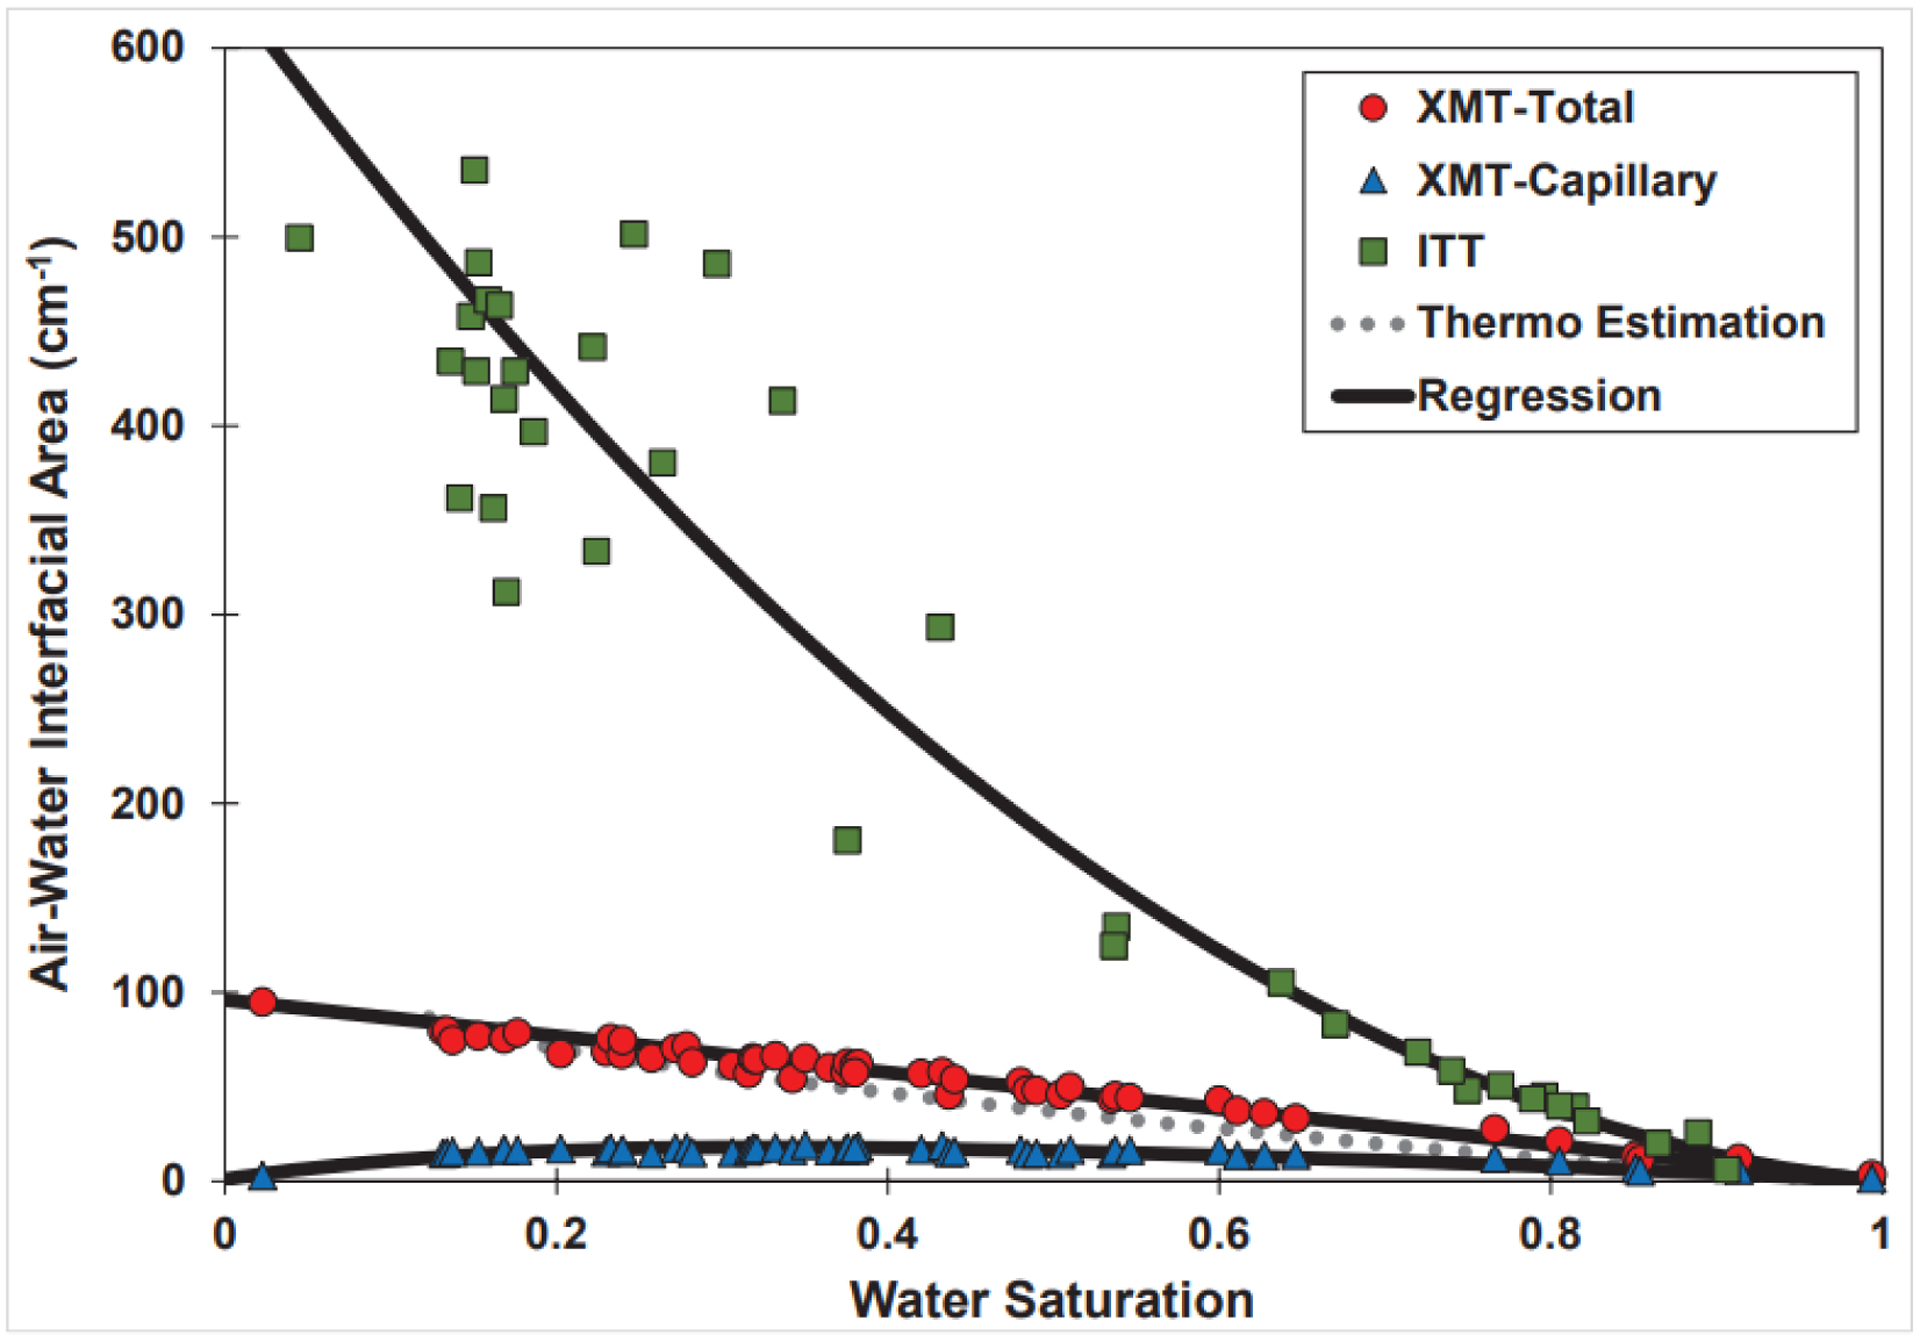
Air-water interfacial areas measured or estimated for quartz sand. XMT is x-ray microtomography; ITT is interfacial tracer test; thermos is thermodynamic-estimation method. Data are compiled from the sources cited in the text.
Inspection of Figure 1 reveals significant differences in the measured AWIAs obtained with the ITT versus XMT methods. The capillary AWIA measured with XMT is a non-monotonic nonlinear function of water saturation, with a maximum value <20 cm−1. Conversely, the total AWIA measured with XMT is a linear function of water saturation, with a maximum AWIA of close to 100 cm−1. The AWIAs measured by the ITT methods are observed to be a monotonic exponential function of water saturation, with a maximum AWIA >600 cm−1. As a result of these differences in the AWIA-Sw functions, the AWIA measured for a given water saturation varies quite significantly among the different methods. In particular, the differences increase greatly at lower water saturations. The data presented in Figure 1 will be used to obtain AWIA input values for the model simulations.
In addition to different measurement methods, various approaches have been developed to estimate or predict AWIAs. One means by which to estimate AWIA is to employ the so-called thermodynamic approach (Leverett, 1941; Bradford and Leij, 1997; Anwar and Matsubayashi, 2000; Dobson et al., 2006). This method is based on using measured soil-water characteristic (SWC) data. The method was applied to a triplicate set of SWC data measured for the Accusand (Figure 2). The estimated AWIAs are similar to the total AWIAs measured with XMT (Figure 1).
Figure 2.
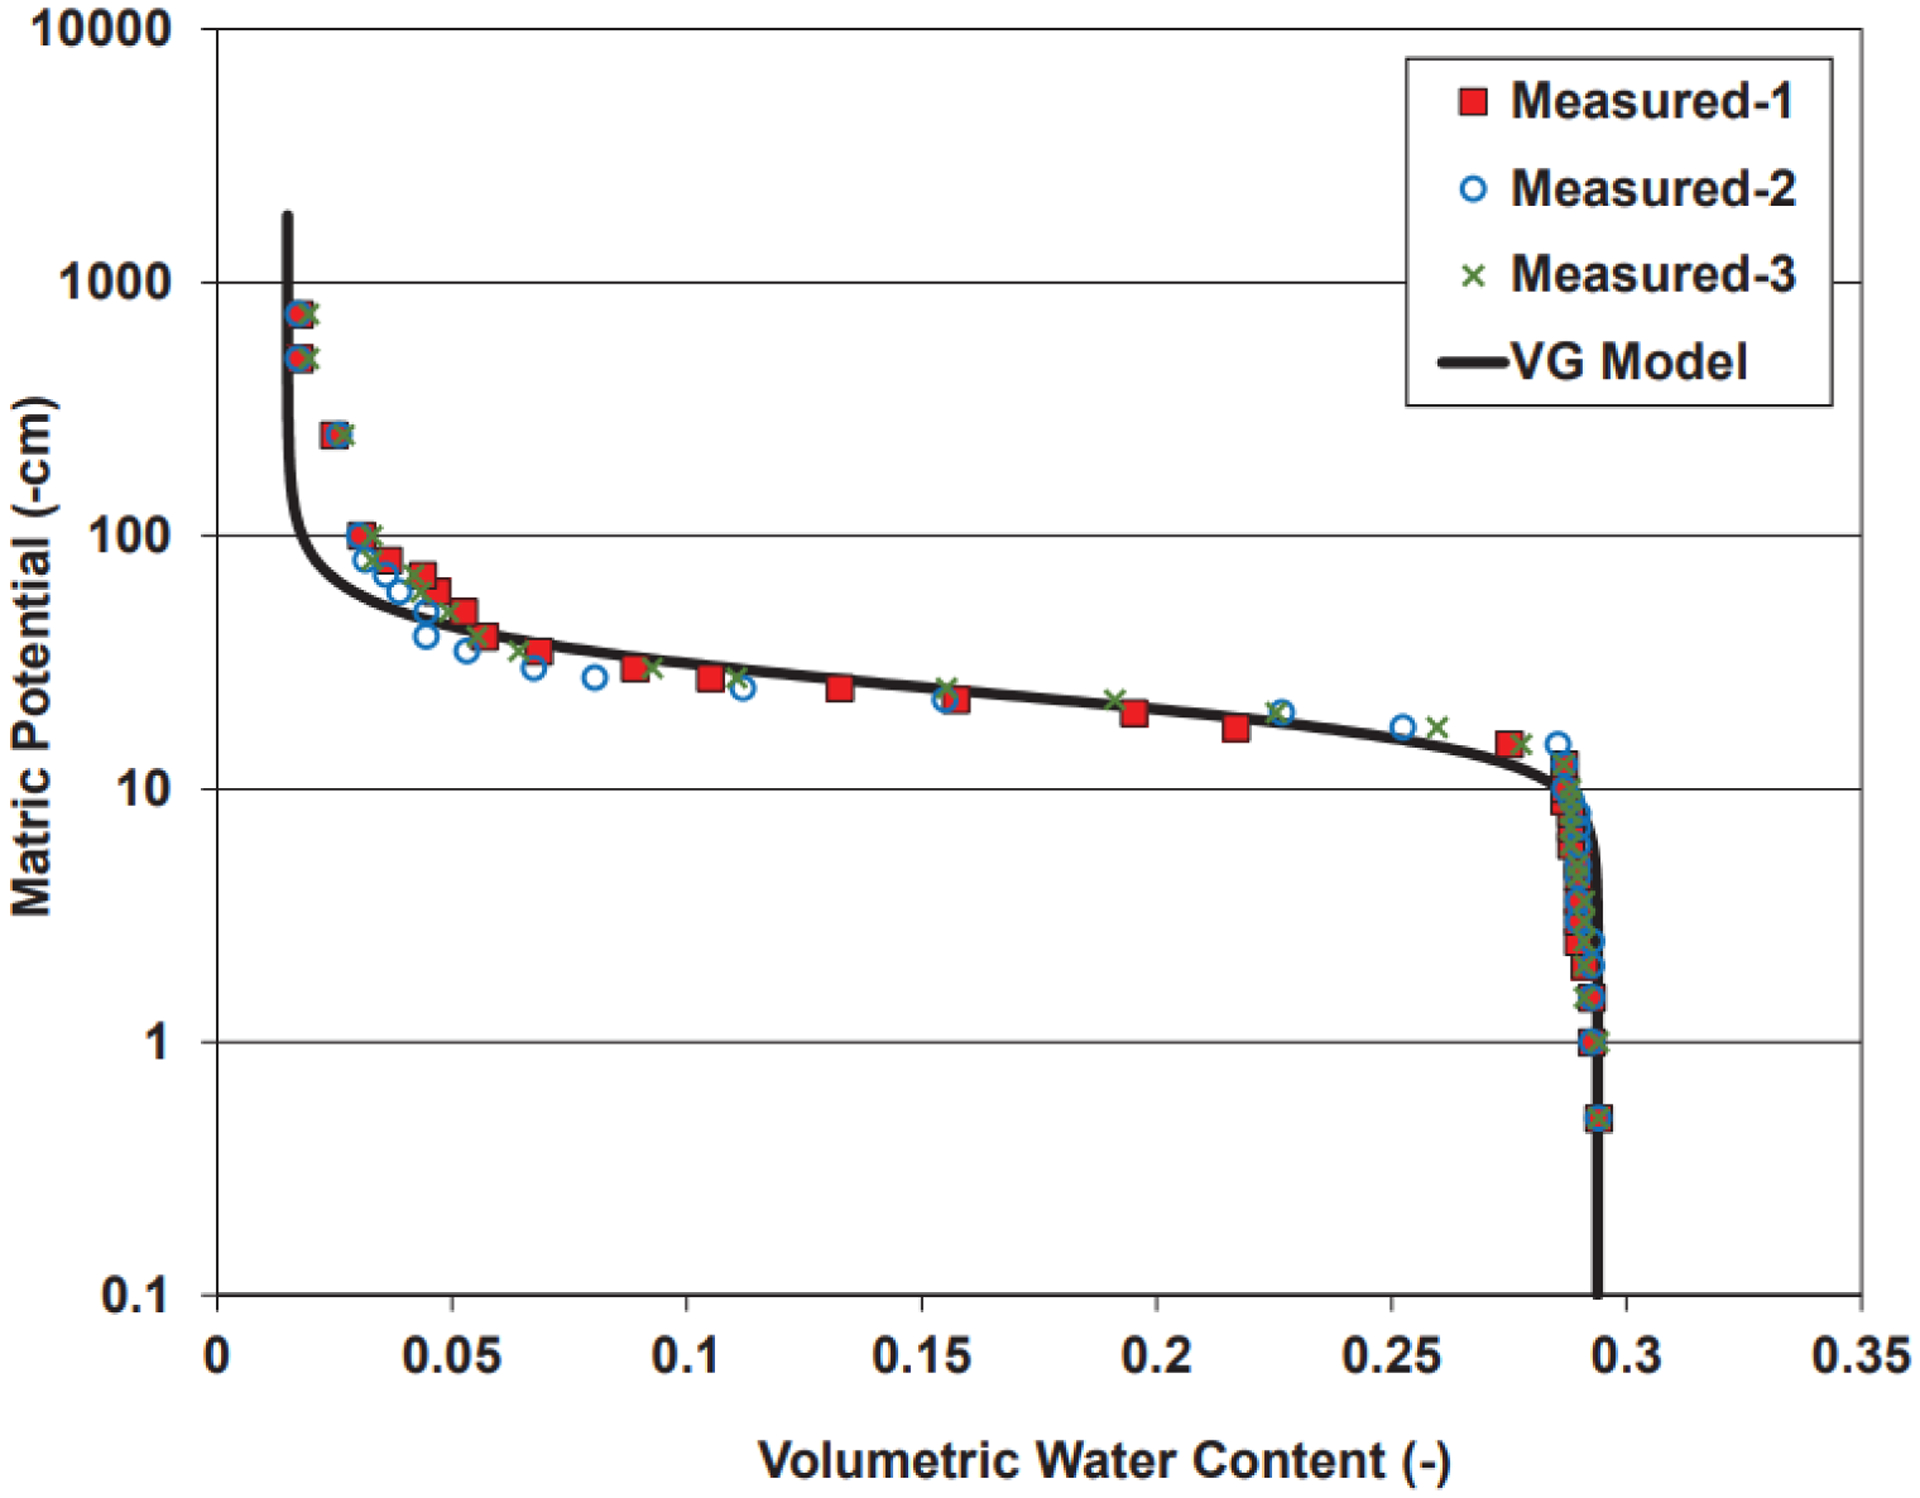
Soil-water characteristic data measured for the Accusand. The solid curve represent a fit of the Van Genuchten model to the data.
3.2. Simulated PFOA Transport with AWIA Measured by ITT Methods
The measured breakthrough curve for PFOA transport in the unsaturated sand at the lower water saturation is presented in Figure 3. The measured retardation factor is approximately 4. This value is much larger than the retardation factor measured for saturated-flow conditions (<1.1). The disparity illustrates the significant impact of air-water interfacial adsorption on PFOA retention for this system. The PFOA breakthrough curve measured for the higher water saturation is shown in Figure 4A. The magnitude of retardation (R = ~2) is smaller than that measured for the lower-saturation experiment, illustrating the impact of a higher water saturation and smaller AWIA on retention. While this behavior was not discussed in the source papers, these results are consistent with our prior results (Lyu et al. 2018). The breakthrough curves do not exhibit any significant self-sharpening of the arrival front or extended tailing of the elution front, manifestations of which are typical for transport impacted by nonlinear interfacial adsorption (e.g., Brusseau et al., 2021). This is an indication that PFOA adsorption is effectively linear for the conditions of the experiments.
Figure 3.
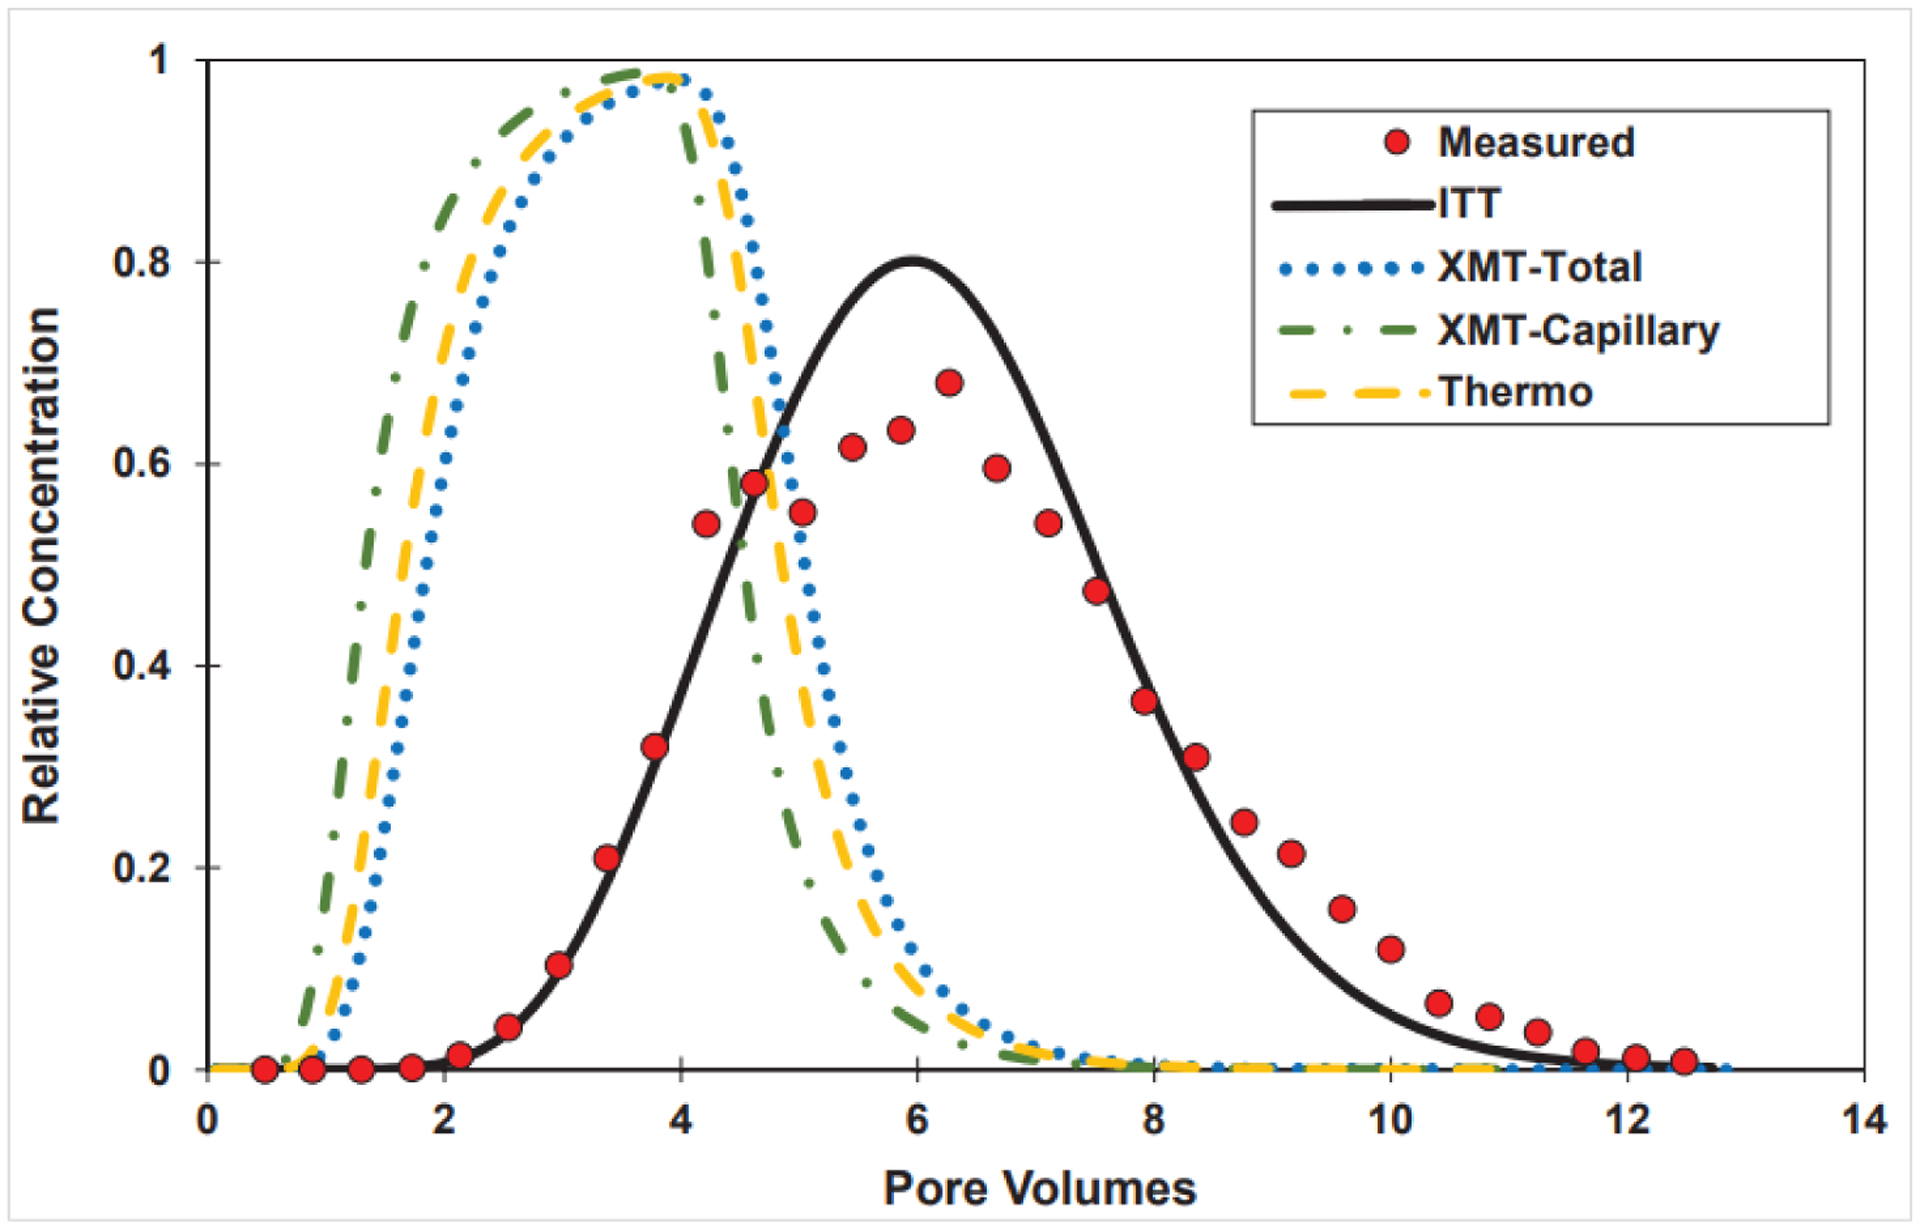
Measured and simulated transport of PFOA in unsaturated sand (Sw = 0.45; 1.5 mM NaCl solution; input concentration = 6.8 μg/L). Measured data from Lyu et al., 2020. Simulations produced with the model of Brusseau (2020). AWIA was measured or estimated using the methods discussed in the main text. ITT is the interfacial tracer test method; XMT is the x-ray microtomography method; Thermo is the thermodynamic estimation method.
Figure 4.
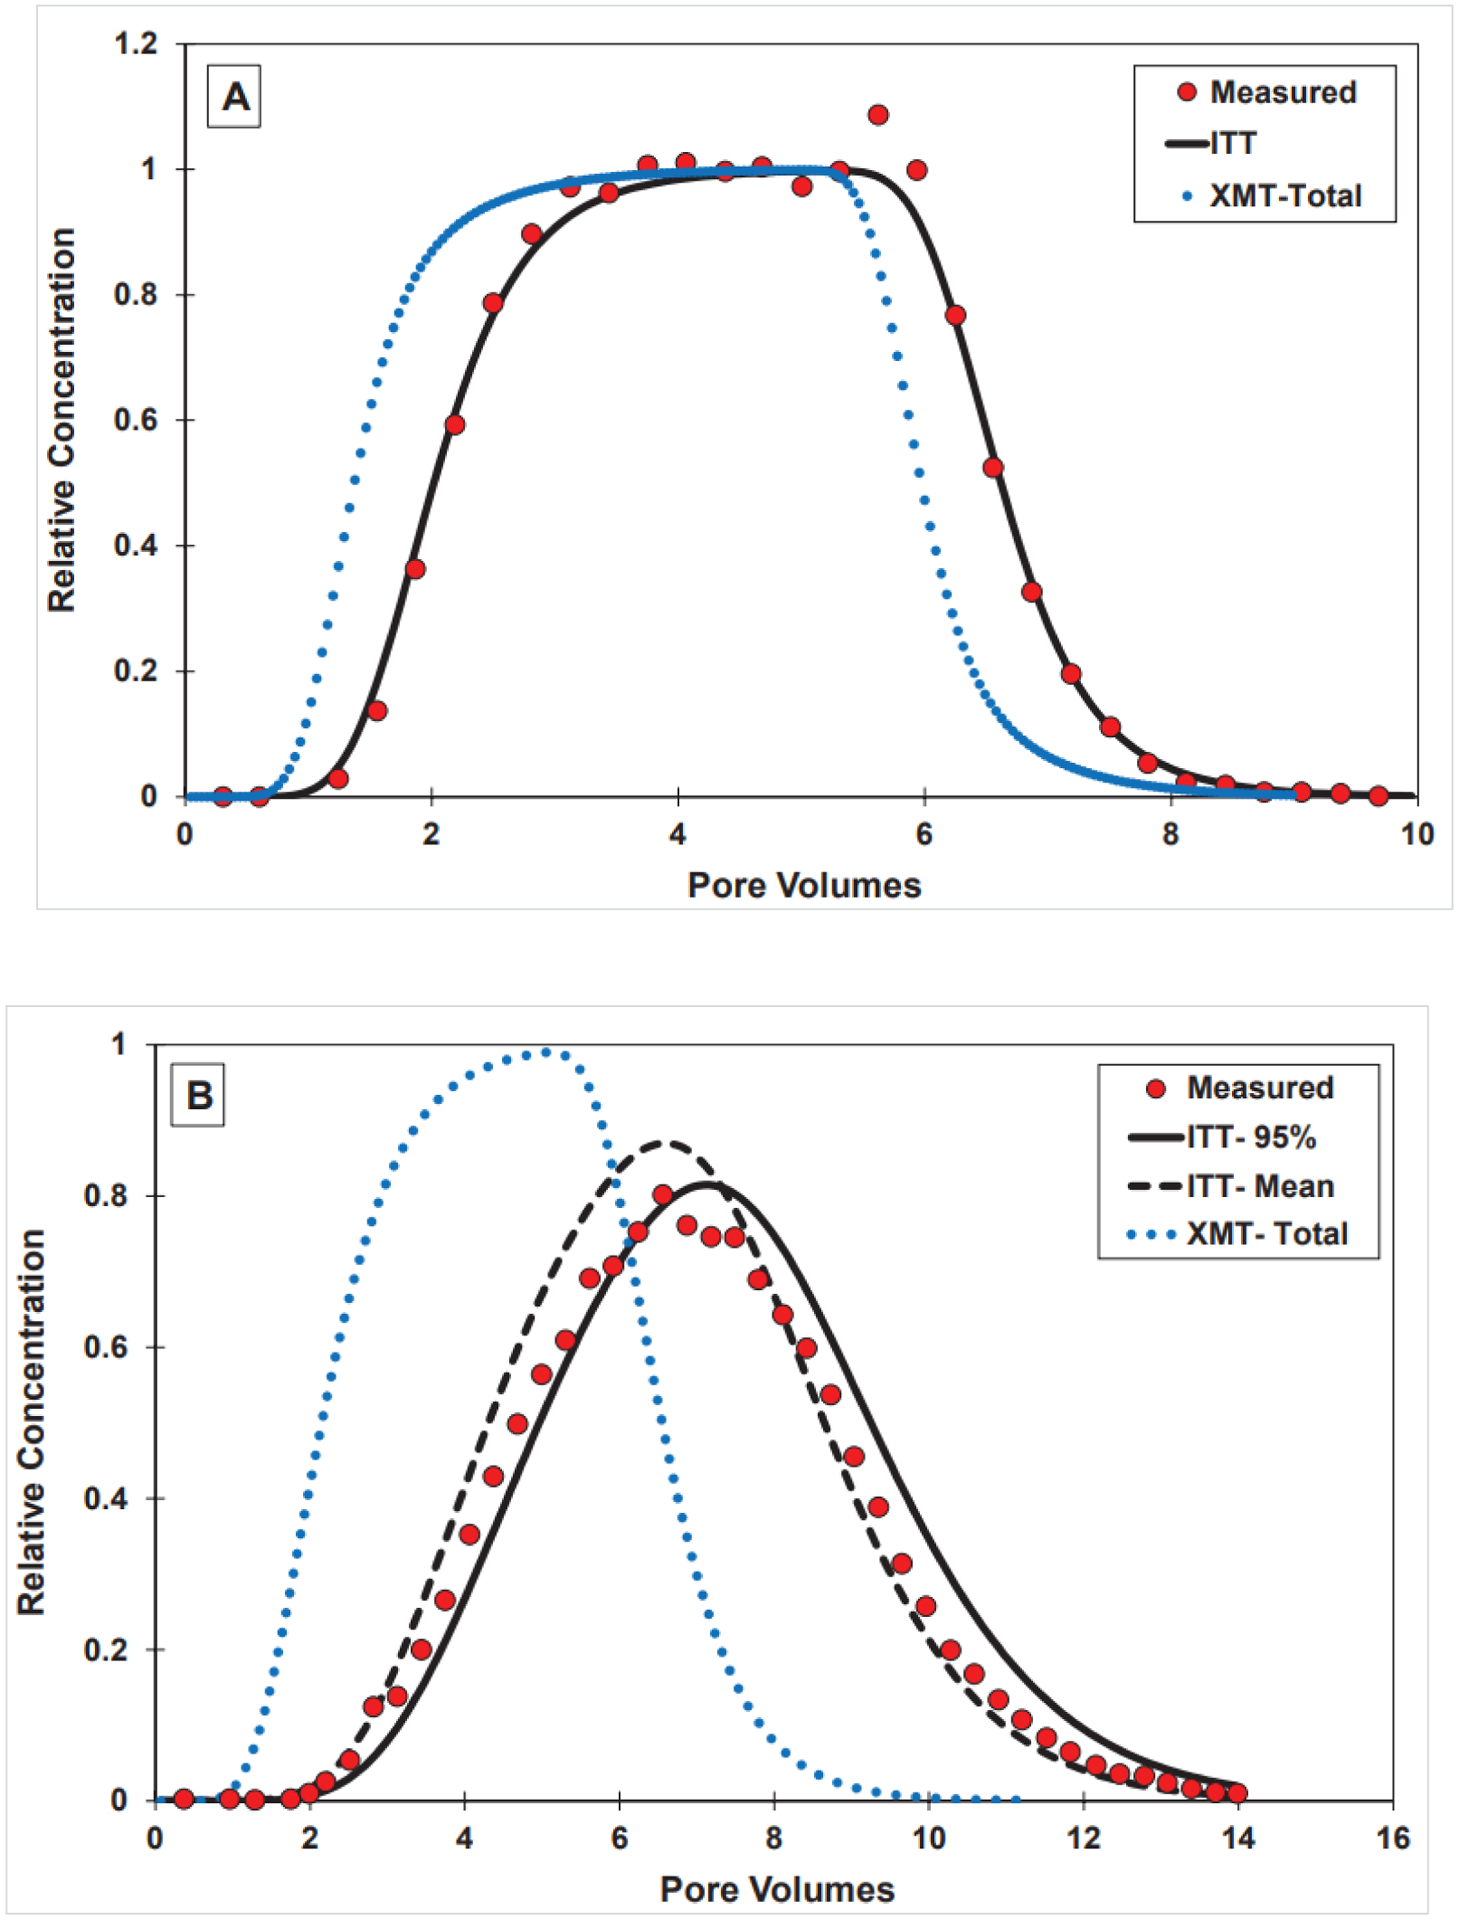
Measured and simulated transport of PFOA in unsaturated sand (Sw = 0.64; input concentration = ~7 μg/L). Measured data from Li et al., 2021. Simulation produced with the model of Brusseau (2020). AWIA was measured using the methods discussed in the main text. (A) 1.5 mM NaCl solution; (B) 30 mM CaCl2 solution.
The impact of employing different AWIAs for predicting the breakthrough curve measured for the lower water-saturation experiment will now be tested, with the aqueous-phase ITT-measured AWIA examined first. The breakthrough curve simulated with the model using the measured mean values for Kia (0.00193 cm−1) and AWIA (213 cm) under-predicted the magnitude of retardation and therefore did not match the measured breakthrough curve (data not shown). It is important to consider measurement uncertainty when using independently-determined input parameters for simulations. Of the several retention-related input parameters required (see equation 1), Kia and AWIA typically have the greatest measurement uncertainties. These uncertainties were discussed in detail by Brusseau (2021). For example, 10 separate measurements of PFOA surface tensions were compiled and analyzed to determine the measurement uncertainty for Kia, which was 25%. Measurement uncertainties for ITT-measured fluid-fluid interfacial areas range from ~10% to >30% (Dobson et al., 2006; Brusseau et al., 2008, 2015; Brusseau, 2021). A value of 15% will be used herein.
The upper 95% confidence-interval values for Kia (0.0024 cm−1) and AWIA (245 cm) were used for a second simulation. The simulated curve provides a good match to the measured data (Figure 3). It is important to recall that this simulation represents an independent prediction, with values for all input parameters obtained independently of the measured breakthrough curve.
The ability of the model to accurately predict the measured transport is further tested by attempting to predict two PFOA breakthrough curves obtained for the higher water-saturation experiments. The first data set originates from the experiments conducted with the same 1.5 mM NaCl electrolyte solution as used for the experiment that generated the data presented in Figure 3. The only parameter changed for this simulation is the AWIA, due to the change in water saturation. Inspection of Figure 4A shows that the predicted simulation provides an excellent match to the measured data. The second data set represents the experiments conducted with 30 mM CaCl2 electrolyte solution. For this prediction, the relevant Kia value measured for that solution is used. Two simulations are presented, one employing the measured value and the other the estimated upper-95% value. It is observed that the two simulations bracket the measured data (Figure 4B). The two data sets simulated in Figure 4 represent the two extremes of solution ionic strengths used for the transport experiments presented in Li et al. (2021), which span a broad range in PFOA surface activities.
The good predictions of transport presented in Figures 3 and 4 indicate that the experiment data are predictable and robust, and that the mathematical model accurately represents the processes influencing PFOA retention and transport in this system. Notably, PFOA transport was simulated with air-water interfacial adsorption treated as linear (constant Kia). This absence of nonlinear adsorption is consistent with the observed transport behavior and with the results of prior transport experiments (Brusseau et al., 2021). As noted above, the input concentration used for the experiments is much lower than the critical reference concentration of PFOA, and as such linear adsorption is anticipated. The simulations were also conducted with air-water interfacial adsorption treated as effectively instantaneous. This is also consistent with prior results (Brusseau et al., 2019; Brusseau, 2020; Brusseau et al., 2021).
3.3. Simulated PFOA Transport with AWIA Measured or Estimated by Other Methods
The robust predictions presented in Figures 3 and 4 also indicate that the values used for the input parameters are representative and accurate. This includes the values used for AWIA, which were measured by the aqueous ITT methods. The impact of using AWIAs measured with the XMT methods is shown in Figure 3. All input parameter values are identical to the prior simulations, except for the use of different measured AWIAs. The measurement uncertainty for the XMT method is typically smaller than for the ITT methods (Araujo and Brusseau, 2020). However, the upper 95% confidence-interval values were used for the simulations for consistency. The predicted curve employing the XMT capillary AWIA (18 cm−1), with a retardation factor of ~1.5, greatly under-predicts the retardation exhibited by the measured breakthrough curve. The magnitude of retardation (R~2) determined using the XMT total AWIA (55 cm−1) is also lower than the measured data. Similar results are obtained for the higher water-saturation experiments (Figure 4).
Brusseau and colleagues have successfully predicted the transport of PFOA, PFOS, and GenX in unsaturated sand by using ITT-measured AWIA values, but did not evaluate the impact of using different measured AWIA values (Brusseau et al., 2019, 2021; Brusseau, 2020; Yan et al., 2020). Employing the XMT-measured values produces under-predictions of retardation for all of their several data sets. This is illustrated in Figure 5 for PFOA transport with a saturation of 0.66. These results in combination with those in the preceding paragraph demonstrate that the AWIAs measured with the aqueous ITT methods provide a more robust and relevant representation of PFOA retention during transport in the unsaturated medium compared to the XMT methods.
Figure 5.
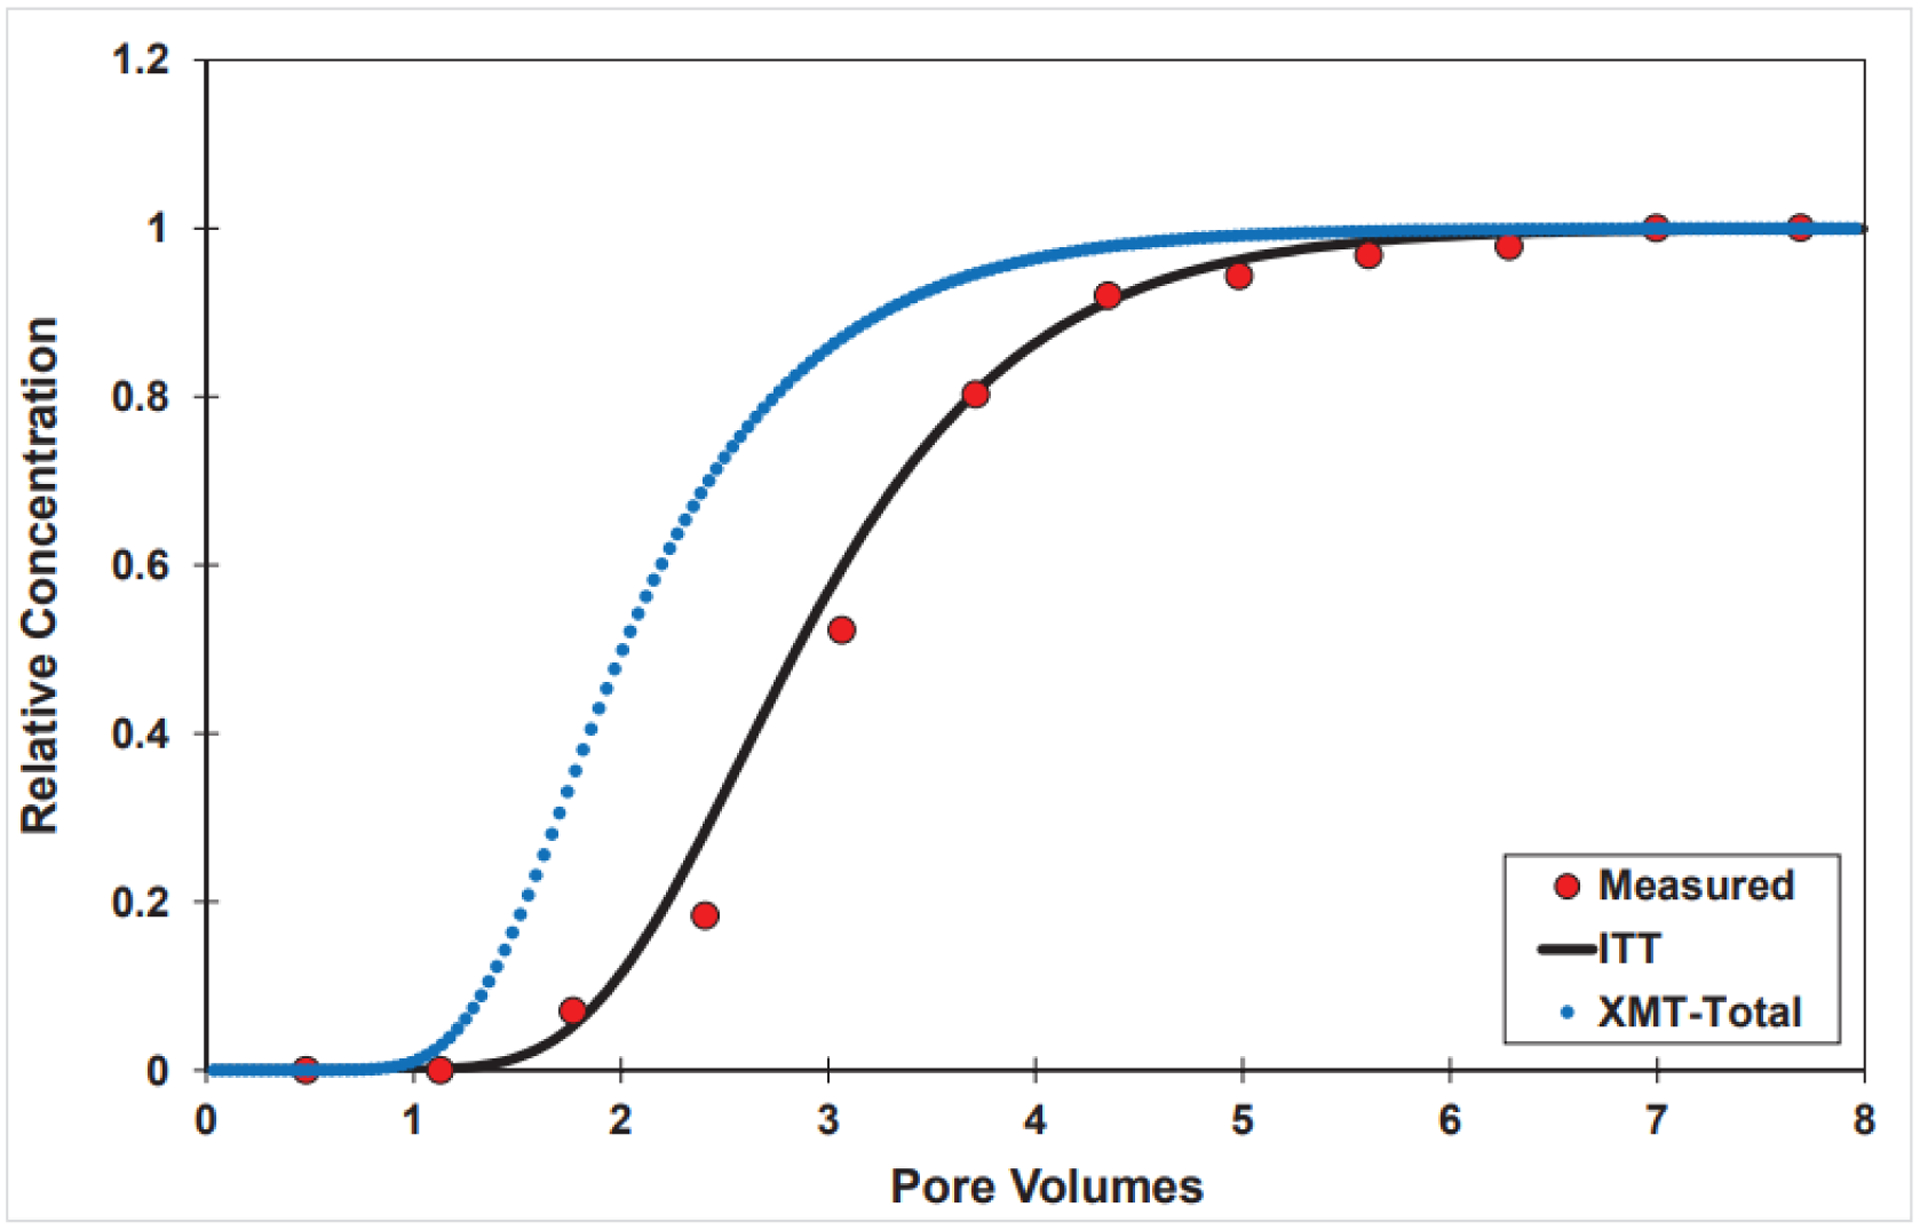
Measured and simulated transport of PFOA in unsaturated sand (Sw = 0.66; input concentration = 100 μg/L). Measured data from Brusseau et al., 2021. Simulations produced with the model of Brusseau (2020). AWIA was measured using the methods discussed in the main text.
The representativeness of the thermodynamic-estimation method was also tested, with an estimated AWIA of 42 cm−1 for the lower water-saturation experiment. The simulated breakthrough curve under-predicts the measured data (Figure 3). Prior work has indicated that AWIAs estimated with this approach can be significantly lower than AWIAs measured with ITT methods (Jiang et al., 2020). Based on these results, the thermodynamic-estimation method appears to be limited in its ability to produce AWIA values relevant for PFAS transport, particularly for lower water saturations. A multitude of theoretical models based on different approaches have also been developed to predict AWIA (Jiang et al., 2020 and citations therein). However, a great majority of them focus solely on capillary AWIA, and therefore are unlikely to be applicable for PFAS transport given the preceding results.
3.4. Long-term Leaching of PFOA
The long-term impact of employing different AWIA values on PFOA leaching in the vadose zone was simulated for a representative AFFF fire-training application scenario using the comprehensive model of Guo et al. (2020). The predicted timeframes for PFOA migration to groundwater vary from 3 to 6 to 20 years depending on which AWIA is used in the simulations (Figure 6). As expected, the overall PFOA retention is the greatest for the case of the ITT-determined AWIA and the weakest for the case of the capillary-XMT AWIA.
Figure 6.
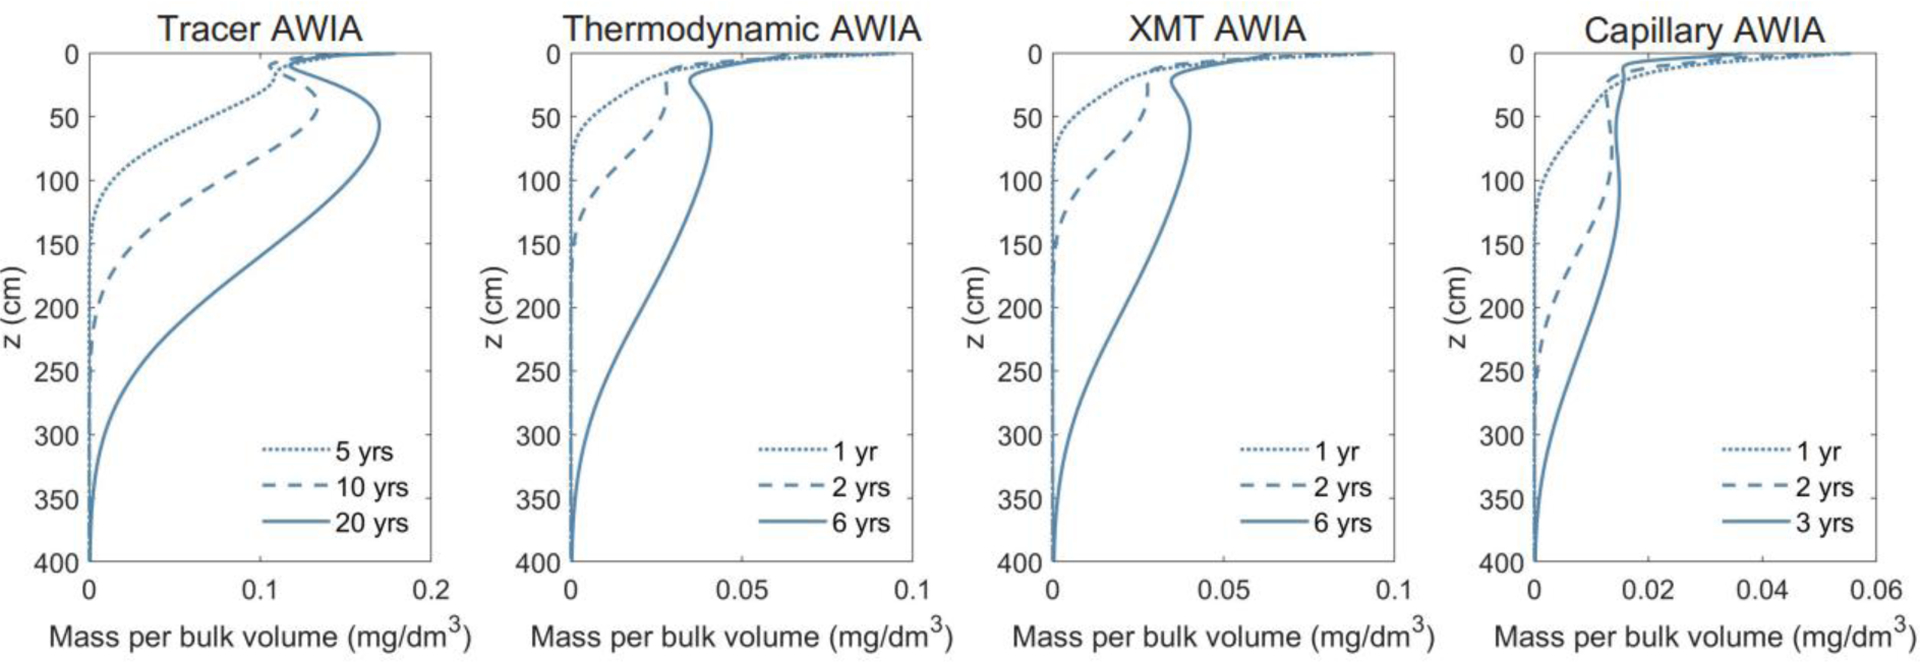
Simulated long-term retention and leaching of PFOA at a model fire training area site employing different air-water interfacial areas (AWIA). “Tracer” represents the AWIA measured with the aqueous ITT methods; “XMT” represents the total AWIA measured with the XMT method; “Capillary” represents the capillary AWIA measured with the XMT method. The vertical axis is the depth from the land surface and the horizontal axis represents the mass of PFOA per bulk volume of soil media, i.e., it includes the mass in pore-water and at the solid-water and air-water interfaces. The simulations were produced with the model of Guo et al. (2020).
The relatively large differences in timeframes determined for PFAS to reach groundwater would result in significantly different risk-assessment outcomes. Field data sets for which initial and boundary conditions are sufficiently well-defined for constraining and testing PFAS transport models under field conditions have yet to become available. However, regarding the relevance of the air-water interfacial areas measured by the different methods, the simulations presented here and those in our prior work (Guo et al., 2020) are qualitatively consistent with measured vadose-zone PFAS concentration profiles at many contamination sites. Namely, the majority of (long-chain) PFAS remain in the shallow vadose zone even decades after the fire training activities have ceased (Brusseau et al., 2020a).
The simulations discussed above were conducted employing a domain comprised of a homogeneous porous medium. It is anticipated that porous-medium heterogeneities may under certain conditions impact the transport of PFAS in the vadose zones of some sites, as discussed in prior studies (Brusseau, 2018; Guo et al., 2020; Brusseau et al., 2021; Zeng and Guo, 2021). For example, the impact of physical heterogeneity on transport was recently investigated with a series of numerical simulations of long-term PFAS leaching in 2D and 3D heterogeneous vadose zones (Zeng and Guo, 2021). The simulations illustrate that when significant heterogeneity and associated preferential-flow pathways are present, the effective air-water interfacial area contributing to PFAS retention may be smaller than the actual inherent air-water interfacial area. Other phenomena may also impact the effective air-water interfacial area available for PFAS retention. The transport of PFOA and PFOS in miscible-displacement experiments was shown to be nonideal for conditions wherein the input concentration was similar to or greater than the critical reference concentration (Brusseau et al., 2021). This was hypothesized to result from a degree of constrained access to some portion of the air-water interfacial area. Notably, this behavior was observed for transport in columns packed homogenously with a sand. The nonideal transport behavior reported in these two studies may be one potential reason for the observations of relatively deep leaching of PFAS in vadose zones at some sites (e.g., Dauchy et al., 2019; Brusseau et al., 2020a). It is anticipated that the most accurate predictions of PFAS leaching in the vadose zone will be obtained by using the most representative measures of AWIA. This is especially true for cases with nonideal transport present, wherein the use of inaccurate interfacial areas is likely to obfuscate the determination of actual retention mechanisms and the impact of system conditions and potential nonideality factors on transport.
Conclusions
Measured miscible-displacement data for PFOA transport in unsaturated sand was successfully predicted using AWIA values measured by aqueous ITT methods. Conversely, AWIAs measured with the XMT method and estimated with the thermodynamic method under-predicted the magnitude of retardation and could not successfully simulate the measured transport data. These results indicate that the aqueous ITT methods appear to provide the most appropriate AWIA values for robust characterization and modeling of PFAS transport in unsaturated media.
The long-term impact of employing different AWIA values on PFOA leaching in the vadose zone was investigated by conducting simulations for a representative AFFF fire-training application scenario. The results highlight the importance of employing AWIA values that are most representative of PFAS air-water interfacial adsorption for accurate predictions of PFAS leaching in the vadose zone.
The analyses presented herein focused on PFOA transport. However, the results are anticipated to be representative for a great majority of PFAS, given the consistency and similarity of surface-activity behavior exhibited by PFAS of greatly varying molecular structures, as evidenced by the ability to accurately predict fluid-fluid interfacial adsorption coefficients using simple single-parameter quantitative-structure/property relationship models (Brusseau, 2019; Brusseau, and Van Glubt, 2021). Finally, it is important to note that nonideal transport may occur under certain conditions wherein full access to the air-water interface is constrained in some manner, thereby resulting in an effective interfacial area that may vary with conditions and impact retention and transport.
Highlights.
Air-water interfacial areas (AWIA) relevant for PFAS transport are investigated Laboratory-measured PFOA transport data are predicted using different AWIA inputs Transport was accurately predicted using AWIAs measured with interfacial tracer methods Transport could not be predicted for this system using AWIAs obtained with XMT Transport could not be predicted for this system using thermodynamic-estimated AWIAs
Acknowledgements
This research was supported by the Superfund Research Program of the NIEHS (P42 ES 4940), the Hydrologic Sciences Program of the NSF (2023351), and the Environmental Security Technology Certification Program (Project ER21-5041). We thank the reviewers for their constructive comments.
Footnotes
Publisher's Disclaimer: This is a PDF file of an unedited manuscript that has been accepted for publication. As a service to our customers we are providing this early version of the manuscript. The manuscript will undergo copyediting, typesetting, and review of the resulting proof before it is published in its final form. Please note that during the production process errors may be discovered which could affect the content, and all legal disclaimers that apply to the journal pertain.
Declaration of Competing Interests
The authors declare that they have no known competing financial interests or personal relationships that could have appeared to influence the work reported in this paper.
References
- Anderson RH, Adamson DT, Stroo HF, 2019. Partitioning of poly-and perfluoroalkyl substances from soil to groundwater within aqueous film-forming foam source zones. J. Contam. Hydrol 220, 59–65. [DOI] [PubMed] [Google Scholar]
- Anwar AHMF, 2001. Experimental determination of air-water interfacial area in unsaturated sand medium. New Approaches Characterizing Groundwater Flow. In: Proceedings. of XXXI IAH Congress, Munich, Germany, September 10–14, Vol. 2, pp. 821–825. [Google Scholar]
- Anwar AHMF and Matsubayashi U, 2000. Method of estimating air-liquid interfacial area using soil characteristics curve. Journal of Groundwater Hydrology, 42(2), 159–174. 10.5917/jagh1987.42.159 [DOI] [Google Scholar]
- Anwar AHMF, Bettahar M and Matsubayashi U, 2000. A method for determining air-water interfacial area in variably saturated porous media. J. of Contam. Hydrol, 43(2), 129–146. [Google Scholar]
- Araujo JB and Brusseau ML, 2020. Assessing XMT-measurement variability of air-water interfacial areas in natural porous media. Water Resour. Res 56., article e2019WR025470. [DOI] [PMC free article] [PubMed] [Google Scholar]
- Araujo JB, Mainhagu J, and Brusseau ML, 2015. Measuring air–water interfacial area for soils using the mass balance surfactant-tracer method. Chemo. 134, 199–202. [DOI] [PMC free article] [PubMed] [Google Scholar]
- Bradford SA and Leij FJ, 1997. Estimating interfacial areas for multi-fluid soil systems. J. Contam. Hydrol 27, 83–105. [Google Scholar]
- Brusseau ML, 2019. The influence of molecular structure on the adsorption of PFAS to fluid-fluid interfaces: Using QSPR to predict interfacial adsorption coefficients. Water Res 152, 148–158. [DOI] [PMC free article] [PubMed] [Google Scholar]
- Brusseau ML, 2020. Simulating PFAS transport influenced by rate-limited multi-process retention. Water Res. 168, article 115179. [DOI] [PMC free article] [PubMed] [Google Scholar]
- Brusseau ML, 2021. Examining the robustness and concentration dependency of PFAS air-water and NAPL-water interfacial adsorption coefficients. Water Res. 190, article 116778. [DOI] [PMC free article] [PubMed] [Google Scholar]
- Brusseau ML and Van Glubt S, 2021. The influence of molecular structure on PFAS adsorption at air-water interfaces in electrolyte solutions. Chemo. 281, article 130829. [DOI] [PMC free article] [PubMed] [Google Scholar]
- Brusseau ML, Popovicova J, Silva JAK, 1997. Characterizing gas-water interfacial and bulk-water partitioning for gas-phase transport of organic contaminants in unsaturated porous media. Environ. Sci. Technol 31, 1645–1649. [Google Scholar]
- Brusseau ML, Peng S, Schaar G, & Costanza-Robinson MS (2006). Relationships among air-water interfacial area, capillary pressure, and water saturation for a sandy porous medium. Water Resources Research, 42, W03501. [Google Scholar]
- Brusseau ML, Peng S, Schnaar G, and Murao A, 2007. Measuring air–water interfacial areas with X-ray microtomography and interfacial partitioning tracer tests. Environ. Sci. & Technol, 41, 1956–1961. [DOI] [PubMed] [Google Scholar]
- Brusseau ML, Janousek H, Murao A, Schnaar G, 2008. Synchrotron X-ray microtomography and interfacial partitioning tracer test measurements of NAPL-water interfacial areas. Water Resour. Res 44, article W01411. [DOI] [PMC free article] [PubMed] [Google Scholar]
- Brusseau ML, El Ouni A, Araujo JB and Zhong H, 2015. Novel methods for measuring air-water interfacial area in unsaturated porous media. Chemo. 127, 208–213. [DOI] [PMC free article] [PubMed] [Google Scholar]
- Brusseau ML, Yan N, Van Glubt S, Wang Y, Chen W, Lyu Y, Dungan B, Carroll KC and Holguin FO, 2019. Comprehensive retention model for PFAS transport in subsurface systems. Water Res. 148, 41–50. [DOI] [PMC free article] [PubMed] [Google Scholar]
- Brusseau ML, Anderson RH and Guo B, 2020a. PFAS concentrations in soils: Background levels versus contaminated sites. Sci. Total. Environ 740, article140017. [DOI] [PMC free article] [PubMed] [Google Scholar]
- Brusseau ML, Lyu Y, Yan N and Guo B, 2020b. Low-concentration tracer tests to measure air-water interfacial area in porous media. Chemo. 250, 126305. [DOI] [PMC free article] [PubMed] [Google Scholar]
- Brusseau ML, Guo B, Huang D, Yan N, Lyu Y, 2021. Ideal versus nonideal transport of PFAS in unsaturated porous media. Water Res, article 117405. [DOI] [PMC free article] [PubMed] [Google Scholar]
- Culligan KA, Wildenschild D, Christensen BSB, Gray WG, Rivers ML, & Tompson AFB (2004). Interfacial area measurements for unsaturated flow through a porous medium. Water Resources Research, 40, W12413. [Google Scholar]
- Dauchy X, Boiteux V, Colin A, Hemard J, Bach C, Rosin C, Munoz J-F, 2019. Deep seepage of per- and polyfluoroalkyl substances through the soil of a firefighter training site and subsequent groundwater contamination. Chemosphere 214, 729–737. [DOI] [PubMed] [Google Scholar]
- Dobson R, Schroth MH, Oostrom M, Zeyer J, 2006. Determination of NAPL-water interfacial areas in well-characterized porous media. Environ. Sci. Technol 40, 815–822. [DOI] [PubMed] [Google Scholar]
- Guo B, Zeng J and Brusseau ML, 2020. A mathematical model for the release, transport, and retention of per- and polyfluoroalkyl substances (PFAS) in the vadose zone. Water Resour Res. 56, article e2019WR026667. [DOI] [PMC free article] [PubMed] [Google Scholar]
- Høisæter Å, Pfaff A, and Breedveld GD, 2019. Leaching and transport of PFAS from aqueous film-forming foam (AFFF) in the unsaturated soil at a firefighting training facility under cold climatic conditions. J Contam. Hydrol, 222, 112–122. [DOI] [PubMed] [Google Scholar]
- Jiang H, Guo B and Brusseau ML, 2020. Pore-Scale modeling of fluid-fluid interfacial area in variably saturated porous media containing microscale surface roughness. Water Resour. Res 56, article e2019WR025876. [DOI] [PMC free article] [PubMed] [Google Scholar]
- Kim H, Rao PSC, Annable MD, 1997. Determination of effective air-water interfacial area in partially saturated porous media using surfactant adsorption. Water Resour. Res 33 (12), 2705–2711. [Google Scholar]
- Leverett M, 1941. Capillary behavior in porous solids. Transactions of AIME, 142, 152–169. [Google Scholar]
- Li Z, Lyu X, Gao B, Xu H, Wu J, Sun Y, 2021. Effects of ionic strength and cation type on the transport of perfluorooctanoic acid (PFOA) in unsaturated sand porous media. J. Hazard. Mater 403, article 123688. [DOI] [PubMed] [Google Scholar]
- Lyu Y, Brusseau ML, 2020. The influence of solution chemistry on air-water interfacial adsorption and transport of PFOA in unsaturated porous media. Sci. Total. Environ 713, 136744. [DOI] [PMC free article] [PubMed] [Google Scholar]
- Lyu Y, Brusseau ML, Chen W, Yan N, Fu X and Lin X, 2018. Adsorption of PFOA at the air-water interface during transport in unsaturated porous media. Environ. Sci. Technol 52, 7745–7753. [DOI] [PMC free article] [PubMed] [Google Scholar]
- Lyu X, Liu X, Sun Y, Gao B, Ji R, Wu J, and Xue Y, 2020. Importance of surface roughness on perfluorooctanoic acid (PFOA) transport in unsaturated porous media. Envrion. Poll 266, article 115343. [DOI] [PubMed] [Google Scholar]
- Schaefer CE, DiCarlo DA, Blunt MJ, 2000. Experimental measurement of airewater interfacial area during gravity drainage and secondary imbibition in porous media. Water Resour. Res 36, 885e890. [Google Scholar]
- Silva JA, Simunek J, and McCray JE, 2020. A modified HYDRUS model for simulating PFAS transport in the vadose zone. Water, 12, article 2758. [Google Scholar]
- Washington JW, Rankin K, Libelo E, Lynch D, Cyterski M, 2019. Determining global background soil PFAS loads and the fluorotelomer-based polymer degradation rates that can account for these loads. Sci. Total Environ 651, 2444–2449. [DOI] [PMC free article] [PubMed] [Google Scholar]
- Weber AK, Barber LB, LeBlanc DR, Sunderland EM and Vecitis CD, 2017. Geochemical and hydrologic factors controlling subsurface transport of poly- and perfluoroalkyl substances, Cape Cod, Massachusetts. Environ. Sci. Technol 51, 4269–4279. [DOI] [PubMed] [Google Scholar]
- Xiao F, Simcik MF, Halbach TR and Gulliver JS, 2015. Perfluorooctane sulfonate (PFOS) and perfluorooctanoate (PFOA) in soils and groundwater of a U.S. metropolitan area: Migration and implications for human exposure. Water Res. 72, 64–74. [DOI] [PubMed] [Google Scholar]
- Yan N, Ji Y, Zhang B, Zheng X and Brusseau ML, 2020. Transport of GenX in Saturated and Unsaturated Porous Media. Environ. Sci. Technol 54, 11876–11885. [DOI] [PMC free article] [PubMed] [Google Scholar]
- Zeng J and Guo B, 2021. Multidimensional simulation of PFAS transport and leaching in the vadose zone: Impact of surfactant-induced flow and subsurface heterogeneities. Advances in Water Resources, 155, p.104015. [Google Scholar]


