

Abstract
AIMS:
Elevated cardiac filling pressures producing clinical congestion in heart failure (HF) patients may be secondary to intravascular volume expansion or abnormalities in cardiac diastolic properties.
Objective was to assess the extent to which measures of myocardial function and intravascular volume correlate with hemodynamic abnormalities in chronic HF.
METHODS:
Subjects underwent invasive hemodynamic assessment, measurement of total blood volume (TBV) using radiolabel indicator-dilution methodology, and echocardiography to evaluate cardiac structure and function. Patients were divided into those with hypervolemia (defined as TBV>+8% above referenced normal volume) and normal volume (“euvolemia”) (TBV≤+8%).
RESULTS:
Of 66 patients, 39 (59%) were hypervolemic and 27 (41%) normal TBV. Central venous pressure (CVP, p=0.01) and pulmonary capillary wedge pressures (PCWP, p<0.001) were higher in hypervolemic compared with euvolemic patients, however, 15% of hypervolemic patients displayed normal pressures. Of euvolemic patients, 70% displayed elevated CVP and 63% elevated PCWP. PCWP was moderately correlated with TBV (r=0.42), LV diastolic function (e’ velocity, r=−0.44), and LA strain (r=−0.47). In multivariable regression TBV, LV e’, and LA strain were independently associated with PCWP (all p<0.05).
CONCLUSIONS:
While hypervolemic patients displayed elevations in filling pressures, a substantial proportion (15%) had normal pressures, and of all subjects with elevated filling pressures ~1/3 had normal TBVs. Importantly, of patients with normal volumes, a majority (>60%) display elevated filling pressures. Combined analysis of volume, pressure, and cardiac function may be helpful to guide comprehensive assessments of HF status.
Keywords: Heart failure, Cardiac filling pressures, Intravascular volume, Cardiac function
INTRODUCTION
Volume overload occurring due to fluid accumulation and/or fluid redistribution remains a front-line issue in the development of the syndrome of congestion in acute and chronic heart failure (HF). The clinical assessment of volume status remains a significant challenge for clinicians, particularly identifying the guideline recommended status of “euvolemia” following diuretic therapy. The measurement of cardiac filling pressures by right heart catheterization, therefore, has played a prominent, sometimes controversial role in evaluating and guiding fluid management in patients with HF for decades.1–4
One of the challenges complicating volume assessment rests in the fact that “euvolemia” is more of a concept than a measurable quantity. It is the elevation in hydrostatic pressure that alters Starling Forces across capillary beds to cause tissue congestion, but pressure may be elevated even when intravascular volume is not expanded. Filling pressure and intravascular volume are intimately and mechanistically related, but can become uncoupled, and this may have important implications for the use of therapies to reduce pressures, such as diuretics and vasodilators.
To our knowledge, no study has directly evaluated hemodynamics, intravascular volume status, and measures of cardiac function simultaneously to explore the relative contributions of each component to congestion in HF. Accordingly, we sought to assess the relationships between measures of myocardial function and extent of intravascular volume expansion (hypervolemia) with directly-measured invasive hemodynamics in patients with chronic HF.
METHODS
Blood volume measurement, right cardiac catheterization, and Doppler echocardiography with speckle tracking strain imaging were performed in clinically stable ambulatory outpatients (majority NYHA Class III) with a diagnosis of chronic HF (regardless of EF) as part of this prospective study. The majority of patients in this cohort (~68%) had experienced a remote hospitalization for HF, most commonly associated with initial decompensation and a new diagnosis of HF with subsequent outpatient stabilization on medical therapy. Exclusion criteria were 1) age <18 years; 2) chronic kidney disease requiring hemodialysis or ultrafiltration; 3) symptomatic coronary artery disease; 4) patients requiring advanced pharmacologic or device therapy for hemodynamic support; 5) females who were pregnant or of child-bearing potential; 6) congenital heart disease; 7) treatment resistant allergy to iodine. Renal function was expressed as the estimate of glomerular filtration rate (eGFR), mL/min/1.73m2, using the Modification of Diet in Renal Disease equation.5 Loop diuretic in 40–60mg furosemide or equivalent daily doses was the most commonly prescribed regimen. All participants provided written informed consent and the study protocol was approved by the Mayo Foundation Institutional Research Review Board and Ethics Committee.
Invasive Hemodynamic Assessment
Right heart catheterization was performed through a 9 Fr sheath via the right internal jugular vein in the fasted state as previously described.6,7 Pressures in the right atrium (central venous pressure, CVP), pulmonary artery (PA), and pulmonary capillary wedge pressure (PCWP) were measured at end-expiration, taking the mean of ≥3 beats. Mean CVP and PCWP were taken at mid a wave or mid c wave for patients in atrial fibrillation. Analog pressure tracings were digitized (240 Hz) and stored for offline analysis by a single observer. Oxygen consumption (VO2) was directly measured from expired gas analysis (MedGraphics, St. Paul, MN). Arterial and mixed venous blood was directly sampled to measure oxygen content (saturation x hemoglobin x 1.34). Cardiac output (CO) was determined by the direct Fick method. Pulmonary and systemic vascular resistances were calculated from the pressure drop across respective circulation/CO. Pulmonary artery resistance, compliance, and elastance were calculated as previously described.8 Defining equations are provided (Supplemental Figure 1).
Intravascular Volume Measurement
Total arterial-venous blood volume quantitation using the indicator-dilution principle was undertaken in the Mayo Clinical Nuclear Medicine Laboratory using a standardized computer-based technique to administer low dose iodinated (I-131) labeled albumin intravenously (BVA-100 Blood Volume Analyzer/Volumex, Daxor Corp, NY, NY). The radiolabeled albumin was injected and after 12 minutes circulation time, samples were drawn from the contralateral arm at 6 minute intervals for 6 samples post-injection. Radioactivity of each sample was measured in duplicate and by back extrapolation to time zero absolute volume was measured. Reference normal volumes are defined by a method of deviation from ideal weight which takes into account differences in body composition.9–11 Reference normal weights were determined from previously established gender-adjusted reference curves of healthy subjects adapted from life insurance tables as previously described.10,11
Briefly, each patient’s normal reference weight at his/her specific height is derived from the reference curves and percent deviation from normal expected weight is calculated as ±% expected weight = actual weight-expected normal weight/expected normal weight X 100. These data are electronically incorporated by algorithm into the BVA-100 analysis. The expected excesses of TBV and PV related to excess body mass are accounted for by this method, so further deviations from normal non-HF ranges related to body weight reflect greater volume overload beyond that explainable by excess body mass alone. The specifics of the technique and procedure have been previously reported.9–13
Intravascular volumes are reported as absolute volumes (in liters) and as percent deviations from normal non-HF volume as percent volume deficit (−) or excess (+). Normal ranges for TBV, PV, and RBC mass were defined a priori as measured volume within ±8% (for TBV) and ±10% (for PV and RBC mass) of normal non-HF volumes. Normal TBV was, therefore, defined as values ≤+8% of expected volume and hypervolemia by > +8% above normal volume.10–12
Assessment of Cardiac Structure and Function
Two-dimensional echocardiography with Tissue Doppler was performed according to the current guidelines by board certified cardiologists blinded to hemodynamic and volume data.14,15 Myocardial deformation analyses were performed offline, using commercially available software (Syngo, Siemens Medical Solutions Munich, Germany) as previously described.16 LV longitudinal strain was measured from two apical views. LA reservoir strain was calculated as the average of strain in 6 segments in the 4 chamber and 2 chamber views. Strain values represent the mean of three beats and are expressed as absolute values. Where atrial fibrillation was present LA strain was assessed using the QRS as the reference point given the absence of p waves.17 LA volumes were calculated by the area length method in apical 4 chamber and 2 chamber views. LV e’ tissue velocities were taken at the medial mitral annulus. Diastology measures with atrial fibrillation were based upon the mean of 5 consecutive beats.
Right ventricular (RV) basal, mid-cavity, and longitudinal dimensions were measured at end-diastole using RV-focused views as previously described and according to current guidelines.18 RV systolic function was reported by tricuspid valve tissue Doppler s’ velocity, Tricuspid annular plane systolic excursion and RV Fractional Area Change, and RV free wall strain.19
Statistical Analyses
Categorical variables are reported as number and percentage, while continuous variables are expressed as mean ± standard deviation (SD) if normally distributed or as median (interquartile range [IQR]) if not normally distributed. Categorical variables were compared by Chi-squared or Fisher’s Exact test. Between-group comparisons were made using an unpaired t test (parametric) or Mann-Whitney test (nonparametric). Simple and multivariable linear regression analyses were used to evaluate associations between hemodynamics and measures of TBV and cardiac function. All statistical analyses were performed using JMP and SAS version 9.3 and two-sided with p-values <0.05 considered to be statistically significant.
RESULTS
Baseline Characteristics
Of 66 participants with chronic HF (52 HFrEF, 14 HFpEF), 39 (59%) were hypervolemic (TBV>+8% above normal volume) and 27 (41%) demonstrated normal intravascular blood volumes (TBV≤+8%). The frequency distribution of TBV across the cohort as a whole is shown in Supplemental Figure 2. Seventy-five patients were screened and met criteria for the study, however, 8 patients declined participation and one enrolled but missed the volume measurement in the required timeframe relative to the hemodynamic catheterization.
As compared to normal volume subjects, hypervolemic subjects displayed more atrial fibrillation, more jugular venous distension (JVD) on physical examination, greater diuretic and digoxin use, and higher BUN and NT-proBNP levels (Table 1). Body mass index, NYHA functional class, and the proportion of HF patients with HFpEF were similar in the normal volume and hypervolemic subgroups. As expected based upon the way in which the groups were defined, TBV was greater in hypervolemic as compared to normal volume patients (Table 2). This was related to plasma volume expansion and to lesser extent increased red blood cell mass.
Table 1:
Clinical and Demographic Characteristics
| Normal Volume (n=27) |
Hypervolemic (n=39) |
p-value | |
|---|---|---|---|
| Age, years | 58±13 | 62±10 | 0.18 |
| Women, n (%) | 9 (33) | 9 (23) | 0.36 |
| Body Mass Index, kg/m2 | 30.3±7.4 | 31.1±5.8 | 0.63 |
| HFpEF, n (%) | 5 (19) | 9 (23) | 0.65 |
| NYHA Class III/IV | 25/2 | 33/6 | 0.32 |
| JVD, % | 33% | 61% | 0.03 |
| Peripheral Edema, % | 26% | 33% | 0.54 |
| Comorbidities | |||
| Diabetes, % | 22% | 41% | 0.11 |
| Hypertension, % | 44% | 54% | 0.43 |
| Coronary artery disease, % | 48% | 41% | 0.58 |
| Atrial fibrillation, % | 22% | 56% | 0.01 |
| Sleep Apnea, % | 41% | 61% | 0.11 |
| Medications | |||
| Beta Blocker, % | 93% | 90% | 0.67 |
| CEI/ARB, % | 78% | 72% | 0.58 |
| MRA, % | 44% | 38% | 0.63 |
| Diuretic, % | 85% | 100% | 0.01 |
| Statin, % | 70% | 69% | 0.93 |
| Digoxin, % | 11% | 28% | 0.02 |
| Laboratories | |||
| Potassium, mEq/L | 4.5±0.4 | 4.3±0.5 | 0.09 |
| Serum creatinine, mg/dL | 1.4±0.3 | 1.5±0.8 | 0.54 |
| eGFR, mL/min/1.73m2 | 56±19 | 56±24 | 1.00 |
| BUN, mg/dL | 24±9 | 33±21 | 0.04 |
| Plasma Osmolality, mOsm/L† | 295±7 | 298±11 | 0.22 |
| Albumin, g/dL | 4.3±0.5 | 4.0±0.9 | 0.12 |
| Glucose, mg/dL | 115±33 | 112±22 | 0.66 |
| Hemoglobin, g/dL | 13.4±1.4 | 12.7±2.0 | 0.12 |
| Hematocrit, % | 38±4.4 | 38±5.7 | 1.00 |
| NT-proBNP, pg/mL | 958 (461, 1841) | 2859 (1033, 7030) | <0.001 |
PmOsm/L= 2*[Na] + [Glucose]/18 + [BUN]/2.5
Table 2:
Intravascular Volume Profiles
| Normal Volume (n=27) |
Hypervolemic (n=39) |
P-value | |
|---|---|---|---|
| Total Blood Volume (TBV), Liters | 5.1±1.1 | 7.5±1.5 | <0.001 |
| TBV, Excess/Deficit, % | −1 (−8, 4) | 30 (22, 45) | <0.001 |
| Plasma Volume (PV), Liters | 3.3±0.7 | 4.9±1.0 | <0.001 |
| PV Excess/Deficit, % | 7 (−1, 9) | 41 (33, 68) | <0.001 |
| Red Blood Cell Mass, Liters | 1.8±0.4 | 2.6±0.8 | <0.001 |
| RBCM Excess/Deficit, % | −15 (−25, −3) | 12 (−5, 34) | <0.001 |
Cardiac Structure and Function
As compared to normal intravascular volume subjects, those with hypervolemia displayed modestly greater LV dimensions and mass (Table 3). There were no statistically significant differences in LV systolic or diastolic function between the groups. In contrast, subjects with hypervolemia displayed more LA remodeling and dysfunction, with significantly greater LA volume and 50% lower LA strain (Table 3, Figure 1). Hypervolemic patients displayed greater RV size, but there were no between group differences in RV function. Doppler-estimated RV systolic pressure tended to be higher in hypervolemic HF patients (Table 3). NT-proBNP was not significantly associated with TBV in normal volume (r=0.265, p=0.196) or hypervolemic subjects (r=0.173, p=0.359),
Table 3:
Cardiac Structure and Function
| Normal Volume (n=27) |
Hypervolemic (n=39) |
p-value | |
|---|---|---|---|
| LV diastolic dimension, mm | 58±9 | 65±12 | 0.03 |
| LV end diastolic volume, ml | 173±57 | 222±87 | 0.02 |
| LV mass index, g/m2 | 117±39 | 145±42 | 0.01 |
| LV systolic function | |||
| LV ejection fraction, % | 30 (22, 40) | 26 (19, 45) | 0.51 |
| LV s’ velocity, cm/s | 4.4±1.9 | 4.0±1.6 | 0.44 |
| LV Global longitudinal strain, % | 7.1±2.6 | 7.3±4.3 | 0.80 |
| LV diastolic function | |||
| LV e’ velocity, cm/s | 4.8±1.9 | 4.5±1.5 | 0.48 |
| E/A ratio | 1.7±0.9 | 2.2±1.0 | 0.07 |
| E/e’ ratio | 18 (13, 20) | 20 (16, 30) | 0.07 |
| LA structure & function | |||
| LA volume index, ml/m2 | 40±13 | 57±20 | 0.0006 |
| LA reservoir strain, % | 14.8 (9.6, 19.5) | 7.4 (5.3, 11.3) | 0.0008 |
| RV structure & function | |||
| RV end diastolic area, cm2 | 22.5±4.7 | 30.5±7.2 | <0.0001 |
| RV end systolic area, cm2 | 14.7±3.8 | 21.4±7.4 | 0.0002 |
| RV FAC, % | 35.2±7.6 | 31.2±11.7 | 0.16 |
| RV free wall strain, % | 15.7±6.3 | 13.4±6.4 | 0.17 |
| RV s’, cm/s | 9.4±2.4 | 9.0±2.8 | 0.65 |
| TAPSE, mm | 13.0±4.1 | 13.2±5.0 | 0.93 |
| Estimated RVSP, mmHg | 38±13 | 44±12 | 0.05 |
Figure 1.
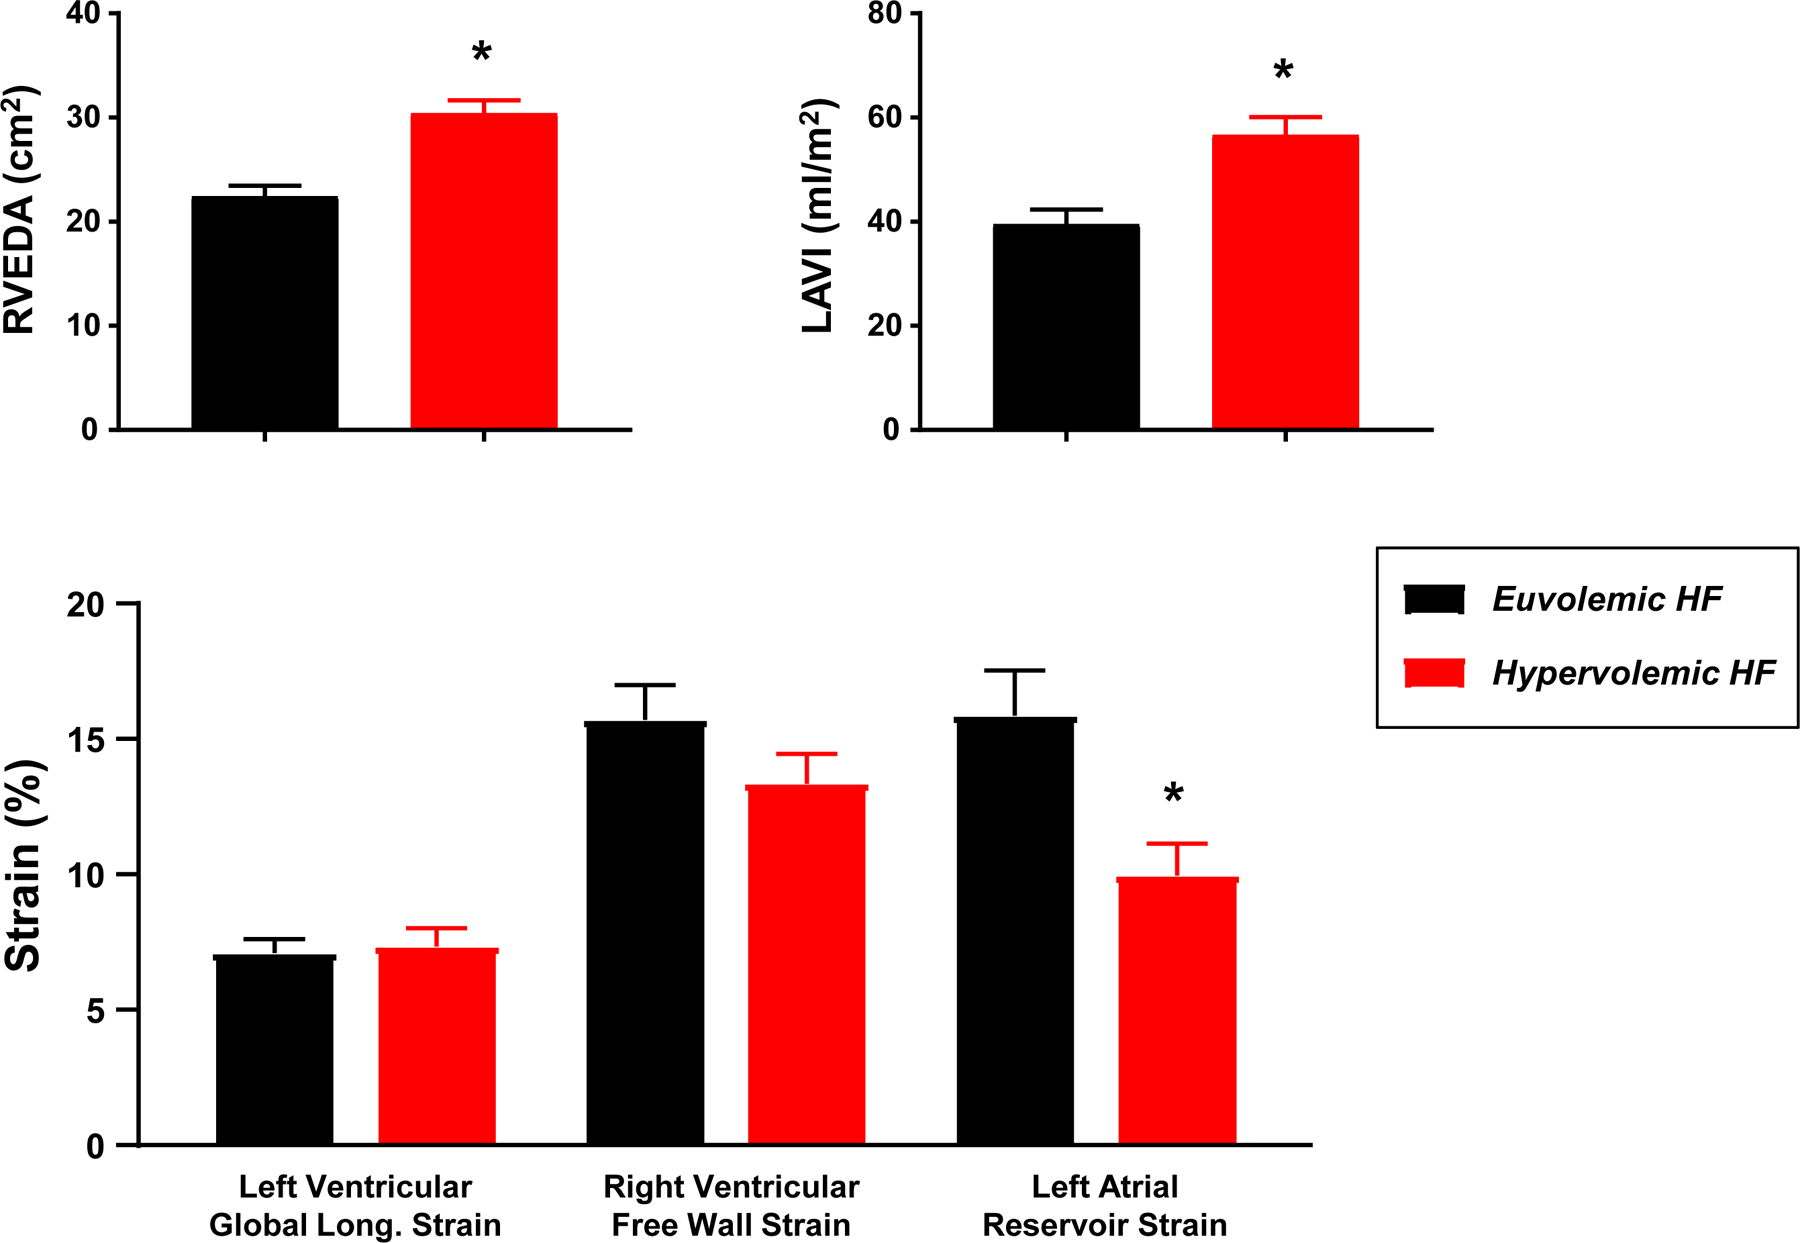
Compared to normal volume HF patients (euvolemic, black), patients with increased intravascular volume (hypervolemic, red) displayed more right ventricular dilatation (end diastolic area, RVEDA), greater left atrial enlargement (left atrial volume index, LAVI), and lower left atrial strain. *p<0.001 compared to normal volume.
Invasive Hemodynamics and Intravascular Volume
There were no differences in heart rate or blood pressure between normal volume and hypervolemic subjects (Table 4). In contrast, right and left heart filling pressures and pulmonary artery pressures were most commonly elevated in hypervolemic patients (~85%), however, a substantial proportion of hypervolemic subjects demonstrated normal right and left heart filling pressures (13% and 15%, respectively; Table 4, Figure 2). Importantly, despite normal intravascular volume, 70% of the euvolemic cohort displayed elevated CVP and 63% elevated PCWP (Table 4 and Figure 2). Conversely, 13% and 15% of hypervolemic patients displayed normal right and left heart filling pressures, respectively. From another perspective among total cohort subjects with an elevation in filling pressures (n=53), 35% did not have an expanded TBV.
Table 4:
Invasive Hemodynamics
| Normal Volume (n=27) |
Hypervolemic (n=39) |
P value | |
|---|---|---|---|
| Vital Signs | |||
| Heart rate, bpm | 71±10 | 69±12 | 0.62 |
| Systolic blood pressure, mmHg | 110±16 | 111±28 | 0.87 |
| Diastolic blood pressure, mmHg | 65±11 | 63±12 | 0.45 |
| Mean blood pressure, mmHg | 80±11 | 79±15 | 0.75 |
| Central Pressures | |||
| CVP, mmHg | 10±5 | 14±6 | 0.01 |
| Elevated CVP†, n (%) | 19 (70) | 34 (87) | 0.04 |
| PA systolic pressure, mmHg | 38±14 | 50±15 | 0.002 |
| PA mean pressure, mmHg | 27±9 | 34±10 | 0.003 |
| Pulmonary hypertension, n (%) | 14 (52) | 32 (82) | 0.009 |
| PCWP, mmHg | 17±6 | 23±8 | 0.0009 |
| Elevated PCWP‡, n (%) | 17 (63) | 33 (85) | 0.04 |
| Flow and Arterial Properties | |||
| Cardiac output, L/min Cardiac Index |
4.4±1.3 2.2±0.6 |
5.2±1.6 2.5±0.7 |
0.04 |
| SVR, dyne*sec/cm5 SVR Index |
1280 (1030, 1630) 2728 (2240, 3112) |
1100 (820, 1270) 2184 (1656, 2616) |
0.007 |
| Total arterial compliance, ml/mmHg | 1.5 (1.0, 2.2) | 1.7 (1.2, 2.2) | 0.36 |
| PVR, l/min*mmHg | 2.1 (1.2, 3.6) | 2.0 (1.4, 3.2) | 0.93 |
| PA compliance, ml/mmHg | 3.5 (2.1, 5.8) | 3.2 (2.2, 4.3) | 0.34 |
Elevated CVP defined as > 6 mm Hg;
Elevated PCWP defined as > 15 mm Hg 33
Figure 2.
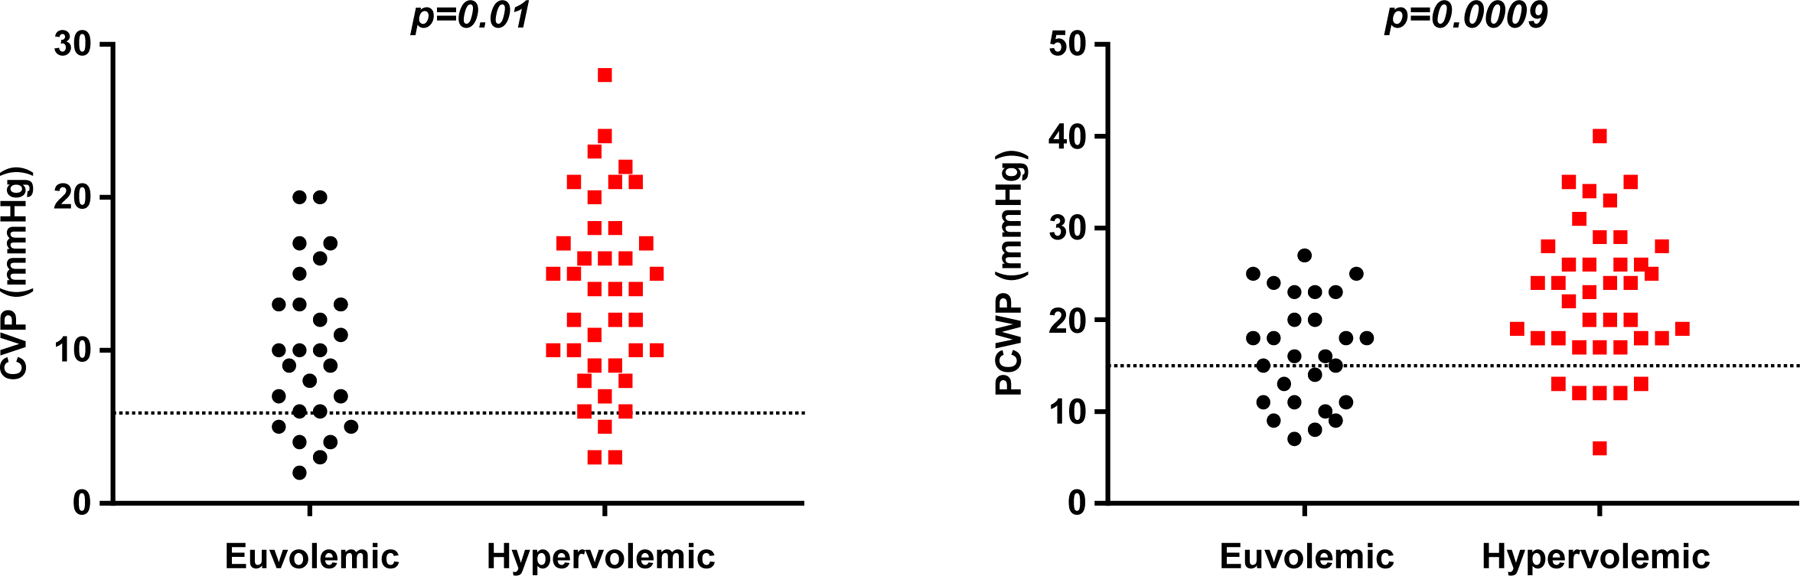
While central venous pressure (CVP, left) and pulmonary capillary wedge pressure (PCWP, right) were higher on average in hypervolemic patients (red boxes), >60% of euvolemic patients (black circles) still displayed elevated CVP (>6 mmHg) and elevated PCWP (>15 mmHg, dotted lines).
Abnormal Hemodynamics Despite Normal Intravascular Volume
We explored factors associated with the uncoupling between intravascular volumes and filling pressures in patients with normal TBV. As compared to euvolemic patients with normal filling pressures, euvolemic patients with elevated PCWP displayed lower LV GLS (6.0±2.3 vs 8.8±3.6%, p=0.01), lower LA reservoir strain (12.8±4.9 vs 20.0±10.9%, p=0.02), and lower LV diastolic e’ velocities (4.3±1.8 vs 6.3±1.5 cm/s, p=0.006, Figure 3). There were no differences in LV dimension, mass, EF, or RV function between these subgroups (all p>0.2). Additionally, atrial fibrillation (AF) may potentially confound the relationship of volume to filling pressures, however, an analysis of TBV (±SD) in AF and non AF subjects [6.9 (±1.6)L and 6.3 (±1.9)L, respectively] did not demonstrate a difference (p=0.26), and in a multivariable linear regression model, the relationship between TBV and PCWP did not differ in patients with or without AF (p=0.48).
Figure 3.
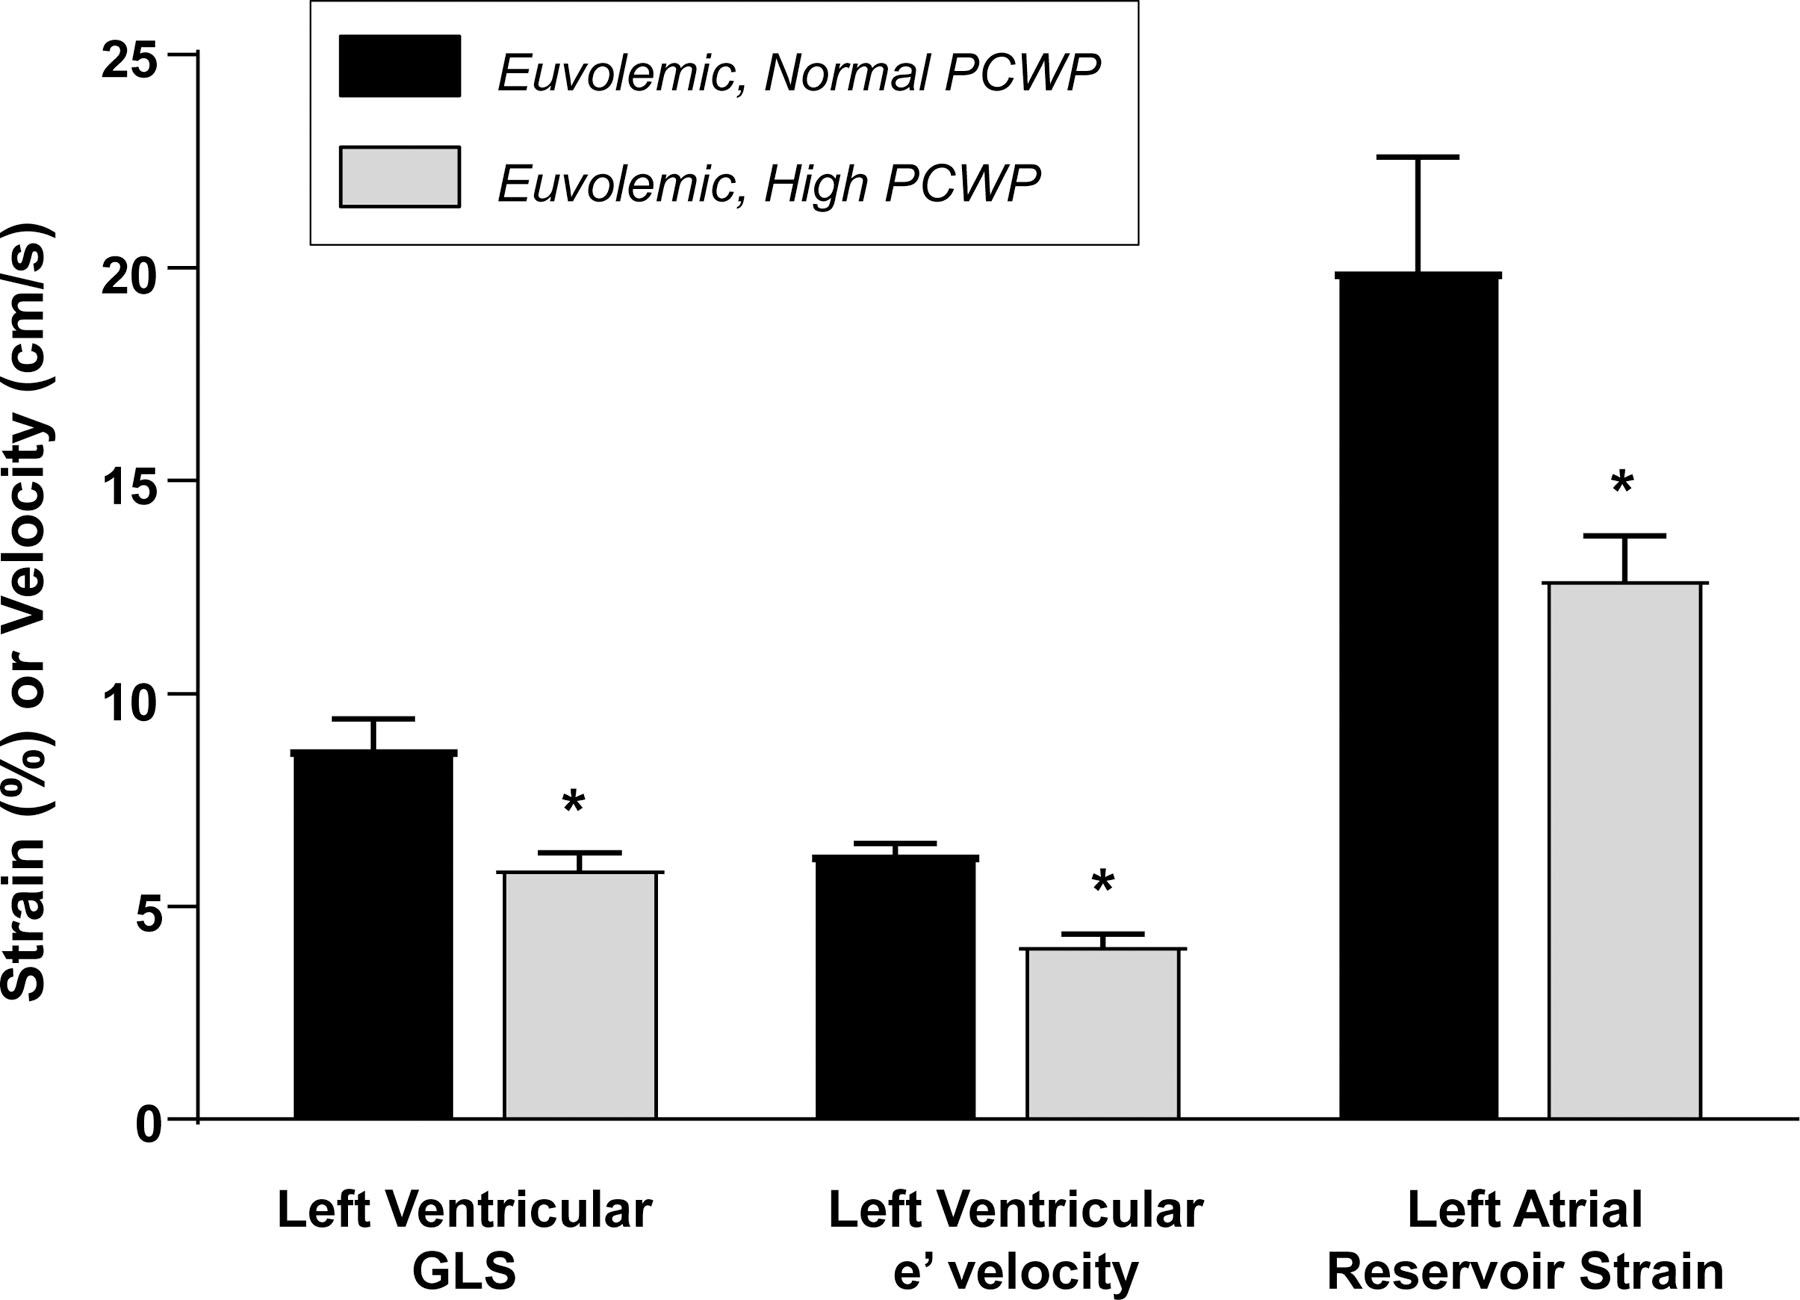
Compared to euvolemic patients with normal PCWP (black), patients with euvolemia but high PCWP (gray) displayed more myocardial dysfunction, with lower left ventricular global longitudinal strain (GLS), lower early diastolic relaxation velocities (e’), and decreased left atrial strain. *p<0.05 compared to normal PCWP.
Relationships among Intravascular Volume, Cardiac Function, and Hemodynamics
Directly measured PCWP was moderately and inversely related to LV diastolic function (e’ velocity, r= −0.44, p=0.001) and LA reservoir strain (r= −0.47, p<0.001; Figure 4). PCWP was directly correlated with TBV (r=0.42, p<0.001) to a moderate degree, with an even more modest relationship to percent blood volume excess or deficit (Figure 4). Similar relationships were observed between LV and LA function and blood volume for PA pressures, with the exceptions that the correlation with LA strain was stronger and blood volume weaker (Supplemental Figure 3).
Figure 4.
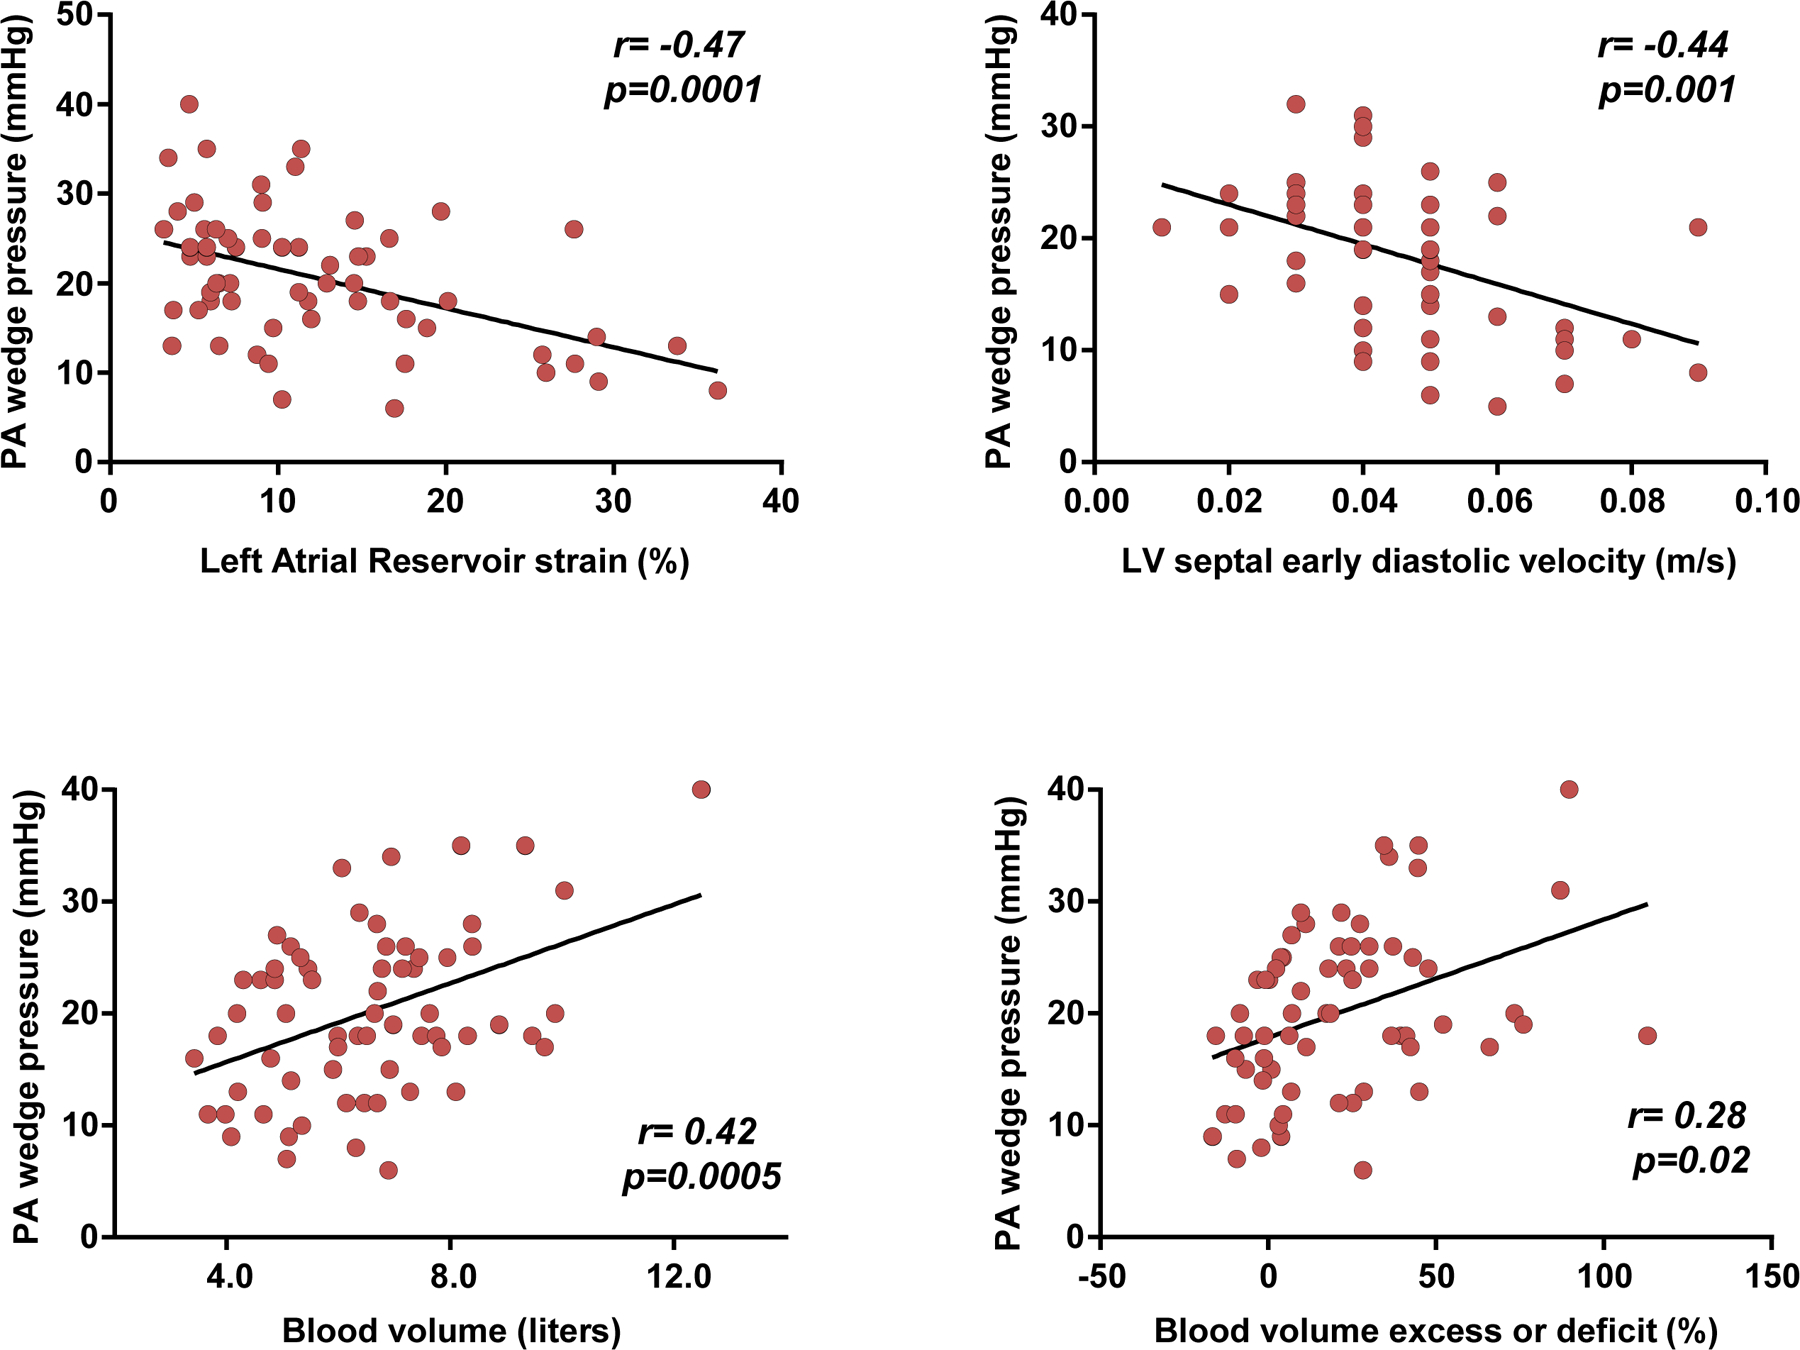
Correlations between pulmonary artery (PA) wedge pressures, left atrial function (strain), diastolic relaxation (e’), and intravascular blood volume.
CVP was weakly and inversely related to TAPSE (r=−0.30, p=0.02) and directly correlated to a moderate degree with TBV (r= 0.35, p=0.004) and percent TBV deviation from normal volume (r=0.46, p<0.001). Cardiac output was weakly but significantly correlated with LV and LA function as well as TBV (Supplemental Figure 4). In a multivariable linear regression model incorporating TBV and measures of LV diastolic and LA function, TBV, LV e’ velocity, and LA reservoir strain were each independently associated with PCWP (all p<0.05).
DISCUSSION
The principle findings of this study are that cardiac filling pressures in patients with chronic HF are similarly related to parameters of ventricular function, atrial function, and intravascular volume. As would be clinically expected, hypervolemic patients generally display higher filling pressures than euvolemic patients, but importantly there is also a large proportion of patients who have normal intravascular volume and demonstrate elevations in filling pressure, and this group is characterized by more significant cardiac dysfunction. These data support that while hypervolemia is associated with abnormal hemodynamics, there is not a constant relationship between pressure and volume in all patients with chronic HF, and additionally the severity of myocardial dysfunction needs to be taken into account when considering the determinants of hemodynamic perturbations. Consideration of jointly obtained data of both volume status and cardiac function may be important to guide optimal management in patients with chronic HF.
Physical signs and symptoms when used to estimate central filling pressures lack sensitivity and specificity, therefore, direct measurement at right heart catheterization has been used clinically for decades as the most reliable surrogate indicator of volume status in patients with HF, and generally considered the gold standard metric to guide volume management. However, discordance between measures of CVP and blood volume has been previously reported in clinical studies of critically ill20–23 and post-operative24–25 patients. To our knowledge this is the first study to evaluate the relationships among intravascular volume, right and left heart hemodynamics, and myocardial function in patients with HF, where the risk for decompensation is increased.
As shown in the present study, an elevation in CVP or PCWP should not unquestionably be equated with intravascular volume expansion, since elevated filling pressures were present in two-thirds of patients with normal intravascular volumes based upon direct blood volume measurements. Initiation or intensification of diuretic therapy based upon an elevated CVP when intravascular volume is not expanded, especially with aggressive diuretic therapy, could result in volume depletion leading to impaired organ perfusion and acute kidney injury. Conversely, a normal CVP does not necessarily reflect normal intravascular volume but can reflect compensated hypervolemia. As the current data indicate a significant minority of patients with hypervolemia (~15%) displayed normal biventricular filling pressures. Also noted here hypervolemia was associated with a lower SVR, higher CO/CI and elevated filling pressures which suggests a potential benefit in some chronic HF patients of intravascular volume expansion to maintain CO through the Frank-Starling relationship and, therefore, better hemodynamic outcome.
A component that was not measured in this study is the selective distribution and potential for re-distribution of venous circulation blood volume. Approximately 60–70% of blood volume resides in the venous circulation under normal circumstances, particularly the high capacity splanchnic venous system that serves as a vascular volume reservoir.27–29 While the venous component of TBV cannot be measured in isolation, prior data suggest that alterations in venous tone can importantly contribute to the acute uncoupling between intravascular volume and hemodynamic perturbations in HF patients,29–30 and this may be targeted therapeutically through use of interventions targeting venoconstriction. It is important to underscore that steady state conditions for patient assessment as shown in this cohort are necessary to discount any influence of acute redistribution of blood volume or fluid re-accumulation on hemodynamic measurements relative to measurements of intravascular volume.
Quantitative blood volume measurements and cardiac hemodynamics provide complementary information with parameters of myocardial function which may allow an even more integrated assessment of clinical status. This has implications not only for the approach to volume management (diuretics, vasodilators, or inotropes) and potentially patient outcomes, but also as an element of clinical trial design to help optimize patient selection and establish study endpoints particularly as more novel device-based therapies are advanced.31 Better understanding of the complex relationships among volume congestion, hemodynamic congestion and severity of myocardial dysfunction allows the appropriate interpretation of the respective quantitative data which will help identify and guide more individualized approaches to management in chronic HF patients.
Limitations
This is an observational single-center study of prospectively collected data from a tertiary referral medical center with potential limitations of selection bias and generalizability of findings. The cross-sectional nature of the data limits the ability to make inferences regarding causality. For example, significant correlations between TBV and PCWP cannot be singularly interpreted as proof that an expansion in volume is the cause of an elevation in PCWP The study population included predominately patients with HFrEF, and future studies with greater representation of HFpEF patients will be needed to learn more of the role and interaction of intravascular volume with cardiac hemodynamics and cardiac function in this phenotype. An associated issue to also be addressed in future studies is how intravascular volume status (hypervolemia or normal volume) and metrics of myocardial diastolic function relate to elevations in cardiac filling pressures that are uncovered only under conditions of stress32 (e.g. exercise intolerance).
CONCLUSIONS
The association of cardiac filling pressures with intravascular volume status cannot be assumed to be direct. Substantial numbers of patients with elevated filling pressure have normal intravascular volumes (36% in this cohort) and, also patients with normal volume demonstrate marked elevations in filling pressures (66% in this cohort). The interrelationships among intravascular volume, cardiac filling pressures, and parameters of myocardial function are complex requiring an awareness of the impact of all three elements to guide optimal and effective individualized HF management and therapy.
Supplementary Material
Supplemental Figure 1. Equations defining Cardiac Output (CO), Pulmonary Vascular Resistance (PVR), Systemic Vascular Resistance (SVR), Pulmonary Arteriolar Resistance (PAR), Pulmonary Artery Compliance (PAC), and Pulmonary Artery Elastance (PEa).
Supplemental Figure 2. Frequency distribution of total blood volume (TBV) across the whole patient cohort.
Supplemental Figure 3. Correlations between pulmonary artery systolic pressure and left atrial reservoir strain, left ventricular septal early diastolic velocity, total blood volume, and percent total blood volume deviation from normal expected volume.
Supplemental Figure 4. Correlations between cardiac output and left atrial reservoir strain, left ventricular septal early diastolic velocity, total blood volume, and percent total blood volume deviation from normal expected volume.
Funding
This work was supported by WLM being supported by unrestricted research grant from the Feldschuh Foundation for Clinical Research and Mayo Clinic Department of Cardiovascular Medicine Prospective Studies Award. BAB is supported by R01 HL128526 and U01 HL125205.
Abbreviations
- LVEF
left ventricular ejection fraction
- HF
heart failure
- NYHA
New York Heart Association
- GFR
Glomerular filtration rate
- TBV
Total blood volume
- PV
Plasma volume
- HFpEF
heart failure with preserved ejection fraction
- HFrEF
heart failure with reduced ejection fraction
- RBC
Red blood cell
Footnotes
Conflict of Interest
None.
Declaration of Helsinki
This study was conducted in compliance with the Declaration of Helsinki.
REFERENCES
- 1.Forrester JS, Water DD. Hospital treatment of congestive heart failure. Management according to hemodynamic profiles. Am J Med. 1978; 65(1):173–180. [DOI] [PubMed] [Google Scholar]
- 2.Forrester JS, Diamond G, Chatterjee K, Swan HJ. Medical therapy of acute myocardial infarction by application of hemodynamic subsets (first of two parts). N Engl J Med. 1976; 295(24):1356–1362. [DOI] [PubMed] [Google Scholar]
- 3.Stevenson LW. Are hemodynamic goals viable in tailoring heart failure therapy? Hemodynamic goals are relevant. Circulation. 2006; 113:1020–1027. [DOI] [PubMed] [Google Scholar]
- 4.Binanay C, Califf RM, Hasselblad V, O’Connor CM, Shah MR, Sopko G, Stevenson LW, ESCAPE Investigators, ESCAPE study coordinators. Evaluation study of congestive heart failure and pulmonary artery catheterization effectiveness: The ESCAPE Trial. JAMA. 2005; 294(13):1625–1633. [DOI] [PubMed] [Google Scholar]
- 5.Levey AS, Coresh J, Balk E, Kausz AT, Levin A, Steffes MW, Hogg RJ, Perrone RD, Lau J, Eknoyan G. National Kidney Foundation practice guidelines for chronic kidney disease: Evaluation, classification, and stratification. Ann Intern Med. 2003;139:137–147. [DOI] [PubMed] [Google Scholar]
- 6.Obokata M, Kane GC, Reddy YN, Olson TP, Melenovsky V, Borlaug BA. Role of diastolic stress testing in the evaluation for heart failure with preserved ejection fraction: A simultaneous invasive-echocardiographic study. Circulation. 2017; 135(9):825–838. [DOI] [PMC free article] [PubMed] [Google Scholar]
- 7.Reddy YNV, Obokata M, Egbe A, Yang JH, Pislaru S, Lin G, Carter R, Borlaug BA. Left atrial strain and compliance in the diagnostic evaluation of heart failure with preserved ejection fraction. Eur J. Heart Fail. 2019; 21(7):891–900. [DOI] [PubMed] [Google Scholar]
- 8.Obokata M, Reddy YNV, Shah SJ, Kaye DM, Gustafsson F, Hasenfuss G, Hoendermis E, Litwin SE, Komtebedde J, Lam C, Burkhoff D, Borlaug BA. Effects of interatrial shunt on pulmonary vascular function in heart failure with preserved ejection fraction. J Am Coll Cardiol. 2019; 74(21):2539–2550. [DOI] [PubMed] [Google Scholar]
- 9.Feldschuh J. Blood volume measurements in hypertensive disease. In: Larah JK, Brenner BM, editors. Hypertension: Pathology, Diagnosis, and Management. New York: Raven Press, 1990. [Google Scholar]
- 10.Feldschuh J, Enson Y. Prediction of normal blood volume. Circulation. 1977; 56:605–615 [DOI] [PubMed] [Google Scholar]
- 11.Feldschuh F, Katz S. The importance of correct norms in blood volume measurement. Am J Med Sci. 2007; 334 (1):41–46. [DOI] [PubMed] [Google Scholar]
- 12.Miller WL, Mullan BP. Understanding the heterogeneity in volume overload and fluid distribution in decompensated heart failure is key to optimal volume management. J Am Coll Cardiol: Heart Failure. 2014; 2:298–305. [DOI] [PubMed] [Google Scholar]
- 13.Miller WL, Albers DP, Gansen DN, Mullan BP. Intravascular volume profiles in patients with Class I and II systolic heart failure: Heterogeneity and volume overload are common even in mild heart failure. J Cardiac Fail. 2018; 24 (7):417–424. [DOI] [PubMed] [Google Scholar]
- 14.Lang RM, Badano LP, Mor-Avi V, Afilalo J, Armstrong A, Ernande L, Flachskampf FA, Foster E, Goldstein SA, Kuznetsova T, Lancellotti P, Muraru D, Picard MH, Rietzschel ER, Rudski L, Spencer KT, Tsang W, Voigt JU. Recommendations for cardiac chamber quantification by echocardiography in adults: An update from the American Society of Echocardiography and the European Association of Cardiovascular Imaging. J Am Soc Echocardiogr. 2015; 28(1):1–39. [DOI] [PubMed] [Google Scholar]
- 15.Nagueh SF, Smiseth OA, Appleton CP, Byrd BF, Dokainish H, Edvardsen T, Flachskampf FA, Gillebert TC, Klein AL, Lancellotti P, Marino P, Oh JK, Popescu BA, Waggoner AD. Recommendations for the evaluation of left ventricular diastolic function by echocardiography: An update from the American Society of Echocardiography and the European Association of Cardiovascular Imaging. J Am Soc Echocardiogr. 2016; 29(4):277–314. [DOI] [PubMed] [Google Scholar]
- 16.Reddy YNV, Obokata M, Egbe A, Yang JH, Pislaru S, Lin G, Carter R, Borlaug BA. Left atrial strain and compliance in the diagnostic evaluation of heart failure with preserved ejection fraction. Eur J Heart Fail. 2019; 21(7):891–900. [DOI] [PubMed] [Google Scholar]
- 17.Reddy YNV, Obokata M, Egbe A, Yang JH, Pislaru s, Lin G, Carter R, Borlaug BA. Left atrial strain and compliance in the diagnostic evaluation of heart failure with preserved ejection fraction. Eur J Heart Fail 2019; 21(7): 891–900. [DOI] [PubMed] [Google Scholar]
- 18.Rudski LG, Lai WW, Afilalo J, Hua L, Handschumacher MD, Chandrasekaran K, Solomon SD, Louie EK, Schiller NB. Guidelines for the echocardiographic assessment of the right heart in adults: A report from the American Society of Echocardiography endorsed by the European Association of Echocardiography, a registered branch of the European Society of Cardiology, and the Canadian Society of Echocardiography. J Am Soc Echocardiogr. 2010; 23(7):685–713. [DOI] [PubMed] [Google Scholar]
- 19.Obokata M, Reddy YNV, Melenovsky V, Pislaru S, Borlaug BA. Deterioration in right ventricular structure and function over time in patients with heart failure and preserved ejection fraction. Eur Heart J. 2019; 40(8):689–697. [DOI] [PMC free article] [PubMed] [Google Scholar]
- 20.Shippy CR, Appel PL, Shoemaker WC. Reliability of clinical monitoring to assess blood volume in critically ill patients. Critical Care Med. 1984; 12 (2):107–112. [DOI] [PubMed] [Google Scholar]
- 21.Kuntscher MV, Germann G, Hartmann B. Correlations between cardiac output, stroke volume, central venous pressure, intra-abdominal pressure and total circulating blood volume in resuscitation of major burns. Resuscitation. 2006; 70:37–43. [DOI] [PubMed] [Google Scholar]
- 22.Alrawi SJ, Miranda LS, Cunningham JN Jr., Acinapura AJ, Raju R. Correlation of blood volume values and pulmonary artery catheter measurements. Saudi Med J. 2002; 23 (11):1367–1372. [PubMed] [Google Scholar]
- 23.Calvin JE, Driedger AA, Sibbald WJ. Does the pulmonary capillary wedge pressure predict left ventricular preload in critically ill patients? Crit Care Med. 1981: 9:437–443. [DOI] [PubMed] [Google Scholar]
- 24.Oohashi S, Endoh H. Does central venous pressure or pulmonary capillary pressure reflect the status of circulating blood volume in patients after extended transthoracic esophagectomy? J Anesth. 2005; 19:21–25. [DOI] [PubMed] [Google Scholar]
- 25.Back S-M, Makabali GG, Bryan-Brown CW, Kusek JM, Shoemaker WC. Plasma expansion in surgical patients with high central venous pressure (CVP); the relationship of blood volume to hematocrit, CVP, pulmonary wedge pressure, and cardiorespiratory changes. Surgery. 1975; 78 (3):304–315. [PubMed] [Google Scholar]
- 26.Gelman S. Venous function and central venous pressure – A physiologic story. Anesthesiology. 2008; 108:35–48. [DOI] [PubMed] [Google Scholar]
- 27.Burkhoff D, Tyberg JV. Why does pulmonary venous pressure rise after onset of LV dysfunction: A theoretical analysis. Am J Physiol. 1993; 265:H1819–H1828. [DOI] [PubMed] [Google Scholar]
- 28.Tyberg JV. How changes in venous capacitance modulate cardiac output. Pflugers Arch – Eur J Physiol. 2002; 445:10–17. [DOI] [PubMed] [Google Scholar]
- 29.Burchell AE, Sobotka PA, Hart EC, Nightingale AK, Dunlap ME. Chemohypersensitivity and autonomic modulation of venous capacitance in the pathophysiology of acute decompensated heart failure. Curr Heart Fail Rep. 2013; 10:139–146. [DOI] [PubMed] [Google Scholar]
- 30.Fallick C, Sobotka PA, Dunlap ME. Sympathetically mediated changes in capacitance – Redistribution of the venous reservoir as a cause of decompensation. Circ Heart Fail. 2011; 4:669–675. [DOI] [PubMed] [Google Scholar]
- 31.Rosenblum H, Kapur NK, Abraham WT, Udelson J, Itkin M, Uriel N, Voors AA, Burkhoff D. Conceptual considerations for device-based therapy in acute decompensated heart failure DRI2P2S. Circ Heart Fail. 2020; epub April 2020. [DOI] [PubMed]
- 32.Borlaug BA, Nishimura RA, Sorajja P, Lam CSP, Redfield MM. Exercise hemodynamics enhance diagnosis of early heart failure with preserved ejection fraction. Circ Heart Failure. 2010; 3: 588–595. [DOI] [PMC free article] [PubMed] [Google Scholar]
- 33.Verbrugge FH, Guazzi M, Testani JM, Borlaug BA. Altered hemodynamics and end-organ damage in heart failure. Circ 2020; 142:998–1012. [DOI] [PMC free article] [PubMed] [Google Scholar]
Associated Data
This section collects any data citations, data availability statements, or supplementary materials included in this article.
Supplementary Materials
Supplemental Figure 1. Equations defining Cardiac Output (CO), Pulmonary Vascular Resistance (PVR), Systemic Vascular Resistance (SVR), Pulmonary Arteriolar Resistance (PAR), Pulmonary Artery Compliance (PAC), and Pulmonary Artery Elastance (PEa).
Supplemental Figure 2. Frequency distribution of total blood volume (TBV) across the whole patient cohort.
Supplemental Figure 3. Correlations between pulmonary artery systolic pressure and left atrial reservoir strain, left ventricular septal early diastolic velocity, total blood volume, and percent total blood volume deviation from normal expected volume.
Supplemental Figure 4. Correlations between cardiac output and left atrial reservoir strain, left ventricular septal early diastolic velocity, total blood volume, and percent total blood volume deviation from normal expected volume.