Abstract
Background and Objectives
In patients with ischemic stroke (IS), IV alteplase (tissue plasminogen activator [tPA]) and endovascular thrombectomy (EVT) reduce long-term disability, but their utilization has not been fully optimized. Prior research has also demonstrated disparities in the use of tPA and EVT specific to sex, race/ethnicity, socioeconomic status, and geographic location. We sought to determine the utilization of tPA and EVT in the United States from 2016–2018 and if disparities in utilization persist.
Methods
This is a retrospective, longitudinal analysis of the 2016–2018 National Inpatient Sample. We included adult patients who had a primary discharge diagnosis of IS. The primary study outcomes were the proportions who received tPA or EVT. We fit a multivariate logistic regression model to our outcomes in the full cohort and also in the subset of patients who had an available baseline National Institutes of Health Stroke Scale (NIHSS) score.
Results
The full cohort after weighting included 1,439,295 patients with IS. The proportion who received tPA increased from 8.8% in 2016 to 10.2% in 2018 (p < 0.001) and who had EVT from 2.8% in 2016 to 4.9% in 2018 (p < 0.001). Comparing Black to White patients, the odds ratio (OR) of receiving tPA was 0.82 (95% confidence interval [CI] 0.79–0.86) and for having EVT was 0.75 (95% CI 0.70–0.81). Comparing patients with a median income in their zip code of ≤$37,999 to >$64,000, the OR of receiving tPA was 0.81 (95% CI 0.78–0.85) and for having EVT was 0.84 (95% CI 0.77–0.91). Comparing patients living in a rural area to a large metro area, the OR of receiving tPA was 0.48 (95% CI 0.44–0.52) and for having EVT was 0.92 (95% CI 0.81–1.05). These associations were largely maintained after adjustment for NIHSS, although the effect size changed for many of them. Contrary to prior reports with older datasets, sex was not consistently associated with tPA or EVT.
Discussion
Utilization of tPA and EVT for IS in the United States increased from 2016 to 2018. There are racial, socioeconomic, and geographic disparities in the accessibility of tPA and EVT for patients with IS, with important public health implications that require further study.
Acute ischemic stroke (IS) affects almost 700,000 Americans a year and remains the leading cause of long-term disability.1,2 In eligible patients with IS, IV alteplase (tissue plasminogen activator [tPA]) and endovascular thrombectomy (EVT) are proven to reduce the likelihood of long-term disability from IS, but their availability and utilization has not yet been fully optimized,3-5 despite consensus guidelines advocating their use.6 Prior research has also demonstrated patient-level disparities in the use of tPA and EVT specific to sex, race/ethnicity, socioeconomic status, and geographic location.7-16
In October 2016, the Centers for Medicare & Medicaid Services released ICD-10-CM codes for the admission National Institutes of Health Stroke Scale (NIHSS) score, to be used in conjunction with the IS coding category (I63.x).17 Baseline stroke severity (NIHSS) is important for accurate modeling of IS outcomes18-20 and for evaluating the utilization of IS interventions, which vary by stroke severity.6 As of this writing, the National Inpatient Sample (NIS) provides 3 years of data (2016–2018) with the potential for NIHSS documentation.21 We explored the changes in the utilization of tPA and EVT in NIS and whether there were persistent disparities in access to IS interventions after adjusting for stroke severity (NIHSS).
Methods
Study Design
This is a retrospective, longitudinal analysis of the 2016–2018 NIS data, which corresponds to the release of the ICD-10-CM update. NIS is the largest all-payer inpatient claims-based database in the United States and is designed as a stratified sample of hospitals participating in the Healthcare Cost and Utilization Project.22 We included nonelective admissions of adult patients (≥18 years) who had a primary discharge diagnosis of IS defined by ICD-10-CM (code I63).23 We excluded patients with missing data on demographic variables (<1% of patients). Patients could be represented more than one time if they were discharged with IS from a hospital more than once during the study period.
There were 2 study cohorts: the full cohort with all available patients and the NIHSS cohort with patients who had an NIHSS recorded in their claims data. According to Centers for Medicare & Medicaid Services instructions, the NIHSS (ICD-10-CM R29.7x) is meant to be the initial or admission NIHSS.17 The primary study outcomes were the proportions of patients with IS who received tPA (ICD-10-PCS 3E03317)24 or had EVT (ICD codes in eTable 1, links.lww.com/WNL/B615). The secondary outcome was whether NIHSS was documented in 2017–2018. We conformed to the STROBE (Strengthening the Reporting of Observational Studies in Epidemiology) guidelines for cohort studies.
Starndard Protocol Approvals, Registrations, and Patient Consents
Our study used de-identified publicly available data and was thus exempt from University of Utah institutional review board approval. Informed consent is not obtained by the Centers for Medicare & Medicaid Services for the NIS because the dataset does not contain identifiable information.
Demographic and Hospital Variables
We classified sex as male or female; race/ethnicity as non-Hispanic White, non-Hispanic Black, Hispanic (any race), Asian or Pacific Islander, Native American (NIS designation for American Indian/Alaskan Native), and other; and age as <55, 55–64, 65–74, and ≥75 years. Other patient-level variables included median income in the patient's zip code by quartiles, patient urban–rural location (county-based urban–rural classification with 6 categories developed by the National Center for Health Statistics for use in health care research),25 the Elixhauser Comorbidity Index,26 and the medical comorbidities of diabetes, hypertension, obesity, congestive heart failure, and intubation. Hospital-level variables included United States Census region, bed size using region-specific NIS criteria (small/medium/large),27 and teaching status (nonteaching vs teaching).
Statistical Analysis
Statistical analysis was performed using STATA version 16.1 (Stata Corp) and the SVY suite of commands to account for the NIS survey design. We obtained national estimates by using the yearly sampling weights provided in the NIS.21 In order to estimate the standard error in single sampling units, which only occur in 0.4% of strata in the full cohort, we used the single-unit (centered) approach, which centers them at the overall population mean. Alternative approaches to single sampling units would be to exclude them or use a scaling factor derived from the average of the variances from strata with multiple sampling units. For the current analysis, we chose the centered approach because excluding strata or using a scaled approach would inherently introduce more bias, which is consistent with how prior researchers have approached the NIS.28 For subpopulation estimations, we used the subpop() option of SVY for accurate estimation. We report the weighted descriptive statistics for the demographic and hospital variables and plotted a smoothed graph of the weighted monthly proportion of patients who had primary outcomes. We also report proportions of tPA, EVT, and NIHSS after stratification by patient- and hospital-level variables and tested for intergroup differences with a design-based χ2 test.
We fit multivariable logistic regression models to derive odds ratios (ORs) for our primary outcomes, which a priori included the covariates of patient age, sex, and race/ethnicity. We also included hospital Census region, hospital teaching status, hospital bed size, patient location, and median income in the patient's zip code to provide point estimates of additional geographic and socioeconomic factors that could affect the likelihood of receiving tPA or EVT,29-33 and to account for those disparities when providing point estimates for age, sex, and race/ethnicity.
In the NIHSS cohort, we also adjusted for NIHSS, which was modeled as an interval variable with possible values of 0–42. As a sensitivity analysis, we also modeled NIHSS in quartiles and as a nonlinear restricted cubic spline with 5 knots. Because future research that adjusts for NIHSS as a measure of stroke severity, and not the exposure of interest, is likely to use NIHSS as an interval variable, we treated it as such in our main models. After logistic regression, we used marginal effects to calculate the predicted probability of our outcomes for the change of specific variables while holding the other variables at their average predicted value.34
We calculated the variance inflation factor for each variable by fitting a regression model to the individual variable with all other covariates as predictors and manually calculated the variance inflation factor by the formula VIF = 1/(1 − R2).35 An acceptable VIF was defined as a mean value <10. To explore whether the addition of NIHSS improved discrimination of our logistic regression models, we report the area under the receiver operating characteristic curve (AUC) with and without NIHSS as a covariate.
Data Availability
The data used in this analysis are publicly available from the Centers for Medicare & Medicaid Services at distributor.hcup-us.ahrq.gov.
Results
The full cohort included 1,439,295 patients with IS, of which 32.1% were from 2016, 33.5% from 2017, and 34.4% from 2018, consistent with a small increase in patients with IS in the NIS during this time period. Within the full cohort, 384,700 (26.7%) had a documented admission NIHSS. The demographics for the full cohort are shown in Table 1; 50.2% of patients were female, 68.5% were White, and the mean age was 70 years. Vascular risk factors such as hypertension, diabetes, and obesity were common in patients with IS, affecting 84.8%, 38.9%, and 13.6%, respectively. Overall, 9.5% of patients with IS received tPA and 3.8% had EVT during the study's time period.
Table 1.
Weighted Patient Demographics, Acute Stroke Interventions, and Hospital Characteristics for the Full Cohort and NIHSS Cohort

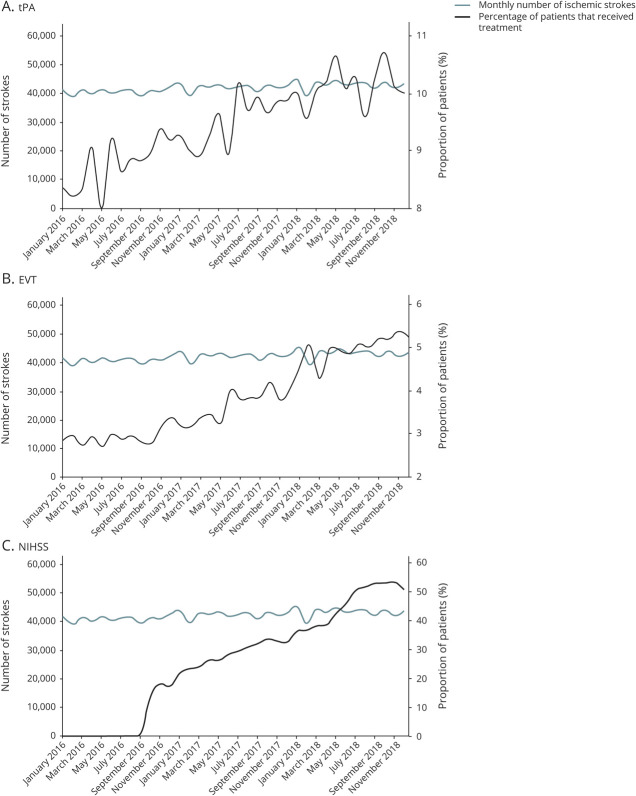
Throughout the study period, there was a consistent increase in the proportion of patients with IS who received tPA or EVT (Figure 1, A and B). The proportion of patients with IS who received tPA was 8.8% in 2016, 9.6% in 2017, and 10.2% in 2018 (p < 0.001) and who had EVT was 2.8% in 2016, 3.6% in 2017, and 4.9% in 2018 (p < 0.001). Beginning in late 2016, the proportion of patients with IS with a documented admission NIHSS increased consistently, and stayed above 50% after June 2018 (Figure 1C).
Figure 1. Monthly Trends for the Full Cohort in Usage of IV Alteplase (tPA), EVT, and NIHSS.
(A) IV alteplase (tissue plasminogen activator [tPA]). (B) Endovascular thrombectomy (EVT). (C) National Institutes of Health Stroke Scale (NIHSS).
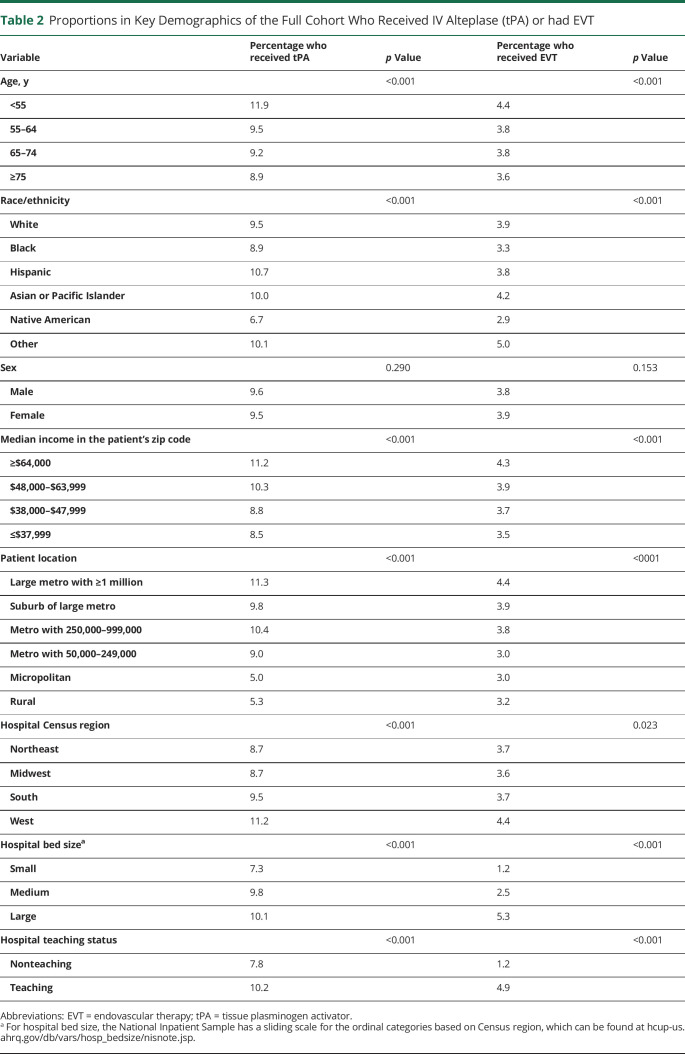
After stratification by key demographic and hospital variables, the proportion of patients who received tPA or EVT is shown in Table 2 for the full cohort. Black and Native American patients had the lowest proportion for both tPA and EVT. Compared to White patients, of whom 9.5% and 3.9% received tPA and EVT, respectively, only 6.7% and 2.9% of Native American patients did and 8.9% and 3.3% of Black patients. Other variables that predicted low rates of tPA and EVT included age ≥75 years, with a median income in the patient's zip code ≤$37,999, in more rural locations, at nonteaching hospitals, and in small bed size hospitals.
Table 2.
Proportions in Key Demographics of the Full Cohort Who Received IV Alteplase (tPA) or had EVT
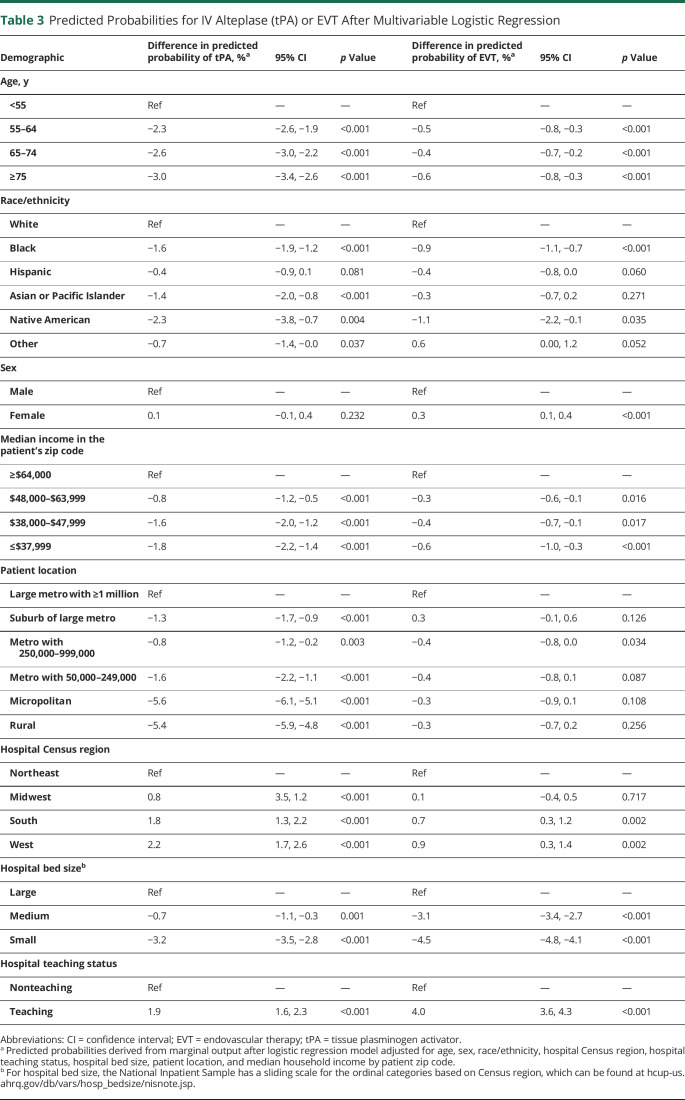
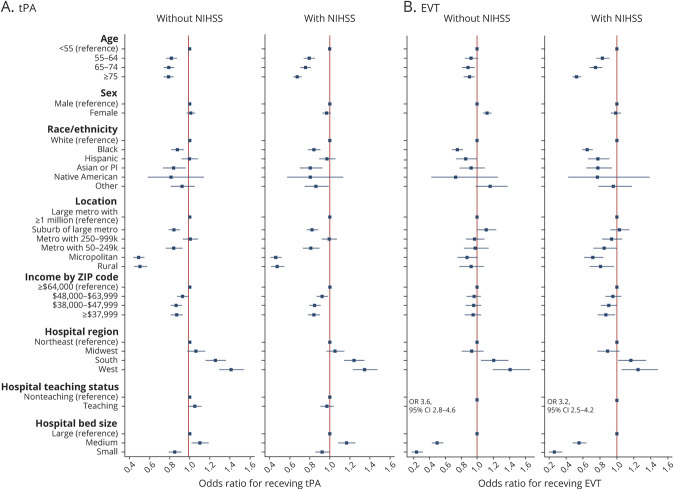
The results of our multivariable models fit to tPA and EVT in the full cohort are shown in Figure 2. The mean VIF of the models was <2, indicating acceptable collinearity. Comparing Black to White patients, the OR of receiving tPA was 0.82 (95% confidence interval [CI] 0.79–0.86) and for having EVT was 0.75 (95% CI 0.70–0.81). Comparing patients with a median income in their zip code of ≤$37,999 to >$64,000, the OR of receiving tPA was 0.81 (95% CI 0.78–0.85) and for having EVT was 0.84 (95% CI 0.77–0.91). Comparing patients living in a rural area to a large metro area, the OR of receiving tPA was 0.48 (95% CI 0.44–0.52) and for having EVT was 0.92 (95% CI 0.81–1.05). These findings are shown in relation to the difference in predicted probability in Table 3.
Figure 2. Adjusted Odds of Receiving IV Alteplase (tPA) Shown for Demographic, Hospital, and Socioeconomic Categories in the Full Cohort and for Those Receiving EVT.
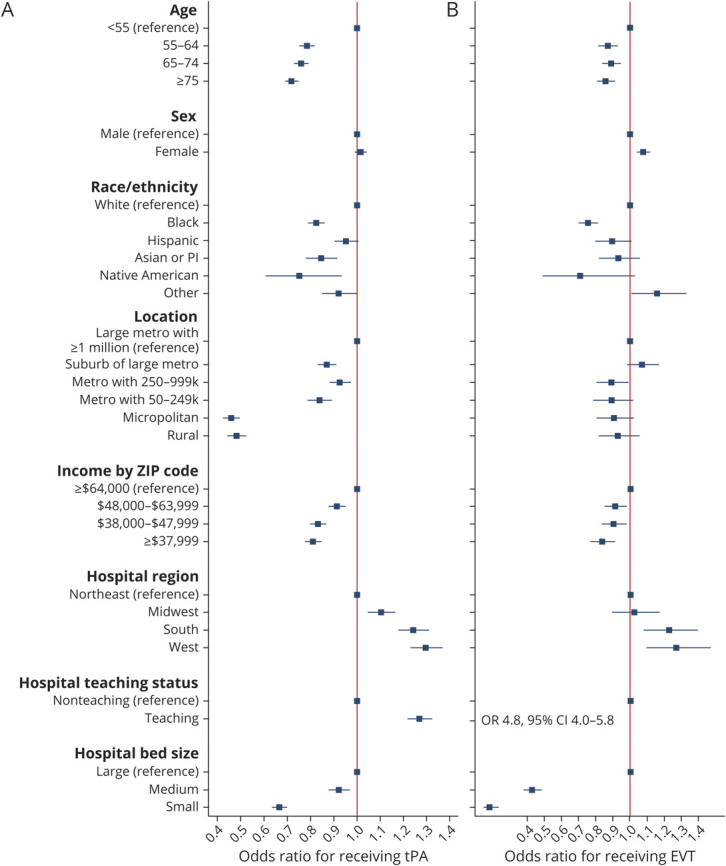
Adjusted odds of receiving IV alteplase (tissue plasminogen activator [tPA]) shown for demographic, hospital, and socioeconomic categories in the full cohort (A) and for those receiving endovascular therapy (EVT) (B). Model adjusted for patient age, sex, race/ethnicity, hospital Census region, hospital teaching status, hospital bed size, patient location, and median household income by patient zip code. Model in patients with an National Institutes of Health Stroke Scale (NIHSS) is also adjusted for NIHSS. CI = confidence interval; OR = odds ratio.
Table 3.
Predicted Probabilities for IV Alteplase (tPA) or EVT After Multivariable Logistic Regression
In the NIHSS cohort, our multivariable logistic regression models demonstrated a significant increase in the ability of the models to predict receipt of IV tPA or EVT when NIHSS was included as a covariate. The AUC of the model fit to tPA increased from 0.584 (95% CI 0.579–0.589) to 0.649 (95% CI 0.643–0.655) with the addition of NIHSS and the AUC of the model fit to EVT increased from 0.707 (95% CI 0.695–0.718) to 0.854 (95% CI 0.847–0.860). While modeling NIHSS in quartiles or as a restricted cubic spline further increased the AUCs of these models, the increase was marginal (eTable 2, links.lww.com/WNL/B615).
The associations seen in the full cohort were largely maintained in the NIHSS cohort, although the effect size changed for many of them (Figure 3). For example, without adjusting for NIHSS, the OR for receiving tPA in patients ≥75 was 0.79 (95% CI 0.74–0.84), while after adjustment for NIHSS, it was 0.68 (95% CI 0.64–0.72). Without adjusting for NIHSS, Asian or Pacific Islander patients had a nonsignificant lower odds of receiving EVT than White patients (hazard ratio 0.93, 95% CI 0.78–1.10), but after adjusting for NIHSS, the association became significant (hazard ratio 0.78, 95% CI 0.65–0.95). Without adjusting for NIHSS, women appeared more likely to have EVT than men (OR 1.12, 95% CI 1.06–1.18); after adjustment for NIHSS, the association was no longer significant (OR 0.99, 95% CI 0.93–1.05). To further illustrate this point, eFigure 1 (links.lww.com/WNL/B615) shows how the probability of receiving tPA or EVT by different race/ethnicity can change in adjusted vs unadjusted models and how adjusting for NIHSS affects the point estimates.
Figure 3. Adjusted Odds of Receiving IV Alteplase (tPA) or EVT in Patients With a National Institutes of Health Stroke Scale (NIHSS) Score (n = 384,700), Shown for Models Without and With Adjustment for the NIHSS Score.
(A) IV alteplase (tissue plasminogen activator [tPA]). (B) endovascular thrombectomy (EVT). Model adjusted for patient age, sex, race/ethnicity, hospital Census region, hospital teaching status, hospital bed size, patient location, and median household income by patient zip code. Model in patients with an NIHSS is also adjusted for NIHSS.
We also fit a multivariable logistic regression model to the secondary outcome of documentation of an NIHSS in 2017–18 (n = 977,695). We restricted this analysis to 2017–2018 because ICD documentation of an NIHSS only became available in late 2016.17 The results of this analysis are shown in Table 4. Patient-level variables that were associated with lower odds of NIHSS documentation included older age (≥75 years), Black race, lower median income by patient zip code, and female sex. However, hospital level and treatment variables were more predictive. The ORs for NIHSS documentation were 0.64 (95% CI 0.57–0.71) in smaller bed size hospitals, 1.77 (95% CI 1.60–1.95) for teaching hospitals, 2.05 (95% CI 1.98–2.13) for patients who received tPA, and 2.32 (95% CI 2.16–2.49) for patients who received EVT.
Table 4.
Multivariable Logistic Regression Model Fit to the Secondary Outcome of Having an NIH Stroke Scale Score Recorded

Discussion
Using NIS data from 2016–2018, we show that in the United States there has been an increase in the utilization of tPA and EVT for IS and administrative coding of the NIHSS. The rise in tPA and EVT use in patients with IS may reflect improved availability and acceptance of these interventions, more widespread teleneurology, better stroke systems of care, and ongoing efforts by the American Heart Association and others to educate patients about seeking timely medical care for IS symptoms.6,36-42 While these developments are favorable, the persistence of previously demonstrated7-16 racial, socioeconomic, and geographic disparities in the accessibility of tPA and EVT for patients with IS has important public health implications. We also demonstrated these disparities are present after adjusting for stroke severity with the NIHSS, which is an important confounder that was not previously available in administrative datasets like the NIS. Furthermore, many of the same racial, socioeconomic, and geographic disparities that are associated with tPA or EVT utilization are also associated with documentation of the NIHSS, which has not previously been demonstrated with an administrative dataset.
Our results are consistent with research predating the current study period that showed race/ethnicity, socioeconomic status, and geographic location are determinants of the likelihood that patients with IS will receive interventions.8,13-16,43-45 The factors that account for disparities in IS interventions remain uncertain, but awareness of stroke symptoms, cultural and language barriers, access to health care facilities, and insurance status and income may all play a role.46 Although difficult to capture, implicit bias, or potentially explicit bias, may also play a role.47
Contrary to prior research and meta-analyses,7,10,12 we did not find that sex was associated with the likelihood of receiving tPA. The reason for this discrepancy could be explained by a progressive narrowing of the gap in tPA utilization between male and female patients from 2008 onwards that was shown in a meta-analysis published in 2020.10 In that study, the most recent year of data was 2015 and our analysis focuses exclusively on 2016–2018 and thus may reflect that a gap is no longer present in the United States. Women did have higher odds of EVT in our full cohort, but it was no longer significant after adjusting for NIHSS, implying that prior research that used administrative datasets may not have accurately measured this association.12
We also show that administrative coding of the NIHSS has progressively increased in patients with IS and that the addition of NIHSS as a covariate significantly improves the modeling of IS interventions. The increasing documentation of admission NIHSS will help researchers and hospital quality officers leverage administrative datasets to provide more reliable analyses and investigations.
Our study has several important limitations. The most important is that we lack data on additional patient-specific factors that may influence IS interventions, such as time from stroke onset to initial medical care, contraindications to IS treatments, or neuroimaging data. As with all administrative datasets, misclassification bias is a limitation, although our use of the ICD-10-CM code I63 in the primary discharge diagnosis position limits that bias for the identification of patients with IS. It is more likely that we undercaptured cases of tPA or EVT interventions, although that would probably occur in a random fashion and should not have a major effect on our analysis of disparities.
Because the NIS does not have unique patient identifiers, we are unable to account for the possibility that some patients could have had recurrent IS hospital admissions within a short time frame and thus potentially be ineligible for interventions. We also left interhospital transfers (10.7% of the patients) in the analysis, who could therefore appear twice in the dataset. We considered this appropriate because the identification of tPA and EVT was based on procedural codes that would be applicable to only one hospital and excluding these patients would bias the geographic analyses. For example, if a patient is transferred from a rural location or small hospital to a tertiary hospital for an intervention, removing transfers from the dataset would exclude this patient from our analysis.
Similar to prior research that used the NIS to examine disparities in acute stroke care, we cannot exclude unmeasured confounding or explain the root cause of our findings. We also lack granularity in many of our variables due to the administrative nature of NIS. For example, we are not able to examine ethnicity independent of race, or gender independent of sex, because of how information is collected in NIS. However, this study has unique strengths, including its large and nationally representative sample of all-payer claims, up-to-date data, and the ability to conduct subgroup analyses that are adjusted for admission stroke severity.
In a nationally representative sample of patients with IS in the United States from 2016 to 2018, we show an increase in the utilization of tPA and EVT. These advances are not shared equally and we find racial, socioeconomic, and geographic disparities in the accessibility of tPA and EVT, which warrant additional research to determine the most effective methods of closing these gaps.
Acknowledgment
This article was prepared using the National Inpatient Sample database obtained from the Agency for Healthcare Research and Quality (AHRQ) and does not necessarily reflect the opinions or views of the AHRQ. The AHRQ had no role in the design and conduct of the study; collection, management, analysis, and interpretation of the data; preparation, review, or approval of the manuscript; and decision to submit the manuscript for publication.
Glossary
- AUC
area under the receiver operating characteristic curve
- CI
confidence interval
- EVT
thrombectomy
- ICD-10-CM
International Classification of Diseases, 10th revision, Clinical Modification
- IS
ischemic stroke
- NIHSS
National Institutes of Health Stroke Scale
- NIS
National Inpatient Sample
- OR
odds ratio
- tPA
tissue plasminogen activator
- VIF
variance inflation factor
Appendix. Authors
Editorial, page 1059
Podcast: NPub.org/Podcast9723
Study Funding
Dr. de Havenon: NIH-NINDS K23NS105924. Dr. Sheth: NIH-NINDS U01NS106513, R01NS11072, R01NR018335, R03NS112859, U24NS107215, U24NS107136, and American Heart Association 17CSA33550004. Dr. Majersik: NIH/NINDS U24NS107228.
Disclosure
A. de Havenon has investigator-initiated research support from Regeneron and AMAG Pharmaceuticals. K.N. Sheth reports funding from Biogen, Novartis, Bard, Hyperfine, Astrocyte, and Alva Health. J.J. Majersik is Associate Editor for Stroke and a reviewer for UpToDate. The remaining authors report no disclosures. Go to Neurology.org/N for full disclosures.
References
- 1.Virani S, Alonso A, Benjamin Emelia J, et al. Heart disease and stroke statistics: 2020 update: a report from the American Heart Association. Circ Am Heart Assoc. 2020;141:e139-e596. [DOI] [PubMed] [Google Scholar]
- 2.Donkor ES. Stroke in the 21st Century: a snapshot of the burden, epidemiology, and quality of life. Stroke Res Treat. 2018;2018:3238165. [DOI] [PMC free article] [PubMed] [Google Scholar]
- 3.McTaggart RA, Holodinsky JK, Ospel JM, et al. Leaving no large vessel occlusion stroke behind: reorganizing stroke systems of care to improve timely access to endovascular therapy. Stroke. 2020;51(7):1951-1960. [DOI] [PubMed] [Google Scholar]
- 4.Goyal M, Ospel JM. Stroke systems of care: current state of affairs and future directions. Stroke. 2020;51(7):1928-1931. [DOI] [PubMed] [Google Scholar]
- 5.Wilcock AD, Zachrison KS, Schwamm LH, Uscher-Pines L, Zubizarreta JR, Mehrotra A. Trends among rural and urban Medicare beneficiaries in care delivery and outcomes for acute stroke and transient ischemic attacks, 2008-2017. JAMA Neurol. 2020;77(7):863-871. [DOI] [PMC free article] [PubMed] [Google Scholar]
- 6.Powers W J, Rabinstein A A, Ackerson T, et al. Guidelines for the early management of patients with acute ischemic stroke: 2019 update to the 2018 guidelines for the early management of acute ischemic stroke: a guideline for healthcare professionals from the American Heart Association/American Stroke Association. Stroke. 2019;50(12):e344-e418. [DOI] [PubMed] [Google Scholar]
- 7.Boehme AK, Carr BG, Kasner SE, et al. Sex differences in rt-PA utilization at hospitals treating stroke: the national inpatient sample. Front Neurol. 2017;8:500. [DOI] [PMC free article] [PubMed] [Google Scholar]
- 8.Kimball MM, Neal D, Waters MF, Hoh BL. Race and income disparity in ischemic stroke care: nationwide inpatient sample database, 2002 to 2008. J Stroke Cerebrovasc Dis. 2014;23(1):17-24. [DOI] [PubMed] [Google Scholar]
- 9.Lorenzo R, Rabinstein Alejandro A, Harry Cloft, Knudsen John M, Rangel CL, Waleed B. Racial and ethnic disparities in the utilization of thrombectomy for acute stroke. Stroke Am Heart Assoc. 2019;50(9):2428-2432. [DOI] [PubMed] [Google Scholar]
- 10.Strong B, Lisabeth LD, Reeves M. Sex differences in IV thrombolysis treatment for acute ischemic stroke: a systematic review and meta-analysis. Neurology. 2020;95(1):e11-e22. [DOI] [PubMed] [Google Scholar]
- 11.Otite FO, Akano EO, Akintoye E, et al. Rural-urban disparities in intracerebral hemorrhage mortality in the USA: preliminary findings from the national inpatient sample. Neurocrit Care. 2020;32(3):715-724. [DOI] [PMC free article] [PubMed] [Google Scholar]
- 12.Bushnell C, Howard VJ, Lisabeth L, et al. Sex differences in the evaluation and treatment of acute ischaemic stroke. Lancet Neurol. 2018;17(7):641-650. [DOI] [PubMed] [Google Scholar]
- 13.Cruz-Flores S, Rabinstein A, Biller J, et al. Racial-ethnic disparities in stroke care: the American experience: a statement for healthcare professionals from the American Heart Association/American Stroke Association. Stroke. 2011;42(7):2091-2116. [DOI] [PubMed] [Google Scholar]
- 14.Ajinkya S, Almallouhi E, Turner N, Al Kasab S, Holmstedt CA. Racial/ethnic disparities in acute ischemic stroke treatment within a telestroke network. Telemed e-Health. 2019;26(10):1221-1225. [DOI] [PubMed] [Google Scholar]
- 15.Niklasson A, Herlitz J, Jood K. Socioeconomic disparities in prehospital stroke care. Scand J Trauma Resuscitation Emerg Med. 2019;27:53. [DOI] [PMC free article] [PubMed] [Google Scholar]
- 16.Green TL, Singh P, King-Shier K. The impact of ethnic/racial status on access to care and outcomes after stroke: a narrative systematic review. J Vasc Nurs. 2019;37(3):199-212. [DOI] [PubMed] [Google Scholar]
- 17.ICD-10-CM official guidelines for coding and reporting [online]. 2019. Accessed January 25, 2021. cms.gov/Medicare/Coding/ICD10/Downloads/2019-ICD10-Coding-Guidelines-.pdf
- 18.Thompson MP, Luo Z, Joseph G, Burke James F, Adrienne N, Reeves Mathew J. Impact of missing stroke severity data on the accuracy of hospital ischemic stroke mortality profiling. Cardiovasc Qual Outcomes. 2018;11(10):e004951. [DOI] [PubMed] [Google Scholar]
- 19.Gattellari M, Goumas C, Jalaludin B, Worthington J. The impact of disease severity adjustment on hospital standardised mortality ratios: results from a service-wide analysis of ischaemic stroke admissions using linked pre-hospital, admissions and mortality data. PLoS One. 2019;14(5):e0216325. [DOI] [PMC free article] [PubMed] [Google Scholar]
- 20.Fonarow GC, Alberts MJ, Broderick JP, et al. Stroke outcomes measures must be appropriately risk adjusted to ensure quality care of patients: a presidential advisory from the American Heart Association/American Stroke Association. Stroke. 2014;45(5):1589-1601. [DOI] [PubMed] [Google Scholar]
- 21.Introduction to the HCUP national inpatient sample (NIS), 2018 [online]. Accessed January 25, 2021. hcup-us.ahrq.gov/db/nation/nis/NIS_Introduction_2018.jsp
- 22.HCUP-US NIS Overview [online]. Accessed December 26, 2020. hcup-us.ahrq.gov/nisoverview.jsp
- 23.Chang TE, Tong X, George MG, et al. Trends and factors associated with concordance between International Classification of Diseases, ninth and tenth revision, clinical modification codes and stroke clinical diagnoses. Stroke. 2019;50(8):1959-1967. [DOI] [PubMed] [Google Scholar]
- 24.Hamidreza S, Navi Babak B, Grotta James C, et al. Real-world treatment trends in endovascular stroke therapy. Stroke Am Heart Assoc. 2019;50(3):683-689. [DOI] [PMC free article] [PubMed] [Google Scholar]
- 25.Healthcare Cost and Utilization Project (HCUP) NIS notes [online]. Accessed January 29, 2021. hcup-us.ahrq.gov/db/vars/pl_nchs/nisnote.jsp
- 26.Chang H-J, Chen P-C, Yang C-C, Su Y-C, Lee C-C. Comparison of elixhauser and charlson methods for predicting oral cancer survival. Medicine. 2016;95(7):e2861. [DOI] [PMC free article] [PubMed] [Google Scholar]
- 27.Healthcare Cost and Utilization Project (HCUP) NIS notes [online]. Accessed January 26, 2021. www.hcup-us.ahrq.gov/db/vars/hosp_bedsize/nisnote.jsp
- 28.Stein AC, Gaetano JN, Jacobs J, Kunnavakkam R, Bissonnette M, Pekow J. Northern latitude but not season is associated with increased rates of hospitalizations related to inflammatory bowel disease: results of a multi-year analysis of a national cohort. PLoS One. 2016;11(8):e0161523. [DOI] [PMC free article] [PubMed] [Google Scholar]
- 29.Ader J, Wu J, Fonarow GC, et al. Hospital distance, socioeconomic status, and timely treatment of ischemic stroke. Neurology. 2019;93(8):e747-e757. [DOI] [PMC free article] [PubMed] [Google Scholar]
- 30.Gonzales S, Mullen MT, Skolarus L, Thibault DP, Udoeyo U, Willis AW. Progressive rural–urban disparity in acute stroke care. Neurology. 2017;88(5):441-448. [DOI] [PMC free article] [PubMed] [Google Scholar]
- 31.Morgenstern LB, Kissela BM. Stroke disparities. Stroke Am Heart Assoc. 2015;46(12):3560-3563. [DOI] [PMC free article] [PubMed] [Google Scholar]
- 32.Attenello F, Adamczyk P, Wen G, et al. Racial and socioeconomic disparities in access to mechanical revascularization procedures for acute ischemic stroke. J Stroke Cerebrovasc Dis. 2014;23(2):327-334. [DOI] [PMC free article] [PubMed] [Google Scholar]
- 33.Brinjikji W, Rabinstein AA, McDonald JS, Cloft HJ. Socioeconomic disparities in the utilization of mechanical thrombectomy for acute ischemic stroke in US hospitals. AJNR Am J Neuroradiol. 2014;35(3):553-556. [DOI] [PMC free article] [PubMed] [Google Scholar]
- 34.Williams R. Using the margins command to estimate and interpret adjusted predictions and marginal effects. Stata J. 2012;12(2):308-331. [Google Scholar]
- 35.How can I check for collinearity in survey regression? Stata FAQ [online]. Accessed January 26, 2021. stats.idre.ucla.edu/stata/faq/how-can-i-check-for-collinearity-in-survey-regression/
- 36.Meretoja A, Strbian D, Mustanoja S, Tatlisumak T, Lindsberg PJ, Kaste M. Reducing in-hospital delay to 20 minutes in stroke thrombolysis. Neurology. 2012;79(4):306-313. [DOI] [PubMed] [Google Scholar]
- 37.Nasr DM, Brinjikji W, Cloft HJ, Rabinstein AA. Utilization of intravenous thrombolysis is increasing in the United States. Int J Stroke. 2013;8(8):681-688. [DOI] [PubMed] [Google Scholar]
- 38.Albers GW, Marks MP, Kemp S, et al. Thrombectomy for stroke at 6 to 16 hours with selection by perfusion imaging. N Engl J Med. 2018;378(8):708-718. [DOI] [PMC free article] [PubMed] [Google Scholar]
- 39.Akbik F, Hirsch JA, Cougo-Pinto PT, Chandra RV, Simonsen CZ, Leslie-Mazwi T. The evolution of mechanical thrombectomy for acute stroke. Curr Treat Options Cardiol Med. 2016;18(5):32. [DOI] [PubMed] [Google Scholar]
- 40.English JD, Yavagal DR, Gupta R, et al. Mechanical thrombectomy-ready comprehensive stroke center requirements and endovascular stroke systems of care: recommendations from the endovascular stroke standards committee of the Society of Vascular and Interventional Neurology (SVIN). Interv Neurol. 2016;4:138-150. [DOI] [PMC free article] [PubMed] [Google Scholar]
- 41.Schwamm LH, Audebert HJ, Amarenco P, et al. Recommendations for the implementation of telemedicine within stroke systems of care. Stroke. 2009;40(7):2635-2660. [DOI] [PubMed] [Google Scholar]
- 42.de Havenon A, Sultan-Qurraie A, Hannon P, Tirschwell D. Development of regional stroke programs. Curr Neurol Neurosci Rep. 2015;15(5):544. [DOI] [PubMed] [Google Scholar]
- 43.Saadi A, Himmelstein DU, Woolhandler S, Mejia NI. Racial disparities in neurologic health care access and utilization in the United States. Neurology. 2017;88(24):2268-2275. [DOI] [PMC free article] [PubMed] [Google Scholar]
- 44.Marulanda-Londoño ET, Bell MW, Hope OA, et al. Reducing neurodisparity: recommendations of the 2017 AAN diversity leadership program. Neurology. 2019;92(6):274-280. [DOI] [PubMed] [Google Scholar]
- 45.Mittal MK, Manoj K. Mittal R. Healthcare disparity in stroke care. 2021. Accessed January 26, 2021. n.neurology.org/content/healthcare-disparity-stroke-care
- 46.Mendelson SJ, Aggarwal NT, Richards C, O'Neill K, Holl JL, Prabhakaran S. Racial disparities in Refusal of stroke thrombolysis in Chicago. Neurology. 2018;90(5):e359-e364. [DOI] [PMC free article] [PubMed] [Google Scholar]
- 47.Penner LA, Blair IV, Albrecht TL, Dovidio JF. Reducing racial health care disparities: a social psychological analysis. Policy Insights Behav Brain Sci. 2014;1(1):204-212. [DOI] [PMC free article] [PubMed] [Google Scholar]
Associated Data
This section collects any data citations, data availability statements, or supplementary materials included in this article.
Data Availability Statement
The data used in this analysis are publicly available from the Centers for Medicare & Medicaid Services at distributor.hcup-us.ahrq.gov.


