Abstract
Objectives/Hypothesis
To investigate the pattern of intensity levels in images generated by the two most commonly used rigid endoscopes angulations in sinus surgery: 0° and 30°.
Methods
An enclosed light box containing an optical square grid, under endoscope illumination set just below saturation level, was used for measuring light distribution levels across test images. Endoscopes with 0° and 30° angulations were tested at 10 mm from the grid, typical for sinus surgery. The grid was set perpendicular to the axis of the shaft of the endoscope. The grayscale light intensity (GLI) levels (0 = black, 255 = white) in each of the grid squares were quantified from the digitized images.
Results
Light intensity was highly non‐uniform for both endoscopes. The brightest area of the field of view was at the center for the 0° endoscope and at about 20% of the image diameter proximally from the center for the 30° endoscope. For the 0° endoscope with a maximum value of about 230 GLI (90% of white saturation) at the center the minimum value was about 100 GLI at the periphery. The 30° endoscope with a similar maximum GLI value of 226 had a minimum of under 50 GLI at the most distant periphery, too dark for clear grid line definition.
Conclusion
There are wide variations in light intensity across the image circle and much reduced illumination of the field edge. Surgeons should be aware of this fact so that accommodation can be made when surgical manipulation is performed away from the center of the endoscope field. This is especially relevant in angled cavities such as the frontal sinus recess, where the degree of angulation necessitates “edge of field” surgery.
Keywords: endoscope lighting, light intensity distribution, rigid endoscopes
1. INTRODUCTION
Endoscopes are used is all in all disciplines of surgery and clinical examination. In common with many forms of minimal access surgery the rod lens rigid endoscope is used routinely for imaging in endoscopic sinus surgery and is available in a range of different lens angulations, to suit different surgical applications. 1 , 2 , 3
Rigid endoscopes use a wide‐angle lens configuration giving a broad field of view. The integral light fiber array carrying light from the source does not provide even object illumination, with the central region appearing brighter than the edge of the operative field. Although optical distortion in rod lens endoscopes has been investigated and quantified previously, 4 and surgical task performance has been shown to be affected by lens angulation 5 , 6 the variation of light intensity across the operative field has not been reported. The aim of this study was to evaluate the extent of variation in the light intensity displayed by rigid endoscopes of the type commonly used in endoscopic sinus surgery.
2. MATERIALS AND METHODS
Experiments were conducted to measure the light intensity variations in examples of high quality 0° and 30° rigid endoscopes. The models selected were 4 mm diameter, 180 mm long telescopes made by Karl Storz, with model numbers; 7230AA (0°) and 7230BA (30°). These models have a field of view of 80°. They were used with a Storz IMAGE 1 imaging system.
An endoscope testing platform comprised a light box (Figure 1), which included a support for the endoscope, and an optical test grid with 5 mm squares mounted on a rigid frame. The grid lines were black on a white background. The grid served as a means of partitioning the image into defined regions for image intensity analysis. The inner surfaces of the box were painted matt black. All the lighting was supplied by the endoscope's light source. The endoscope was inserted via a 4 mm lens port. A removable lid on the top of the box allowed measurement of the distance from the center of the end of the lens to the grid. A representative operational distance between the endoscope tip and the grid of 10 mm was chosen. The dot in the center of the grid (Figure 2A) shows the visual field center for the 0° endoscope.
FIGURE 1.
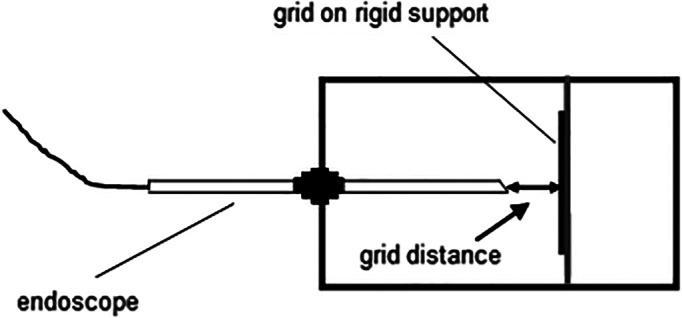
Endoscope light box. The endoscope shaft is held perpendicular to the grid. The internal surfaces of the box are matt black
FIGURE 2.
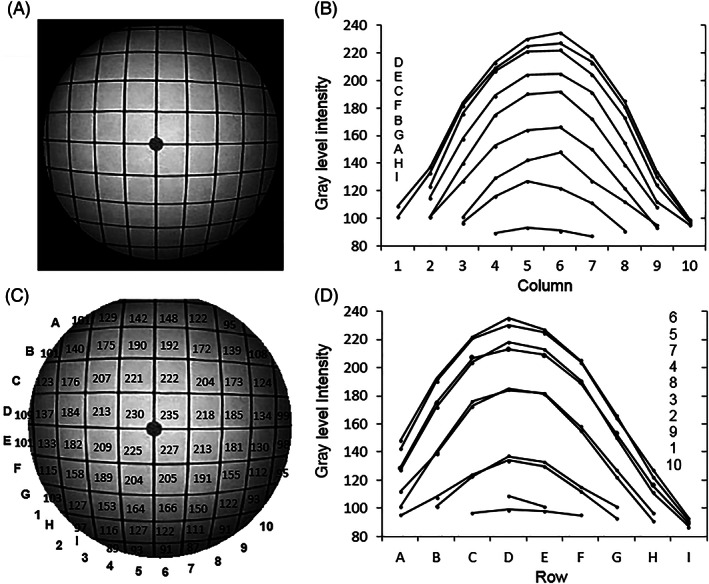
Light intensity distribution for the 0° endoscope. (A) The image; (B) image intensity plots for each row; (C) image intensities at each grid; (D) image intensity plots for each column (the letter and number legends in (B) and (D) correspond to the layout of the individual plots)
The camera zoom on the endoscopes was set so that the viewable image circle of the endoscope just filled the screen. Images of the grid were digitized to a personal computer using a Sony digital video camera, connected to the video out connector of the IMAGE 1 system. The image resolution was 352 × 288 pixels. The brightness of the light source was adjusted manually for each endoscope to give a high and similar maximum image intensity of about 90% of white saturation. This intensity was adjusted until the digital image produced this level. The distribution of light intensity in the image was measured by finding the average GLI within each of the grid boxes, using software written in Matlab (Mathworks Inc., Boston, Massachusetts). Two commonly used methods for contrast enhancement, histogram equalization and contrast‐limited adaptive histogram equalization (CLAHE), were applied to the 30° image to determine the extent to which brightness could be restored to the darker regions. In the first of these methods, the histogram of the intensities in the image is modified to give equal weighting to all intensity levels. The second method operates on small regions of an image to improve local contrast, and it applies a maximum threshold to limit the allowable height of peaks in the histogram to prevent excessive contrast in the small region.
3. RESULTS
The variation of light intensity across the image for the 0° endoscope is plotted in Figure 2. GLI is measured on the normal 8‐bit gray level scale in which 0 represents black and 255 represents white. Figures 2A,C show respectively the image and a larger version with the black background removed to enable the mean GLI value within each grid to be shown. The intensity level was highly non‐uniform across the image circle, ranging from a maximum average value of about 230 GLI for the center grids (D5, D6, E5, and E6), corresponding to about 90% white saturation, to just under 100 GLI at the most peripheral grid regions, the lowest values being at the lower periphery. Figure 2B,D show the increasing drop in intensity differences between adjacent grid squares from the center to the periphery. The GLI values are radially highly symmetrical across the grid columns, less so in the vertical direction.
The corresponding GLI data for the 30° endoscope are shown in Figure 3. The distal window is oriented as shown in Figures 1 and 4, that is, sloping downwards toward the grid. There is a high intensity variation from a maximum of 226 GLI (an average of grids I6 and I7 at about 20% of the image diameter proximally from the center) to 48 GLI at the most distant part of the periphery. The intensity values are shown in white in the upper region of the image circle because the image in this region is too dark to show clearly the values in black. The region with GLI values shown in white conveniently also corresponds approximately to rows with peripheral GLI values that are lower than those at the periphery of the 0° endoscope, which is about 40% of the perimeter of the circle. There is approximate symmetry of image intensity about the central grid columns (6 and 7).
FIGURE 3.
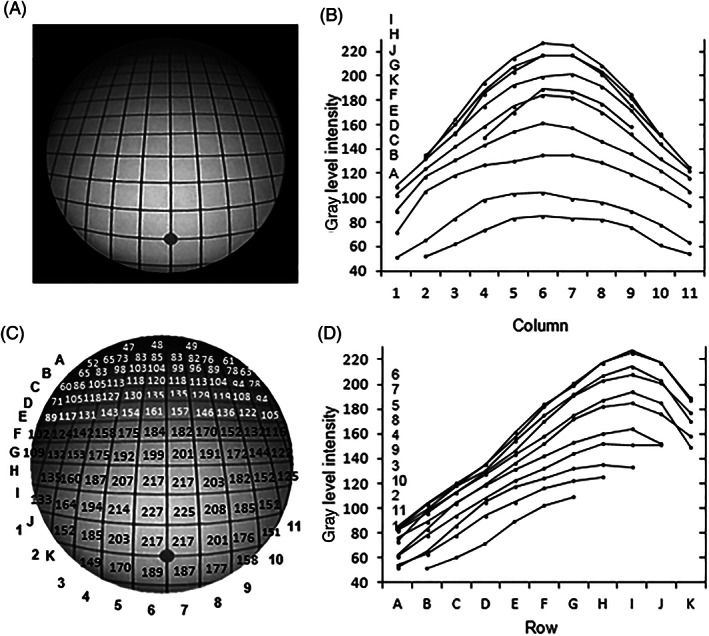
Light intensity distribution for the 30° endoscope. (A) the image; (B) image intensity plots for each row; (C) image intensities at each grid column (shown in black or white for best contrast with the background image); (D) image intensity plots for each column (the letter and number legends in (B) and (D) correspond to the layout of the individual plots)
FIGURE 4.
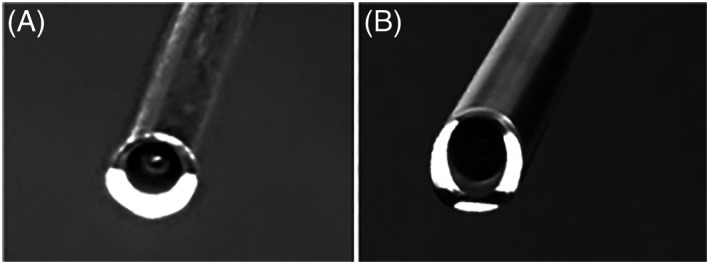
View of end of the endoscopes with illumination on, to show the light delivery regions: (A) the 0° endoscope; (B) the 30° endoscope. The 0° endoscope has one crescent shaped peripheral region and the 30° endoscope has three peripheral regions (the light intensity is set to a low level to show these regions clearly without blooming)
4. DISCUSSION
This study has measured the variation of intensity levels in images obtained from commonly used 0° and 30° rigid endoscopes, by means of a test rig for holding the endoscope shaft in a perpendicular orientation to a flat white surface. The intensity levels are highly non‐uniform over the image in both cases. This lack of uniformity is observed in clinical practice but it has not been measured previously. For the 0° endoscope, the greatest variation is from the center to the periphery, but there is also a noticeable vertical radial asymmetry. This uneven light distribution is attributed to the pattern of the light emerging from the endoscope fiber bundle. The view of the distal end of the 0° endoscope is shown in Figure 4A. The light fibers emerge over a crescent‐shaped area. This shape would be expected to cause some degree of asymmetry in the distribution of light across the image. In addition, to spread light over the field of view, the light has to diverge as it emerges from the tip of the endoscope and it is technically difficult to achieve an even distribution of the resultant beam.
For the 30° endoscope shown in Figure 4B, the light fibers are again asymmetrically distributed at the tip but cover a greater part of a circle than the crescent shape in Figure 4A. Unevenness of light intensity over the field of view would still be expected, but the major effect arises as a result of the 30° angle between the face of the distal end of the endoscope and the plane of the object (the grid). This angle has previously been defined as the relative angle (RA). 4 The effect is illustrated in Figure 5. Compared with the circularly symmetrical field of view in the 0° endoscope, shown in Figure 5A where RA is 0°, the field of view in the 30° endoscope, shown in Figure 5B where RA is 30°, covers a much greater object area and distance with progressively less light reaching the increasingly distant parts of the image. Figure 6A shows that the same 30° RA could be created with the 0° endoscope by rotating the plane of the grid shown in Figure 1 by 30°. The resulting image would appear similar to that in Figure 3. With the grid in this new position a similar image to that in Figure 2 is created for the 30° endoscope, as shown in Figure 6B, the RA again being zero degrees. The darker top periphery in Figure 2 can again be attributed to the light source being less effective in this region.
FIGURE 5.
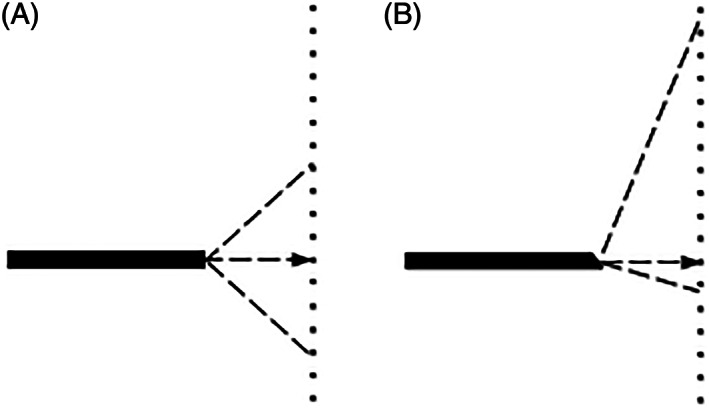
Field of view for: (A) a 0° endoscope; (B) a 30° angled endoscope. The dashed lines show the field of view, which is 80° for both endoscopes. The arrows point to the dot on the grid, which was aligned to be on the axis of the shaft of the endoscope
FIGURE 6.
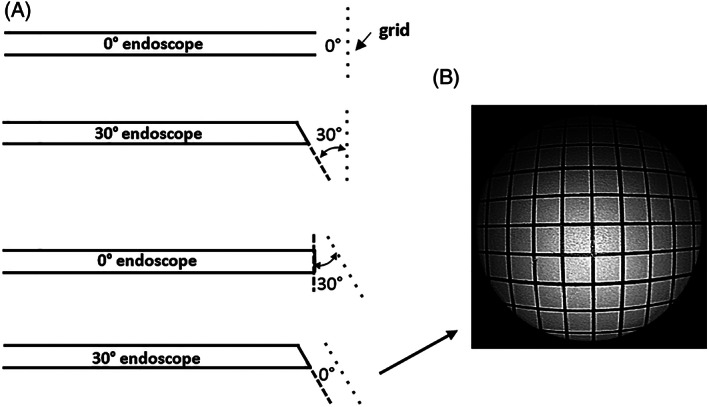
Relative angle (RA). (A) RA values for the 0° and 30° endoscopes at two different grid angles; (B) image from a 30° endoscope with a RA of 0° relative to the grid
The design of endoscopes in which the light from the external source must be transmitted along optical fibers that are peripheral to the centrally located optical pathway for the camera image, means that it is not possible with current technology to have an even source of light emerging from the endoscope. 7 Increasing the illumination to the 30° endoscope by turning up the brightness of the light source to attempt to improve visibility at the periphery of the image can result in an unpleasant glare and saturation of the central region of the image, although this is usually ovedden by the automatic light exposure control of the camera system.
Digital image processing methods could be considered as a means of enhancing the brightness of the darker areas. Examples showing the effect of two basic contrast enhancement methods applied to the 30° endoscope image (excluding the dark background around the circle) are shown in Figure 7. Figure 7A shows the original image. Applying histogram equalization results in Figure 7B. There is an overall quantitative increase in brightness level across much of the image, but it is visibly most noticeable in the central region. The upper part of the periphery remains dark. There is only a small improvement because the original image as a whole already has a high contrast. The more sophisticated CLAHE method aims to improve local contrast in image regions and to limit the effects of locally dominant intensity values. 8 The result, for 256 equally sized regions and a maximum threshold of 95% in the histogram is shown in Figure 7C. The improved visibility at the top periphery of the image circle is at the expense of overall brightness in the image, but the impact on subjective assessment of true surgical images cannot be determined from this study. More sophisticated digital image enhancement methods that operate on color images have also been studied. 9 These algorithms are time consuming to perform and, for modern high definition real time videoendoscopy that transmits more than 370 million color pixels per second, they require exceptionally high computing power using parallel processing methods to work in real time. Digital image processing cannot, of course, recover permanent loss of information in the darker, poor contrast peripheral regions, which increases with the RA.
FIGURE 7.

Digital contrast enhancement of the 30° image: (A) original image; (B) enhancement by histogram equalization; and (C) enhancement by contrast limiting adaptive histogram equalization
The lighting options for these small diameter rigid endoscopes are constrained by the very limited available peripheral space around the central optical fibers that carry the image to the camera. Improvements to the design of the lighting system for rigid endoscopes would be required. For example, the incorporation of an array of miniature LED light sources and optics distally in the endoscope could provide solutions that enable control of light output to give a more uniform light distribution across the visual field than can be achieved with current illumination systems. CMOS camera chip technologies with integrated illumination, which are now incorporated into some flexible endoscopes, offer this opportunity. Given that surgeons will often be using angled telescopes at the edge of the angulation range where the light intensity is lowest, there would be great benefit in new designs of rigid endoscope with improved illumination in these darker regions.
5. CONCLUSION
This study has quantified the variation of light intensity of images from rod lens sinus endoscopes and has shown that there is a highly uneven light distribution across the surgical field. Other rigid endoscopes such as laparoscopes and arthroscopes have the same structure, and are likely to demonstrate similar deficiencies in the illumination pattern. The clinical implication is that surgeons should be aware of the reduced illumination at the periphery of the endoscope image and should control for the difficulty this creates when surgical manipulation is performed away from the co‐axial center of the surgical field. This is especially relevant for surgery in angled cavities such as the frontal sinus recess, where the degree of angulation often necessitates surgery at the edge of the field. As similar endoscopes are used other surgical specialties, it is likely that these findings will be transferrable to other forms of minimally invasive surgery.
CONFLICT OF INTEREST
The authors declare no conflicts of interest.
ACKNOWLEDGMENTS
Institution where work was carried out University of Dundee. This work was undertaken without funding and without any financial relationships.
Abel EW, Fotiadis N, White PS. Light intensity distribution in images from rigid endoscopes used in minimal access sinus surgery. Laryngoscope Investigative Otolaryngology. 2021;6(6):1283‐1288. doi: 10.1002/lio2.703
REFERENCES
- 1. Miranda‐Luna R, Blondel WCPM, Daul C, Hernandez‐Mier Y, Posada R, Wolf D. A simplified method of endoscopic image distortion correction based on grey level registration. Paper presented at: ICIP'04. International Conference on Image Processing; October 24‐27, 2004; 5:3383‐3386.
- 2. Asari KV, Kumar S, Radhakrishnan ID. Technique of distortion correction in endoscopic images using a polynomial expansion. Med Biol Eng Comput. 1999;37:8‐12. [DOI] [PubMed] [Google Scholar]
- 3. Helferty JP, Zhang C, McLennan G, Higgins WE. Videoendoscopic distortion correction and its application to virtual guidance of endoscopy. IEEE Trans Med Imaging. 2001;20:605‐617. [DOI] [PubMed] [Google Scholar]
- 4. Abel EW, Fotiadis N, Miah M, White PS. Defining optical distortion in rigid endoscopes. Laryngoscope. 2014;125:561‐566. doi: 10.1002/lary.24971 [DOI] [PubMed] [Google Scholar]
- 5. Tasman AJ, Stammberger H. Video‐endoscope versus endoscope for paranasal sinus surgery: influence on stereoacuity. Am J Rhinol. 1998;12:389‐392. [DOI] [PubMed] [Google Scholar]
- 6. Kang S, White P, Lee M, Ram B, Ogston S. A randomized control trial of surgical task performance in frontal recess surgery: zero degree versus angled telescopes. Am J Rhinol. 2002;16:33‐36. [PubMed] [Google Scholar]
- 7. Gaertner A, Belloni P. Analysis and simulation of the illumination optics of rigid medical endoscopes. Curr Dir Biomed Eng. 2018;4:169‐172. [Google Scholar]
- 8. Pizer SME, Amburn EP, Austin JD, et al. Adaptive histogram equalization and its variations. Comput Vis Graph Image Process. 1987;39:355‐368. [Google Scholar]
- 9. Okuhata H, Tsutsui H. Application of the Real‐Time Retinex Image Enhancement for Endoscopic Images. Paper presented at: 35th Annual Int Conf of IEEE EMBS, Osaka, Japan; July 3‐7, 2013: 3047‐3410. [DOI] [PubMed]


