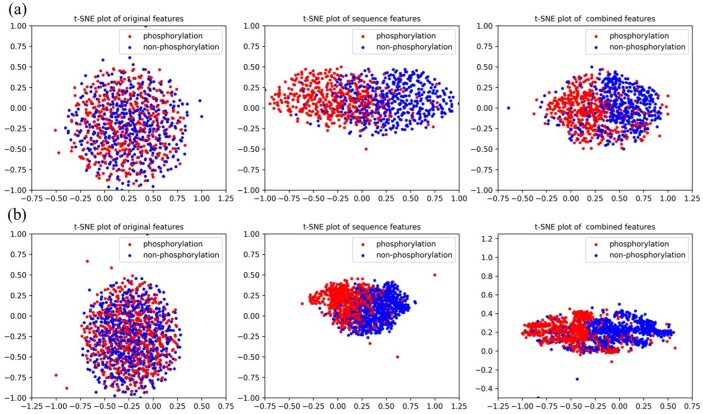
Fig. 3.
Visualization of original one-hot encoding features, sequence features extracted by PhosIDNSeq and combined features extracted by PhosIDN. The red dot represents the phosphorylation sites with kinase annotation belonging to (a) group Atypical or (b) group CAMK, the blue dot represents the non-phosphorylation sites

