Abstract
Background
The present study aimed to use magnetic resonance (MR) to explore the dynamic changes of the ischiofemoral space (IFS) under the triaxial motion of the hip joint and verify the clinical test mechanism for ischiofemoral impingement (IFI).
Methods
A prospective design was used to screen 37 patients with clinically confirmed IFI, which included a total of 67 lateral hips, and 39 healthy controls with a total of 69 lateral hips. A dynamic MR examination was performed in positions designed by a simulated IFI test (adduction, adduction with 30° external rotation, 30° internal rotation, supine with 30° flexion, and prone with 30° backward extension). The IFS (mm) and quadratus femoris space (QFS, mm) were measured in different positions. All the data were evaluated independently by three musculoskeletal radiologists. The differences between the two groups were compared using the two-tailed t-test.
Results
The IFS and QFS in the case group were smaller than those in the control group. The IFS and QFS were significantly reduced in the prone with backward extension and adduction with external rotation positions of the hip. The correlation coefficients of the IFI test and long-stride walking (LSW) test were –0.621 and –0.715 for IFS and –0.653 and –0.696 for QFS, respectively.
Conclusions
In this study, the mechanism of the IFI-specific clinical examination (IFI and LSW tests) was verified by triaxial dynamic MR imaging of the hip joint, which provided a dynamic imaging basis for the clinical application of the IFI-specific impingement test. The IFI impingement test can be used as a specific clinical test for IFI screening.
Keywords: Hip joint, ischiofemoral impingement (IFI), MR, triaxial motion, impingement
Introduction
Ischiofemoral impingement (IFI) is one of the potential causes of posterior hip pain. In 1977, Johnson (1) first reported two cases of persistent groin pain after hip replacement and one case after hip osteotomy, with the symptoms being relieved after the removal of the lesser trochanteric femur. In 2009, Torriani et al. (2) first defined IFI as a painful disease of the hip caused by ischium tuberosity, the narrowing of the femoral lesser trochanteric space, and repeated impingement on the quadratus femoris muscle. In 2020, Konrads et al. (3) reported that after osteotomy of the lower end of the femur, reducing the anterior inclination of the femur could increase the ischiofemoral space (IFS).
IFI is a common disease once thought to be very rare, and it is still not fully understood. Its specific clinical examination methods and pathogenesis therefore need to be further studied. The anatomical structure of the proximal femur and the pelvis, such as the anterior inclination of the femur, femoral neck-shaft angle, lesser trochanter, offset, ischium angle, ischium tuberosity, ischium spacing, hamstring tendon, and quadratus femoris muscle, are related to the disease and form the main parameters of current studies (4-7). Hip instability, pelvic/spinal instability, abductor/adductor imbalance, and other related factors are recent focal points for researchers (8). Injuries, extreme hip motion, iatrogenic diseases, necrosis of the femoral head, and peri-hip tumors are also associated with IFI (9,10).
At present, there are few clinical reports on a specific method for the physical examination of IFI. Gómez-Hoyos et al. (11) reported that the ischiofemoral impingement (IFI) test and the long-stride walk (LSW) test had high accuracy in diagnosing IFI. A meta-analysis (12) showed that magnetic resonance imaging (MRI) is the preferred diagnostic method for evaluating IFI, but there have been no reports on the dynamic changes in the IFS and quadratus femoris space (QFS) observed by MR when combined with the different positions used in clinical impingement tests. The purpose of this study was to simulate the position of the ischium femoral impingement test, observe the changes in the IFS and QFS in hip-joint triaxial movement, and thus verify the mechanism of the clinical ischium femoral impingement test. The study also aimed to further explore the pathogenesis of IFI and provide an image-based approach to the clinical promotion and application of the IFI and LSW tests.
Methods
Materials
The study was conducted in accordance with the Declaration of Helsinki (as revised in 2013). This study was conducted with approval from the Ethics Committee of the Affiliated Hospital of Chengde Medical College (No: LL079). Written informed consent was obtained from all participants.
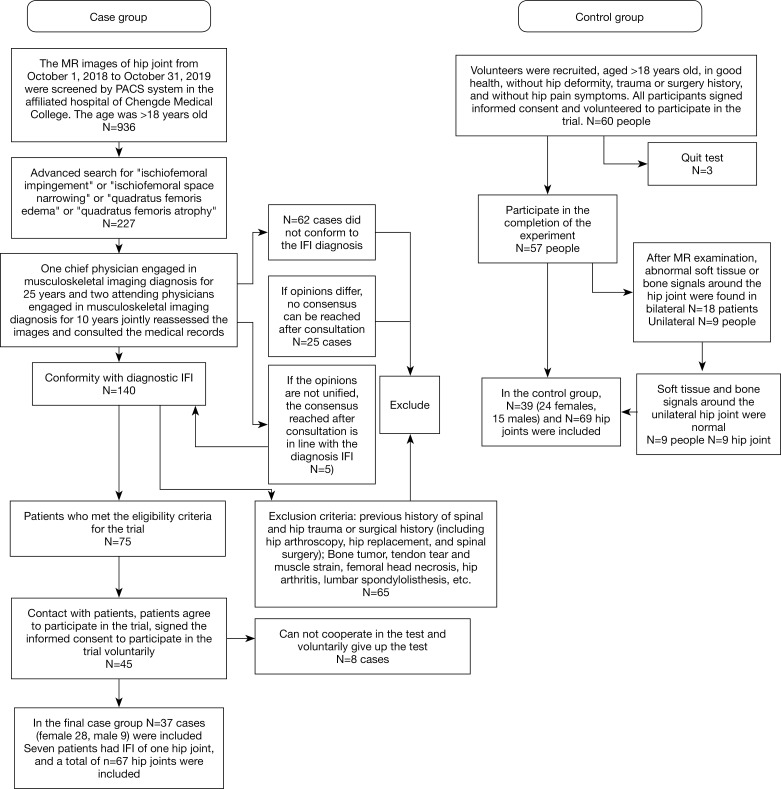
Thirty-seven adult patients (28 females, 9 males) with an average age of 53±10 years (ranging from 29 to 67 years) with symptomatic IFI diagnosed by MR in the Orthopedic and Radiology Departments of the Affiliated Hospital of Chengde Medical College between October 1, 2018, and October 31, 2019, were screened by the PACS system. A total of 67 lateral hips were included in the study. Thirty-nine healthy controls (24 females, 15 males) also participated in the study, with an average age of 47±11 years (ranging from 26 to 73), and a total of 69 lateral hips were included. The MR exam positions were set based on the IFI test: supine with adduction, adduction with 30° external rotation, 30° internal rotation, supine with 30° flexion, and prone with 30° backward extension. This study was approved by the Ethics Committee of the Affiliated Hospital of Chengde Medical College, and all participants signed the informed consent form (see Figure 1).
Figure 1.
Screening flow chart for the case group and control group.
Inclusion criteria for the patients
(I) Patients with deep buttock pain that radiated to the groin, buttocks, and thighs, becoming significant during exercise, with a progression of more than three months; (II) patients with negative lumbosacral results in the spinal examination; (III) patients with at least one positive result in the physical examination using the IFI and LSW tests; (IV) patients with a narrowed IFS and QFS; (V) patients with an MR manifestation of edema or tear of the quadratus femoris muscle, fatty infiltration, or muscle atrophy.
Inclusion criteria for the controls
(I) Subjects >18 years old and with no hip developmental deformity or hip trauma; (II) no symptoms or signs of pain in the hip joint and lower limbs; (III) subjects with no abnormalities in the bone quality of the hip.
Common exclusion criteria
(I) Patients with a previous history of hip trauma or surgery (including hip arthroscopy and hip replacement); (II) patients with other diseases that might cause pain in the deep hip and hip abdominal femoral region, such as bone tumors, tendon tears, muscle strain, ischemic necrosis of the femoral head, hip osteoarthritis, or dynamic mechanical axis instability of the lumbosacral spine.
Scanning parameters and methods
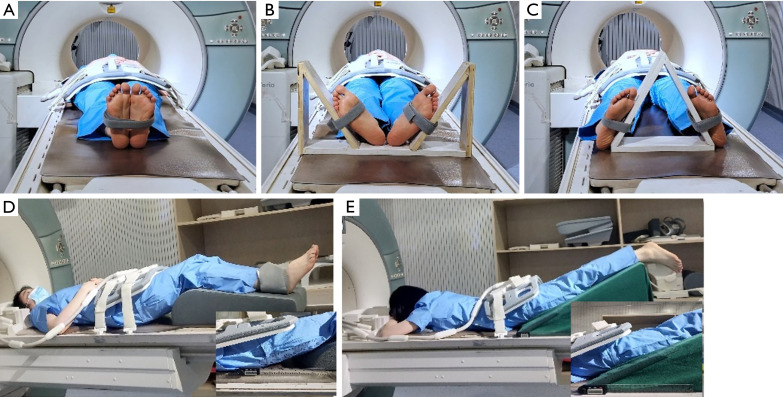
The SIEMENS 3.0T MRI scanner (Magnetom Verio) was used, with the scanning sequence and parameters as follows: transverse axis position T1WI (TR 700 ms, TE 11 ms, FOV 230 mm × 380 mm, slice thickness of 3 mm, and layer spacing of 0.6 mm), transverse axis position T2WI sequence (TR 3,500 ms, TE 87 ms, FOV 230 mm × 380 mm, slice thickness of 3 mm, and layer spacing of 0.6 mm), transverse axis position PDFS sequence (TR 2,800 ms, TE 38 ms, FOV 230 mm × 380 mm, slice thickness of 3 mm, and layer spacing of 0.6 mm). The positions, shown in Figure 2, were the following: supine adduction (legs straight, feet together and perpendicular to the examination table, strap fixed), adduction and external rotation 30° (legs straight, feet together, 30° external rotation with inclined plane fixed to the outside at 30°), 30° internal rotation (legs straight, heels separated to shoulder width, and 30° internal rotation with inclined plane fixed to the inside at 30°), 30° supine flexion (knees and ankles together, hip and knee flexion; a plastic protractor was used to determine the angle between the thigh and the bed at 30°), and the thigh extended back in the prone position (knees, ankles, and feet together, with a 30° beveled wedge pad placed to keep the thigh extended back at 30°).
Figure 2.
Scanning posture maps: (A) shows supine adduction (feet together and perpendicular to the bed surface); (B) shows adduction and outward rotation of 30° (feet together, toe outward rotation of 30°); (C) shows the 30° internal rotation position (foot abduction and shoulder width, toe inward rotation of 30°); (D) shows supine flexion at 30° (hip flexion and knee flexion, thigh and bed surface are 30°); (E) shows 30° back extension in the prone position (knees, ankles, and feet together; 30° back extension of the thighs with a 30° wedge pad on an inclined plane and bed).
Measurement methods and qualitative parameters
Image measurements were performed by a senior physician and two junior physicians in our department. Each physician made a separate measurement, and the average value of the three was calculated as the final result. The IFS and QFS (mm) were measured according to the method established by Torriani (2): the IFS measurement is the smallest distance between the lateral cortex of the ischial tuberosity and medial cortex of the lesser trochanter (minimum distance between the lateral cortex of the ischium tuberosity and the medial cortex of the lesser trochanter of the femur), and the QFS measurement is the smallest distance between the superolateral surface of the hamstring tendons and the posteromedial surface of the iliopsoas tendon or lesser trochanter, which provides space for the passage of the quadratus femoris muscle (minimum distance between the upper lateral surface of the hamstring tendon and the posterior medial surface of the iliopsoas tendon or the quadratus femoris muscle of the lesser intertrochanteric muscle). According to the method described by Tosun et al. (13), the fat replacement and edema classification of the quadratus femoris was observed and graded from 0 to 3 (fat infiltration of the quadratus femoris muscle: grade 1, micro-linear fat signal intensity between muscle fibers; grade 2, thicker and linear spherical fat signal accounts for less than 50% of the quadratus femoris muscle; grade 3, globular fat signal accounts for more than 50% of the quadratus femoris muscle. Edema grade of the quadratus femoris: grade 0, T2-weighted image of quadratus femoris signal normal; grade 1, focal edema measured in the area with the narrowest IFS and QFS values; grade 2, diffuse edema outside the narrowest points of the IFS and QFS but within the muscle; at grade 3, the quadratus femoris muscle edema extends into the surrounding soft tissue). The observation results were tested for consistency within and between the groups. When the result was greater than 0.8, the measurement results were considered to have good consistency within and between the groups. The intraclass correlation coefficient (ICC) test results are shown in Table 1.
Table 1. Three physicians measured IFS/QFS results for conformance tests.
| IFS1 | IFS2 | IFS3 | IFS4 | IFS5 | QFS1 | QFS2 | QFS3 | QFS4 | QFS5 | |
|---|---|---|---|---|---|---|---|---|---|---|
| ICC | 0.975 | 0.961 | 0.990 | 0.939 | 0.981 | 0.975 | 0.983 | 0.989 | 0.979 | 0.977 |
| 95% CI | 0.958–0.985 | 0.946–0.972 | 0.983–0.994 | 0.901–0.963 | 0.969–0.989 | 0.959–0.985 | 0.972–0.990 | 0.982–0.994 | 0.965–0.987 | 0.961–0.986 |
| P | <0.001 | <0.001 | <0.001 | <0.001 | <0.001 | <0.001 | <0.001 | <0.001 | <0.001 | <0.001 |
IFS1 and QFS1 are supine and adductive, IFS2 and QFS2 are adductive and externally pronated at 30°, IFS3 and QFS3 are internally pronated at 30°, IFS4 and QFS4 are hip flexion at 30°, IFS5 and QFS5 are prone and posterior extension at 30°. IFS, ischiofemoral space; QFS, quadratus femoris space; ICC, intraclass correlation coefficient.
Statistical analysis
SPSS 20.0 software was adopted for the data analysis. The measurement data conformed to the normal distribution and were expressed by mean ± standard deviation (). The inter-observer consistency was tested by the ICC test. Two independent sample t-tests were used to compare the IFS and QFS between the IFI case group and the control group. A receiver operating curve (ROC) was drawn, and the area under the curve (AUCs) for each of the different positions was compared to determine the diagnostic threshold. The Spearman analysis was used to analyze the correlation between the IFI test and the IFS and QFS. A two-tailed t-test was adopted, and P<0.05 was considered statistically significant.
Results
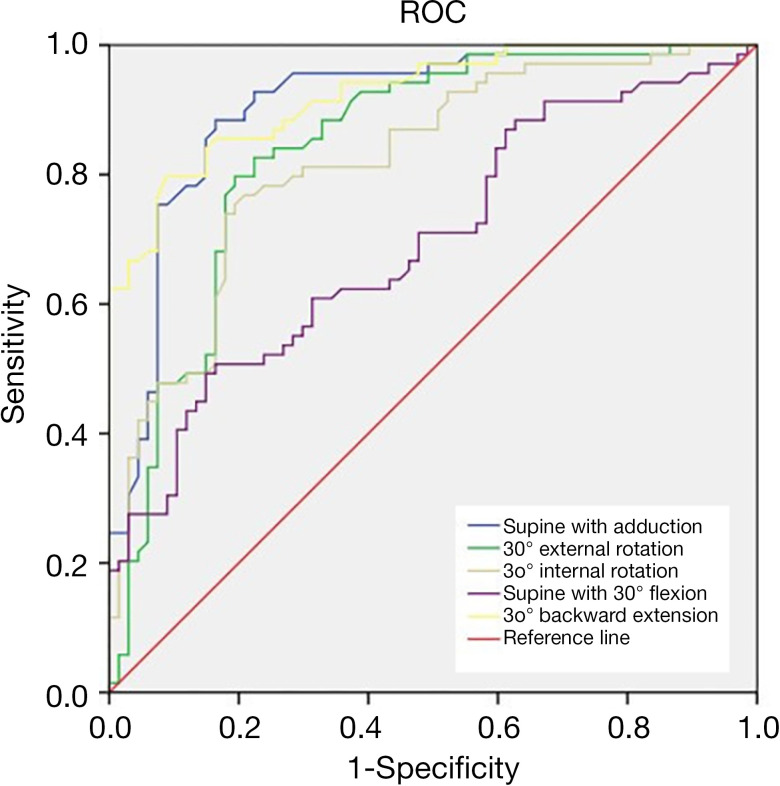
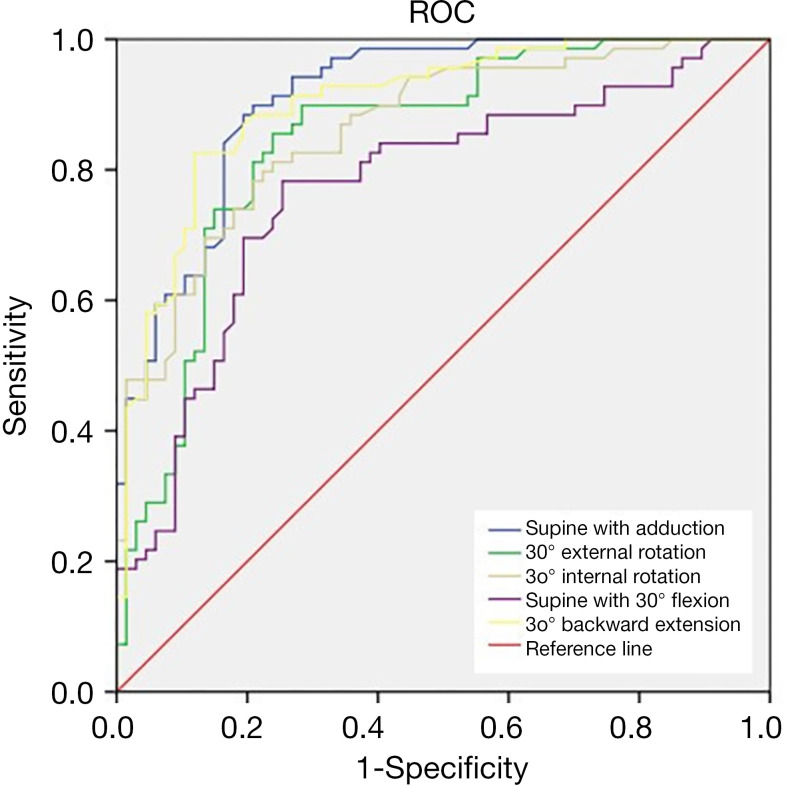
The comparison of the IFS in the IFI test between the case group and the healthy control group is illustrated in Table 2, and that of the QFS is shown in Table 3 (Figures 3,4). The ROC (Figures 5,6) was drawn to obtain the diagnostic threshold for IFI and AUCs in different positions (Table 4).
Table 2. Comparison of the ischiofemoral space (IFS, mm) in different positions between the ischiofemoral impingement case group and the normal control group.
| Groups | Supine with adduction | Adduction with 30° external rotation | 30° internal rotation | Supine with 30° flexion | Prone with 30° backward extension |
|---|---|---|---|---|---|
| Case group | 12.4±3.9 | 10.9±2.9 | 25.1±6.5 | 47.2±6.1 | 8.9±3.4 |
| Control group | 21.0±4.9 | 16.7±6.5 | 33.1±8.8 | 51.9±11.0 | 14.8±4.9 |
| t | –11.07 | –6.86 | –5.96 | –3.07 | –8.25 |
| P | <0.05 | <0.05 | <0.05 | <0.05 | <0.05 |
The difference was statistically significant (P<0.05).
Table 3. Comparison of the quadratus femoris space (QFS, mm) in different positions between the ischiofemoral impingement case group and the normal control group.
| Groups | Supine with adduction | Adduction with 30° external rotation | 30°internal rotation | Supine with 30° flexion | Prone with 30° backward extension |
|---|---|---|---|---|---|
| Case group | 8.5±2.9 | 7.8±2.9 | 17.4±6.4 | 33.3±5.6 | 5.1±2.7 |
| Control group | 14.4±3.9 | 11.9±5.1 | 22.3±6.0 | 37.6±10.2 | 10.6±4.0 |
| t | –9.89 | –5.75 | –5.35 | –3.10 | –9.27 |
| P | <0.05 | <0.05 | <0.05 | <0.05 | <0.05 |
Note: The difference was statistically significant (P<0.05).
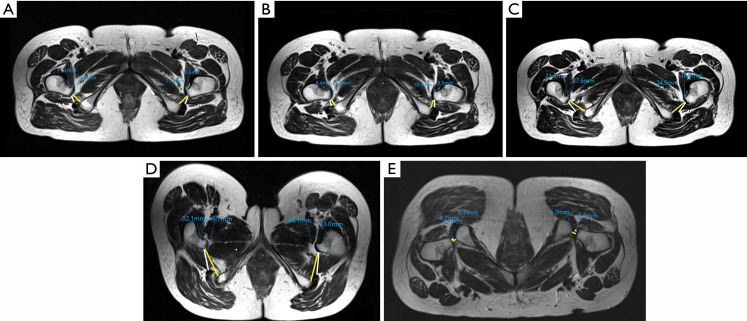
Figure 3.
A 45-year-old female patient with ischiofemoral impingement and posterior hip pain for 6 months: (A) adduction, (B) adduction with 30° external rotation, (C) 30° internal rotation, (D) supine with 30° flexion, (E) prone with 30° backward extension. As shown in the figure, the quadratus femoris was atrophied, the ischiofemoral space (yellow line) and quadratus femoris space (white line) in the backward extension position were at the minimum, and the ischial tuberosity was almost in contact with the femoral tuberosity.
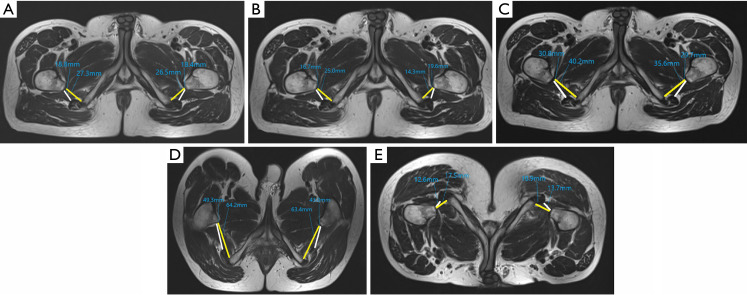
Figure 4.
A healthy 29-year-old male volunteer without hip discomfort: (A) adduction, (B) adduction with 30° external rotation, (C) 30° internal rotation, (D) supine with 30° flexion, (E) prone with 30° backward extension. As demonstrated in the figure, the ischiofemoral space (yellow line) and quadratus femoris space (white line) in the backward extension position were at the minimum, but the space between the ischial tuberosity and the femoral tuberosity still existed and there was no abnormality in the quadratus femoris.
Figure 5.
Ischiofemoral impingement receiver operating curve curves diagnosed by measuring the ischiofemoral space in different MR positions.
Figure 6.
Ischiofemoral impingement receiver operating curve curves diagnosed by measuring the quadratus femoris space in different MR positions.
Table 4. Comparison of the diagnostic threshold, sensitivity, specificity, and AUCs of IFI in different positions.
| Item | Diagnostic threshold (mm) | Susceptibility | Specificity | AUC | 95% confidence interval | |
|---|---|---|---|---|---|---|
| Lower limit | Upper limit | |||||
| IFS | ||||||
| Supine with adduction | <16.0 | 0.884 | 0.806 | 0.909 | 0.862 | 0.957 |
| Adduction with 30° external rotation | <13.5 | 0.783 | 0.791 | 0.862 | 0.801 | 0.922 |
| 30°internal rotation | <28.0 | 0.855 | 0.761 | 0.846 | 0.779 | 0.913 |
| Supine with 30° flexion | <50.2 | 0.783 | 0.746 | 0.773 | 0.693 | 0.853 |
| Prone with 30° backward extension | <12.3 | 0.826 | 0.881 | 0.901 | 0.850 | 0.953 |
| QFS | ||||||
| Supine with adduction | <10.9 | 0.884 | 0.836 | 0.909 | 0.858 | 0.960 |
| Adduction with 30° external rotation | <10.3 | 0.739 | 0.821 | 0.820 | 0.750 | 0.891 |
| 30° internal rotation | <20.0 | 0.797 | 0.806 | 0.842 | 0.773 | 0.910 |
| Supine with 30° flexion | <38.9 | 0.493 | 0.851 | 0.695 | 0.607 | 0.783 |
| Prone with 30° backward extension | <8.8 | 0.797 | 0.910 | 0.923 | 0.880 | 0.965 |
AUC, area under the curve; IFI, ischiofemoral impingement; IFS, ischiofemoral space; QFS, quadratus femoris space.
The consistency test results of the measurement data from the three physicians are shown in Table 1. All the results were >0.8, indicating good consistency in measurement results between observers.
The comparison results of the IFS between the ischiofemoral impingement group and the normal group are set out in Table 2, and the QFS comparison results are shown in Table 3. The results demonstrated that there were differences in the IFS and QFS between the case group and the control group, as follows: in the supine adduction position, the IFS was 12.4±3.9 and 21.0±4.9 mm, respectively, and the QFS was 8.5±2.9 and 14.4±3.9 mm, respectively; for adduction and external rotation at 30°, the IFS was 10.9±2.9 and 16.7±6.5 mm, respectively, and the QFS was 7.8±2.9 and 11.9±5.1 mm, respectively; with internal rotation at 30°, the IFS was 25.1±6.5 and 33.1±8.8 mm, respectively, and the QFS was 17.4±6.4 and 22.3±6.0 mm, respectively; with supine flexion at 30°, the IFS was 47.2±6.1 and 51.9±11.0 mm, respectively, and the QFS was 33.3±5.6 and 37.6±10.2 mm, respectively; with the prone and backward extension at 30°, the IFS was 8.9±3.4 and 14.8±4.9 mm, respectively, and the QFS was 5.1±2.7 and 10.6±4.0 mm, respectively. The results were statistically significant (P<0.05). The IFS and QFS of the case group were lower than those of the normal control group, and the IFS and QFS were different in different positions in each group. The IFS and QFS were significantly reduced during posterior extension and adduction combined with external rotation of the hip joint in the prone position; the IFS and QFS were significantly increased during supine flexion and abduction combined with internal rotation of the hip joint. The IFS was the smallest during the posterior extension of the hip joint in the prone position and the largest during supine flexion.
ROC curves were drawn to obtain the IFI diagnostic thresholds and AUC values in relation to the different body positions (Table 4). The results showed that the area under the ROC curve in the supine adductive position and prone post-extension position was >0.9, indicating high sensitivity and specificity. When IFI was diagnosed in the supine adduction position, the IFS was less than 16 mm, the sensitivity was 0.884, and the specificity was 0.806. When the QFS was less than 10.9 mm, sensitivity was 0.884 and specificity was 0.836. When IFI was diagnosed in the 30° post-extension position, the IFS of the IFI was less than 12.3 mm, the sensitivity was 0.826, and the specificity was 0.881. When the QFS was less than 8.8 mm, sensitivity was 0.797 and specificity was 0.910.
The correlation coefficients between the IFI test, LSW test, and the IFS were –0.621 and –0.715, respectively, while the correlation coefficients between the IFI test, LSW test, and the QFS were –0.653 and –0.696, respectively, showing a significant negative correlation.
Discussion
The most important finding of this study was that there were significant changes in the IFS and QFS when the hip was placed in different positions in the simulated clinical impingement tests. The IFI and LSW tests induced impingement symptoms (i.e., posterior hip pain), and the extension and adduction position showed a smaller IFS and QFS on the MR images. However, the abduction and internal rotation of the symptom-relief position and the forward flexion position showed a large IFS and QFS, and there was a good consistency between the clinical impingement test and the dynamic MRI display of the IFS and QFS. The impingement test is able to indicate the possibility of IFI before an MR examination, which is of important clinical application value.
At present, IFI studies mainly focus on the static and dynamic imaging measurements of relevant parameters, but there are still few specific clinical symptoms and physical examinations established, and even less understanding of IFI-specific clinical trials. No studies linking imaging examinations with clinical impingement tests have yet been reported. Posterior hip pain can be relieved by the resection and remodeling of the lesser trochanter of the femur. Preoperative and postoperative imaging evaluations have revealed an enlarged IFS and QFS, which have become specific indicators for evaluating IFI (1,14). In the present study, it was observed that the IFS and QFS changed dynamically with the change in position. The IFS and QFS were significantly reduced and could reproduce posterior hip pain, and the LSW and IFI clinical examination tests have been designed on this basis (11,15). Patients in the IFI test were lying on their side, and the passive extension and adduction of the symptomatic side of the hip induced pain in the lateral ischium area. Patients in the LSW test experienced pain in the posterior hip in the hyperextension position on the symptom side, and the pain was located in the lateral area of the ischium. The symptoms were relieved with small-stride walking, defined as a positive impingement test, with a sensitivity of 0.94 and a specificity of 0.85. However, there is still limited clinical awareness of these two tests, and the results have not been widely disseminated. Previous imaging studies have observed a reduction in the IFS and QFS in adduction and external rotation and an increase in the IFS and QFS in abduction and internal rotation. Based on the above two tests and related imaging studies, the present study prospectively designed MRI triaxial dynamic multi-body imaging, a simulated IFI and LSW tests, setting adduction to adduction and external rotation at 30°, abduction and internal rotation at 30°, and additional flexion and extension at 30°. MRI scanning was performed, and the results of the study confirmed the original assumptions. It was verified that the IFS and QFS in the positive position in the impingement test decreased in the extension and adduction position, while the IFS and QFS in the forward flexion and internal rotation increased. The IFI and LSW tests were significantly negatively correlated with the IFS and QFS; the smaller the IFS and QFS, the greater the positive possibility of the clinical impingement test. This study showed that the IFS and QFS in the case group were significantly smaller than those in the control group, and the reduction in the posterior extension position was more evident. Symptoms were relieved with abduction and internal rotation or flexion.
Chen et al. (16) reported that the nerves causing posterior hip pain are primarily the sciatic nerve and the nerve branch of the quadratus femoris muscle. When the quadratus femoris muscle is compressed and twisted, it can stimulate the quadratus femoris muscle branch of the sciatic nerve, resulting in posterior hip pain. Studies (2,12,17-19) have shown that IFI is caused by compression of the quadrature femoris muscle, which is significantly reduced by the IFS and QFS. The results of the present study demonstrated that the IFI in the IFS case group and the control group was reduced with adduction and external rotation (10.9±2.9 vs. 16.7±6.5 mm). The widening during abduction and internal rotation (25.1±6.5 vs. 33.1± 8.8 mm) is similar to the results obtained by Finnoff et al. (20) using ultrasound, which demonstrated that the hip joint is constricted during adduction and external rotation, and the IFS is widened during abduction and internal rotation. In this study, the IFS increased in the case group and the control group during anterior flexion of the hip joint (47.2±6.1 vs. 51.9±11.0 mm, respectively). In Johnson et al.’s study (21), the IFS in the supine anterior flexion position of 10 normal volunteers was about 36.9±5.7 mm, which was higher than that in the neutral position. However, two studies (20,21) did not observe changes in the IFS during hip extension. Atkins et al. (22) showed that hip extension had the most obvious effect on the reduction of the IFS, while Lu (23) studied 35 volunteers without hip-pain symptoms using ultrasound and showed that when hip extension was 15°, the male vs. female IFS was 23.9±5.1 vs. 17.7±2 mm, and extension was 30°. When the male vs. female IFS was 21.6±6 vs. 16.7 ±1.7 mm, the IFS extension angle subsequently increased and decreased. In this study, with the IFS extension angle at 30°, after the prone position it was 8.9±3.4 vs. 14.8±4.9 mm in the IFS case group and the control group, respectively, which was significantly reduced during extension. The results of the control group were smaller than those in the Lu study. The possible reason for this difference is that the inspection method is different; Johnson (1) reported that when the IFS was greater than 2 cm, the hip joint could move in three axial planes without impacting the ischium nodules and the lesser trochanter of the femur. The results of this study showed that, in the normal control group, the IFS was less than 2 cm during adduction and external rotation and prone and posterior extension, while in the case group, the IFS was greater than 2 cm during internal rotation and flexion, and there was no standard examination position. The specificity of the MR diagnostic criteria will be affected as a result. At present, two meta-analyses (12,24) have revealed that due to the lack of a standard body position, sex ratio, age, and other influences, there is great heterogeneity in the data, and because of the influence of the IFS and QFS receptor sites, there is a significant difference in the diagnostic threshold. This study showed that both the supine adductive position and prostrate posterior extension position had good sensitivity and specificity, and the AUC value was greater than 0.9. Because the latter patients were less comfortable than the former, two patients in this study were not able to continue and terminated the examination. Zhang et al. (25) also showed that the AUC of the IFS and QFS was the highest in the adductive position. A supine adductive MR examination is therefore recommended as the standard posture for screening IFI.
There were limitations to the present study. The enrolled sample size was small, and the age distribution was large; thus, the results may be biased. The actual motion of the hip joint in the tri-axis is a continuous motion trajectory, and there might be differences between the static image measurements and the functional position measurements. IFI is a multidimensional motion disorder problem and therefore requires more evidence from a larger dataset.
Conclusions
In this study, the mechanism of the IFI-specific clinical examination (IFI and LSW tests) was verified by triaxial dynamic MR imaging of the hip joint, which provided a dynamic imaging basis for the clinical application of an IFI-specific impingement test. The IFI impingement test can be used as a specific clinical test for IFI screening.
Acknowledgments
We are very grateful to Ms. Melanie Tankard for her help in the language of the article.
Funding: None.
Ethical Statement: The authors are accountable for all aspects of the work in ensuring that questions related to the accuracy or integrity of any part of the work are appropriately investigated and resolved. The study was conducted in accordance with the Declaration of Helsinki (as revised in 2013). This study was conducted with approval from the Ethics Committee of the Affiliated Hospital of Chengde Medical College (No: LL079). Written informed consent was obtained from all participants.
Open Access Statement: This is an Open Access article distributed in accordance with the Creative Commons Attribution-NonCommercial-NoDerivs 4.0 International License (CC BY-NC-ND 4.0), which permits the non-commercial replication and distribution of the article with the strict proviso that no changes or edits are made and the original work is properly cited (including links to both the formal publication through the relevant DOI and the license). See: https://creativecommons.org/licenses/by-nc-nd/4.0/.
Footnotes
Conflicts of Interest: All authors have completed the ICMJE uniform disclosure form (available at https://dx.doi.org/10.21037/qims-21-292). The authors have no conflicts of interest to declare.
References
- 1.Johnson KA. Impingement of the lesser trochanter on the ischial ramus after total hip arthroplasty. Report of three cases. J Bone Joint Surg Am 1977;59:268-9. 10.2106/00004623-197759020-00028 [DOI] [PubMed] [Google Scholar]
- 2.Torriani M, Souto SC, Thomas BJ, Ouellette H, Bredella MA. Ischiofemoral impingement syndrome: an entity with hip pain and abnormalities of the quadratus femoris muscle. AJR Am J Roentgenol 2009;193:186-90. 10.2214/AJR.08.2090 [DOI] [PubMed] [Google Scholar]
- 3.Konrads C, Ahrend MD, Beyer MR, Stöckle U, Ahmad SS. Rotation osteotomy of the distal femur influences coronal femoral alignment and the ischiofemoral space. Arch Orthop Trauma Surg 2020. [Epub ahead of print]. doi: . 10.1007/s00402-020-03704-z [DOI] [PMC free article] [PubMed] [Google Scholar]
- 4.Liu K, Li GP, An YS, Zhao YY, Zhao JJ, Zhao F. Dynamic MRI measurement of parameters related to ischiofemoral impact. Journal of Clinical Radiology 2018;37:1703-7. [Google Scholar]
- 5.Zhao YY, Liu K, Li GP. Application of MRI to evaluate the influence of anatomical structure of upper femur on ischiofemoral impingement syndrome. Journal of Clinical Radiology 2019;38:1472-6. [Google Scholar]
- 6.Morris WZ, Fowers CA, Weinberg DS, Millis MB, Tu LA, Liu RW. Hip morphology predicts posterior hip impingement in a cadaveric model. Hip Int 2019;29:322-7. 10.1177/1120700018779906 [DOI] [PubMed] [Google Scholar]
- 7.Gardner SS, Dong D, Peterson LE, Park KJ, Harris JD. Is there a relationship between femoral neck-shaft angle and ischiofemoral impingement in patients with hip pain? J Hip Preserv Surg 2020;7:43-8. 10.1093/jhps/hnaa006 [DOI] [PMC free article] [PubMed] [Google Scholar]
- 8.Kheterpal AB, Harvey JP, Husseini JS, Martin SD, Torriani M, Bredella MA. Hip abductor tears in ischiofemoral impingement. Skeletal Radiol 2020;49:1747-52. 10.1007/s00256-020-03497-7 [DOI] [PubMed] [Google Scholar]
- 9.Di Pietto F, Chianca V, Zappia M, Romano S. Articular and peri-articular hip lesions in soccer players. The importance of imaging in deciding which lesions will need surgery and which can be treated conservatively? Eur J Radiol 2018;105:227-38. 10.1016/j.ejrad.2018.06.012 [DOI] [PubMed] [Google Scholar]
- 10.Rutetzki K, Palm HG, Friemert B, Riesner HJ, Schwarz W, Stuby F, Lang P; und die AG Becken III der DGU® . Avulsion Fractures of the Ischial Tuberosity and Resulting Ischiofemoral Impingement - a Case Report with Literature Review. Z Orthop Unfall 2019;157:308-15. 10.1055/a-0757-8494 [DOI] [PubMed] [Google Scholar]
- 11.Gómez-Hoyos J, Martin RL, Schröder R, Palmer IJ, Martin HD. Accuracy of 2 Clinical Tests for Ischiofemoral Impingement in Patients With Posterior Hip Pain and Endoscopically Confirmed Diagnosis. Arthroscopy 2016;32:1279-84. 10.1016/j.arthro.2016.01.024 [DOI] [PubMed] [Google Scholar]
- 12.Singer AD, Subhawong TK, Jose J, Tresley J, Clifford PD. Ischiofemoral impingement syndrome: a meta-analysis. Skeletal Radiol 2015;44:831-7. 10.1007/s00256-015-2111-y [DOI] [PubMed] [Google Scholar]
- 13.Tosun O, Algin O, Yalcin N, Cay N, Ocakoglu G, Karaoglanoglu M. Ischiofemoral impingement: evaluation with new MRI parameters and assessment of their reliability. Skeletal Radiol 2012;41:575-87. 10.1007/s00256-011-1257-5 [DOI] [PubMed] [Google Scholar]
- 14.Nakano N, Shoman H, Khanduja V. Treatment strategies for ischiofemoral impingement: a systematic review. Knee Surg Sports Traumatol Arthrosc 2020;28:2772-87. 10.1007/s00167-018-5251-5 [DOI] [PMC free article] [PubMed] [Google Scholar]
- 15.Hatem MA, Palmer IJ, Martin HD. Diagnosis and 2-year outcomes of endoscopic treatment for ischiofemoral impingement. Arthroscopy 2015;31:239-46. 10.1016/j.arthro.2014.07.031 [DOI] [PubMed] [Google Scholar]
- 16.Chen ZG, Xie Y. Anatomic study on the innervation of hip joint and its clinical significance. Chinese Journal of Clinical Anatomy 2004;22:565-6. [Google Scholar]
- 17.Goldberg-Stein S, Friedman A, Gao Q, Choi J, Schulz J, Fornari E, Taragin B. Narrowing of ischiofemoral and quadratus femoris spaces in pediatric ischiofemoral impingement. Skeletal Radiol 2018;47:1505-10. 10.1007/s00256-018-2962-0 [DOI] [PubMed] [Google Scholar]
- 18.Barros AAG, Dos Santos FBG, Vassalo CC, Costa LP, Couto SGP, Soares ARDG. Evaluation of the ischiofemoral space: a case-control study. Radiol Bras 2019;52:237-41. 10.1590/0100-3984.2018.0095 [DOI] [PMC free article] [PubMed] [Google Scholar]
- 19.Vicentini JRT, Martinez-Salazar EL, Simeone FJ, Bredella MA, Palmer WE, Torriani M. Kinematic MRI of ischiofemoral impingement. Skeletal Radiol 2021;50:97-106. 10.1007/s00256-020-03519-4 [DOI] [PubMed] [Google Scholar]
- 20.Finnoff JT, Bond JR, Collins MS, Sellon JL, Hollman JH, Wempe MK, Smith J. Variability of the Ischiofemoral Space Relative to Femur Position: An Ultrasound Study. PM R 2015;7:930-7. 10.1016/j.pmrj.2015.03.010 [DOI] [PubMed] [Google Scholar]
- 21.Johnson AC, Hollman JH, Howe BM, Finnoff JT. Variability of ischiofemoral space dimensions with changes in hip flexion: an MRI study. Skeletal Radiol 2017;46:59-64. 10.1007/s00256-016-2508-2 [DOI] [PubMed] [Google Scholar]
- 22.Atkins PR, Fiorentino NM, Aoki SK, Peters CL, Maak TG, Anderson AE. In Vivo Measurements of the Ischiofemoral Space in Recreationally Active Participants During Dynamic Activities: A High-Speed Dual Fluoroscopy Study. Am J Sports Med 2017;45:2901-10. 10.1177/0363546517712990 [DOI] [PMC free article] [PubMed] [Google Scholar]
- 23.Lu B. Evaluation of ischiofemoral space and its influencing factors by ultrasound imaging. He Bei Yi Ke Da Xue, 2015. [Google Scholar]
- 24.Qian L, Wang YN, Liang WJ, Feng ZK, Ma D, OuYang J. Accuracy of the ischiofemoral space in the diagnosis of ischiofemoral impingement syndrome: a meta-analysis. Chinese Journal of Clinical Anatomy 2020;38:97-101. [Google Scholar]
- 25.Zhang P, Yu BH, Shao SY, Chen XS, Zhang YX, Zhao J. Comparative study of different postures of MRI between ischiofemoral impingement syndrome and normal people. Journal of Clinical Radiology 2020;39:1587-91. [Google Scholar]


