

Abstract
Background
All-trans retinoic acid (ATRA), a derivate of vitamin A, has been successfully used as a therapy to induce differentiation in M3 acute promyelocytic leukemia (APML), and has led to marked improvement in outcomes. Previously, attempts to use ATRA in non-APML in the clinic, however, have been underwhelming, likely due to persistent signaling through other oncogenic drivers. Dysregulated JAK/STAT signaling is known to drive several hematologic malignancies, and targeting JAK1 and JAK2 with the JAK1/JAK2 inhibitor ruxolitinib has led to improvement in survival in primary myelofibrosis and alleviation of vasomotor symptoms and splenomegaly in polycythemia vera and myelofibrosis.
Objective
While dose-dependent anemia and thrombocytopenia limit the use of JAK2 inhibition, selectively targeting JAK1 has been explored as a means to suppress inflammation and STAT-associated pathologies related to neoplastogenesis. The objective of this study is to employ JAK1 inhibition (JAK1i) in the presence of ATRA as a potential therapy in non-M3 acute myeloid leukemia (AML).
Methods
Efficacy of JAK1i using INCB52793 was assessed by changes in cell cycle and apoptosis in treated AML cell lines. Transcriptomic and proteomic analysis evaluated effects of JAK1i. Synergy between JAK1i+ ATRA was assessed in cell lines in vitro while efficacy in vivo was assessed by tumor reduction in MV-4–11 cell line-derived xenografts.
Results
Here we describe novel synergistic activity between JAK1i inhibition and ATRA in non-M3 leukemia. Transcriptomic and proteomic analysis confirmed structural and functional changes related to maturation while in vivo combinatory studies revealed significant decreases in leukemic expansion.
Conclusions
JAK1i+ ATRA lead to decreases in cell cycle followed by myeloid differentiation and cell death in human leukemias. These findings highlight potential uses of ATRA-based differentiation therapy of non-M3 human leukemia.
Introduction
Acute myeloid leukemia (AML) is caused by somatic mutations and chromosomal structural abnormalities that trigger arrest of normal cellular differentiation and clonal expansion of immature myeloid cells, leading to ineffective hematopoiesis. All-trans retinoic acid (ATRA), a derivate of vitamin A, is a retinoid that binds to the retinoic acid receptor, causing it to release transcriptional co-repressors and recruit co-activating factors to activate, rather than repress, its regulated target genes. ATRA triggers differentiation in acute promyelocytic leukemia (APML–M3 AML), which is characterized by a fusion between the promyelocytic leukemia gene (PML) and retinoic receptor α (RARA). ATRA together with chemotherapy and then, in combination with arsenic trioxide, has led to marked improvement in outcome for APML patients [1,2,3]. However, attempts to treat non-M3 AML patients with retinoids have been underwhelming [4,5,6], even though the wild-type RARA induced some myeloid differentiation. It has been postulated that this failure in non-M3 AML stems from differences in epigenetic modification [7] as a specific RAR-alpha super-enhancer was found in an estimated 30–45% of non-M3 AML [8]. Addition of a second compound may further push non-M3 AML to fully differentiate.
Common genetic alterations in leukemia can lead to constitutive activation of signal transducer and activator of transcription (STAT) factors, resulting in abnormal proliferative signaling in hematopoietic cells [9, 10]. For example, up to 30% of AMLs harbor internal tandem duplication within the FLT3 receptor tyrosine kinase (FLT3-ITD), which is an activating mutation that drives phosphorylation and STAT5 transcriptional activity that stimulates proliferation [11, 12]. ATRA in combination with inhibition of FLT3 has been investigated and shown to have preclinical activity [13, 14]. INCB52793 is a novel JAK1 specific inhibitor (JAK1i) found to be 100-fold more selective for JAK1 over JAK2. In a screen of small-molecule inhibitors, we initially found that JAK1i, in the presence of all-trans retinoic acid (ATRA), synergistically reduced the proliferation of non-M3 leukemia cells lines. JAK1i alone was responsible for reducing pSTAT5, which is commonly increased in AML and correlates with the aberrant proliferation and decreased apoptosis seen in the disease [9].
We show here that the combination of JAK1i and ATRA suppresses growth of non-M3 AML cells in both in vitro and in vivo models. JAK1 inhibition enhanced the cellular differentiation induced by ATRA treatment. Transcriptomic and proteomic analyses showed signatures of morphological, functional, and maturational changes consistent with differentiation, which were also observed in cell cultures. Combination treatment with JAK1i+ATRA resulted in decreased cell cycle and expansion, with remaining cells exhibiting a less proliferative and functionally mature myeloid profile.
Methods
Cell Lines
AML cell lines MV-4–11, KG-1, K-562, HL-60, and THP-1 were purchased from the American Type Culture Collection (Manassas, VA, USA). The MOLM-13 and Kasumi-1 cell lines were purchased from Deutsche Sammelung von Mikroorganismen und Zellkulturen (Braunschweig, Germany). ATCC and DSMZ cell bank cell lines are authenticated by short tandem repeat profiling and cytochrome C oxidase gene analysis. Cells were used for the experiments presented here within 10–30 passages from thawing. MV-4–11 cell line was grown in in IMDM, and all other cell lines were cultured RPMI and supplemented with 10–20% fetal bovine serum and 100 U/mL penicillin and 100 μg/mL streptomycin. Cells were kept at 37 °C in a 5% CO2 incubator.
Cell-Line Proliferation Assay
Compounds were diluted in DMSO (0.2% DMSO) and dispensed into a 384-well plate using the Echo 555 liquid handler (Labcyte). Following the addition of compounds, cells were pipetted into the 384-well plates at a concentration of between 2000 and 8000 cells per well in IMDM or RPMI media, as noted above, supplemented with 10% FBS and incubated at 37 °C, 5% CO2 in a tissue culture incubator. Plates were incubated for 48 h and cell viability was measured using the Cell TiterGlo reagent (Promega). Percent viability was defined as relative luminescence units (RLU) of each well divided by the RLU of cells in DMSO control. Dose-response curves and the 50% growth inhibition concentration (GI50) values were determined using nonlinear regression analysis (GraphPad Prism version 6.0h).
RNA-Seq
For each sample, 0.75 million cells were resuspended in 1 mL TRIzol, and RNA was isolated according to the manufacturer’s instructions. Samples were submitted to Vanderbilt Technologies for Advanced Genomics (VANTAGE) for polyA-enriched library preparation and sequencing on Illumina NovaSeq. Reads were aligned to hg19 genome using Bowtie2. Cuffdiff (part of Cufflinks software suite) was used to calculate differential gene expression [15]. Gene Set Enrichment Analysis software v3.0 was used to identify gene signatures associated with expression changes [16].
Western Blot
Cells were grown in their respective media before total protein lysates were extracted in laemmli sample buffer (BIO-RAD), sonicated, and boiled at 95 °C for 10 min. The samples were loaded in a 10% sodium dodecyl sulfate polyacrylamide gel (1.67e5 cells/well). Western blot analysis was performed according to standard protocol with antibodies to MCL-1, BCL-2, STAT5, P-Stat5, Myc, Survivin, cCaspase3, cCaspase7, and Actin. Antibodies were obtained from the following sources: MCL-1, STAT5, pStat5, Survivin, cCaspase3 and cCaspase7 (Cell Signaling), BCL-2 (BD Bioscience, R&D systems), Myc (Vanderbilt Antibody Core), and Actin (Sigma-Aldrich).
In vivo Murine Model
All animal studies were conducted in accordance to guidelines approved by the IACUC at Vanderbilt University Medical Center. Female NSGS [NOD/SCID/Tg(hSCF/hGM-CSF/hIL3)] mice 6–8 weeks old were irradiated with 1Gy microwave radiation. After 24 h, mice were injected with 1 × 10⁶ MV-4–11 cells via tail vein injection. After establishing microchimerism, 1–2 weeks post-transplant, mice were treated with 3 mg/kg INCB52793 (Incyte) twice daily by gavage, 5 mg/kg ATRA (Sigma-Aldrich) by daily intraperitoneal (i.p.) injection, the combination, or vehicle. Peripheral blood draws were taken weekly to assess for human chimerism.
Flow Cytometry
For flow cytometry, red blood cells were lysed with EL Buffer on ice (Qiagen), with remaining cells washed and resuspended in 1× PBS with 1% BSA and stained for 15 min with the following antibodies: human CD45-APC, human CD33-PE-Cy7, murine CD45-PE, and DAPI (Biolegend). For cultured cells, MV-4–11 and MOLM-13 were washed in 1× PBS with 1% BSA and stained for 15 min with the following antibodies: CD11b-Fitc, CD38-PE, and DAPI (Biolegend). For annexin/propidium iodide staining, an annexin V apoptosis kit was used as per manufacturer instructions (BD Pharmingen). Cells were washed and submitted for flow cytometric analysis using a 3-laser LSRII (Becton Dickinson).
Immunohistochemistry
Tissues were fixed in 4% paraformaldehyde for 48 h and stored in 70% ethanol before being embedding in paraffin and sectioned at 5 μm. The bone tissue was decalcified prior to being embedded in paraffin. Sections were dewaxed in Xylene and rehydrated in successive ethanol baths. Standard Mayer’s Hematoxylin and Eosin (H&E) staining was performed. Antigen retrieval using a standard pH 6 sodium citrate buffer (BioGenex) was performed and sections were stained with Monoclonal Mouse Anti-Human CD45 (Dako, M0701, dilution 1:200) using M.O.M. Kit (Vector).
Phagocytosis Assay
For detection of phagocytosis, pHrodo Red E. coli-labeled bioparticles were used as per manufacturer’s instructions (Invitrogen). In short, MV-4–11 cells incubated with JAK1i (1 μM), ATRA (5 nM) or a combination of both for 144 h. Live cells were then washed and resuspended in fresh media and incubated with pHrodo E. coli particles for 48 h. After incubation, cells were washed and analyzed by flow cytometric analysis for phagocytic activity.
Clonogenic Assay
The medium for MV-4–11 and MOLM-13 cells were prepared by StemCell Technologies (Vancouver, BC, Canada) according to the manufacturer’s protocol. Cells were incubated with JAK1i (1 μM), ATRA (5 nM) or a combination of both for 6 days at 37 °C. After treatment, cells were washed three times with serum-free RPMI medium and harvested by centrifugation and resuspended in 2% IMDM medium. 500 cells were plated in MethoCult™ GF H4034 medium in 35 mm Petri dishes (Falcon, Cockeysville, MD, USA) in duplicate. Dishes were incubated at 37 °C with 5% CO2 and 95% humidity for 10–14 days. Colonies were scored using an inverted microscope.
Mass Spectrometry
Label-free proteomics were acquired for 10 nM ATRA treated MV-4–11 cells, 100 nM JAK1i treated MV-4–11 cells, and combination of 100 nM JAK1i and 10 nM ATRA treated MV-4–11 cells at five time points (24, 48, 72, 96, and 120 h) after treatment. Mass Spectrometry assay doses were based on drug concentrations showing negligible levels of cytotoxicity. Briefly, the cells were incubated for 24, 48, 72, 96, or 120 h, fixed, and lysed with YY following treatment. The proteomics data was collected on a Q-Xactive Mass spectrometer using MRM, and data were collected per sample for chemical species. This data yielded a total of 82,923 measurements. We further require that each data point was significantly changed relative to control (p value ≤ 0.05, |fold change| ≥ 1.5). This resulted in a total of 4946 significantly changed measurements and a total of 2210 unique chemical species detected across all time points.
Enrichment
Enrichment analysis was performed using MAGINE (https://www.biorxiv.org/content/10.1101/2020.03.02.974121v1). For each condition and time point, data were filtered to have an adjusted p value ≤ 0.05. The data were then grouped into up (fold change ≥ 1.5), down (fold change ≤ 1.5), or absolute (|fold change| ≥ 1.5) regulated sets. These sets were analyzed for enrichment using enrichR. We used the ENCODE_TF_ChIP-seq_2015 gene set for transcription factor enrichment. We used the KEGG_2016, Reactome_2016, and NCI-Nature_2016 gene sets for pathway enrichment.
Enriched terms obtained from enrichR were compressed using the EnrichmentResult.remove_redundant function in MAGINE. This method minimizes the number of terms while maximizing the enrichment across all terms. First, we merged all time points for each term into a set T_i. The terms are ranked according the combined score obtained from enrichR. We iterate from highest score to lowest, keeping terms that have a Jaccard Index distance > 0.7.
Statistics
Unless otherwise noted, data were summarized using the mean (± standard deviation). Per group sample sizes are presented in figures and results reported from two separate experiments, unless stated otherwise. To avoid normality assumptions, pairwise group comparisons were made using the non-parametric Mann–Whitney U test. The distributions of survival were estimated using the method of Kaplan and Meier and group comparisons of survival were conducted using the logrank test. The non-parametric Spearman correlation was used to assess pairwise variable associations. Synergy was summarized using the combination index based on the median effect principle with confidence intervals. ZIP (zero interaction potency) modeling was used to calculate the delta synergy score (δ), which is the average combinatory effect of both drugs over the entire matrix of tested concentrations. Data were analyzed using Graph Pad Prism 6.0 for Windows (GraphPad Software, La Jolla, CA, USA, www.graphpad.com) and R (R Core Team, 2017; R: A language and environment for statistical computing. R Foundation for Statistical Computing, Vienna, Austria. URL https://www.R-project.org/). Significance was listed as *p < 0.05, **p < 0.01, ***p < 0.001.
Results
JAK1i Synergistically Enhances Anti-Proliferative Effect of ATRA in Leukemia Cells
In a screen of AML cell lines, we detected effective decreases in cellular proliferation in the non-M3 AML cell lines MOLM-13, MV-4–11, and THP-1 when treated with INCB52793 (JAK1i) and ATRA. To test for any synergistic action, we employed the Zero Interaction Potency (ZIP) score analysis [17]. ZIP analysis considers the entire dose-response matrix dataset to quantify antagonistic and synergistic doses by combining both Loewe and Bliss modelling theory [17]. ZIP analysis assesses the change in potency of each dose in the dose-response curves between both individual drugs and their combinations. A synergy score is given for each dose combination, and the average of all scores in the matrix is given as an overall ZIP score. Zip scores less than − 10 suggest an antagonistic effect, while scores larger than 10 suggest synergy. Any ZIP scores between − 10 and 10 suggest additive dose effects. The combination of JAK1i and ATRA resulted in synergistic ZIP scores in MV-4–11 and MOLM-13 cells, respectively (Fig. 1A), additional AML cell lines K-562, HL-60, Kasumi-1, and HL-60 resulted in negligible levels of synergy (Supplemental Fig. 1, Online Supplemental Material). We then measured cell growth and apoptosis over a 96-h period in all cell lines. Apoptotic cell death was verified through Annexin V and propidium idodide staining, where Annexin V+/PI- cells are labelled as undergoing early apoptosis, and AnnexinV+/ PI+ cells as undergoing late apoptosis. Cell death staining was greatest in the cell cultures treated with the combination; however, induction of apoptosis was moderate for treatments across all cell lines (Fig. 1B). Cell expansion, reported as live cell number through trypan blue exclusion, was reduced significantly in MV-4–11 and MOLM-13 cells treated with a combination of JAK1i and ATRA (Fig. 1C). To gain further insight into these findings, a Western blot of whole cell lysate was conducted from MV-4–11, the cell line with the highest ZIP score and apoptosis. Analysis revealed decreases in pSTAT5 and survival signals downstream of STAT5 such as MYC and survivin following JAK1i and ATRA. These findings were concomitant with apoptotic signaling through cleaved caspase-3 and 7, which were further enhanced through combination treatment (Fig. 1D). The combination of synergistic ZIP scores, along with decreases in cell expansion under limited apoptosis, led us to pursue studies highlighting potential reasons for decreased growth of cultures under treatment.
Figure 1.
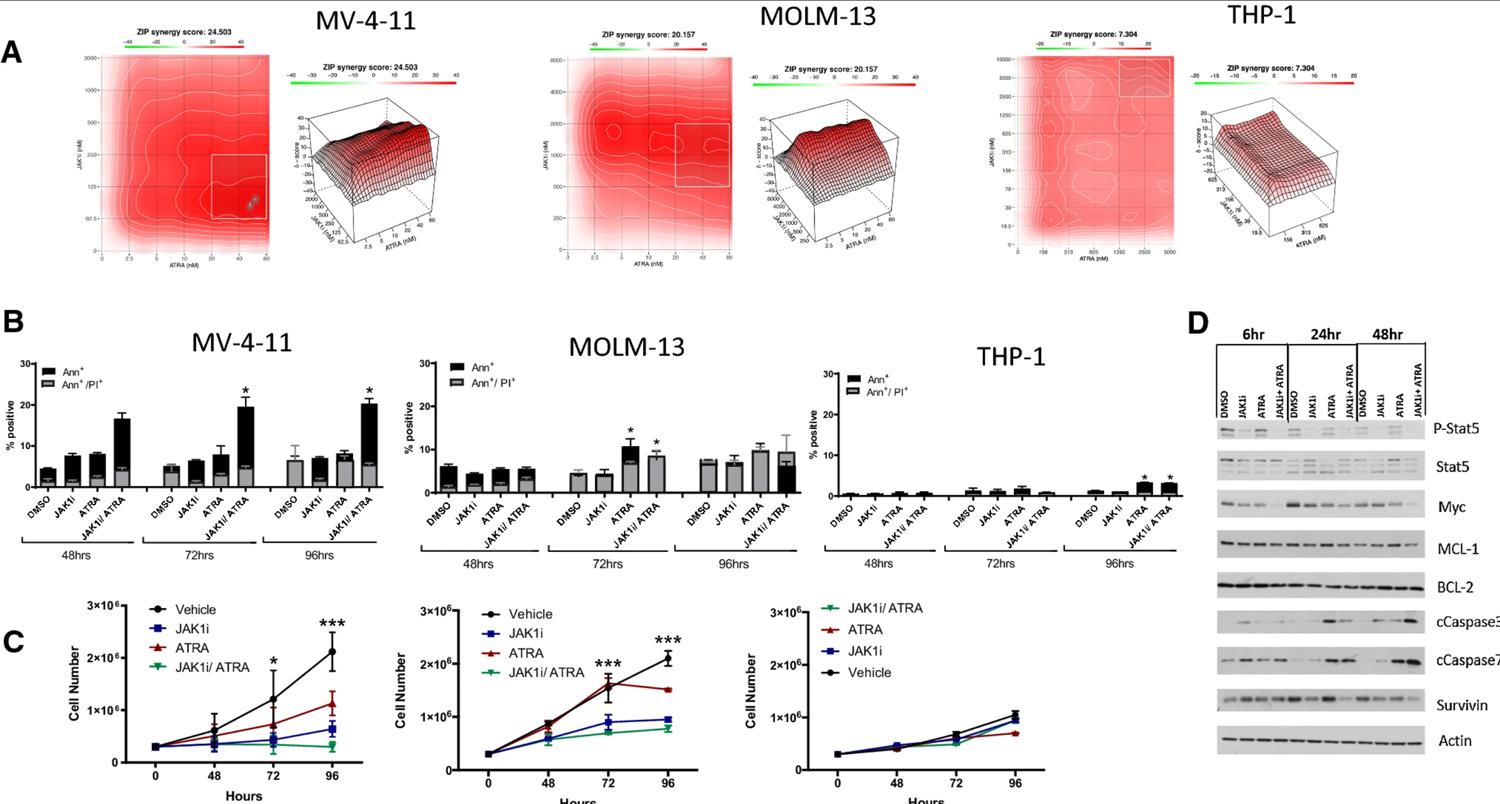
Combination therapy with JAK1i and ATRA reduces acute myeloid leukemia (AML) cell line expansion in vitro. A ZIP synergy analysis of cell lines under treatment with JAK1i and ATRA at 96 h. B Annexin V staining reveals increases in early and late apoptotic cells with treatment up to 96 h, with statistical changes calculated using total Annexin+ cells. C Cell cultures treated with 1 μM JAK1i and 5 nM ATRA reveal decreased expansion under treatment. D, E Lysates from cells treated for 6, 24, or 48 h were probed for signaling and anti-apoptotic proteins and actin by immunoblot. All numerical data in C and D are represented as mean ± s.d. from experiments performed in replicate, n = 3
JAK1i+ATRA Promotes the Differentiation of Human Leukemia In vitro
We used Ki67 positivity staining to verify any decreases in cell cycle noted through the previous changes in cell number noted in Fig. 1C. At 72 h in culture, cell cycling was reduced in MV-4–11 and MOLM-13 cultures treated with JAK1i+ATRA, as evidenced by significant decreases in Ki67 positive cells (Fig. 2A). Furthermore, we used flow cytometry to identify any changes in maturation markers in cells remaining after JAK1i+ATRA treatment. JAK1i+ATRA treated MV-4–11 cells showed increases in myeloperoxidase (MPO) at 48 h (Fig. 2B), consistent with previous descriptions of increases in MPO, specifically during the promyelocytic stage of myeloid maturation [18]. In cells remaining at 144 h, the acquisition of extracellular maturation marker CD38 was noted in MV-4–11 and MOLM-13 cells, and highest in combination treated cells, while CD11b was variably upregulated (Fig. 2C). Given the phenotypic indications of myeloid maturation of JAK1i+ATRA treated MV-4–11 cells, we then tested for functional maturation using an E. coli phagocytic assay. JAK1i+ATRA treated cells exhibited significantly greater phagocytic capacity, confirming a significant increase in MV-4–11 cells with the macrophage phenotype (Fig. 2D). Taken together, these data demonstrate that JAK1i+ATRA has both cytotoxic and differentiating capacities, killing some cells, and aiding in the differentiation of surviving leukemia cells into more mature, functional cells with a lower cycling capacity.
Figure 2.

JAK1i + ATRA-differentiated cells exhibit differentiation and decreased expansion in vitro. A Cell cycling was determined in JAK1i (1 μM) +ATRA (5 nM)-treated cultures through flow cytometric analysis of Ki67-positive cells at 48 h. B Myeloperoxidase (MPO) at 48 h after treatment with JAK1i + ATRA treatment. C Extracellular maturation markers in live cells at 144 h after treatment reveal changes in CD38 and CD11b. D JAK1i + ATRA-treated cells exhibit phagocytic capacity, as shown through the uptake of PHrodo E. coli particles. E Methylcellulose colonies formed from JAK1i + ATRA-treated cells were significantly fewer in number and smaller in size than those from monotherapy-treated cells. All data are shown as mean ± s.d. from experiments performed in replicate, n = 3, unless otherwise noted
JAK1i+ATRA Differentiated Cells Exhibit Decreased Expansion In vitro
Given the reduced cycling and mature phenotype of remaining MV-4–11 and MOLM-13 cells, we evaluated their clonogenic capacity in vitro. MV-4–11 and MOLM-13 cells were treated for 144 h in culture with either JAK1i, ATRA, or JAK1i+ATRA and plated in methylcellulose for 10 days to evaluate colony formation. Colonies formed from JAK1i+ATRA-treated cells were significantly fewer in number in both MV-4–11 (Fig. 2E) and MOLM-13 cells (Fig. 2F).
JAK1i+ATRA Induces a Gene Expression Pattern Consistent with Differentiation
While MV-4–11 cells showed the greatest evidence of functional differentiation, we performed RNA sequencing at 3, 6, and 24 h following single or combination treatment with JAK1i and ATRA to look for any early signs of differentiation. Notably, the combination treatment had a greater effect on gene expression changes than either drug alone. As expected, most of the genes affected by ATRA had increased expression, while inhibiting JAK1i caused more transcript levels to decrease (Online Supplemental Material, Fig. 2). Comparative expression of the top 100 most significantly changed genes reveals the concerted changes attributed to each drug (Fig. 3A). Gene set enrichment analysis revealed that treatment of cells with JAK1i, ATRA, and the combination led to decreases in MYC target genes (Fig. 3B), E2F targets, and genes involved in the G2/M cell cycle checkpoint (Fig. 3C). Further, comparison with two different previously published ATRA-induced differentiation signatures in APML resulted in significant correlations (Fig. 3D) [19, 20]. The ATRA- and JAK1i+ATRA-treated samples were significantly correlated with both up- and down-regulated gene sets from the Martens et al. study [20], while the JAK1i was correlated only with the down-regulated gene set. It appears that the combination treated cells had stronger correlations than the monotherapies. For the Park et al. study [19] signature, only the ATRA- and JAK1i+ATRA-treated samples exhibited a correlation. This suggests ATRA treatment in combination with JAK1i in non-M3 AML affects many of the same targets as ATRA differentiation therapy in M3 AML (Online Supplementary Material, Fig. 3).
Figure 3.

RNA sequencing reveals differentiation programming of treated cells. A Top 100 significantly changed genes at 3, 6, and 24 h post treatment. B, C Gene set enrichment analysis shows decreases in MYC target genes, E2F targets, and genes implicated in G2M cell cycle checkpoint. D Comparisons of gene expression signatures exhibited in ATRA, JAK1i, or JAK1i + ATRA vs. ATRA in APML reveal significant correlations
To further assess the effect of JAK1i+ATRA toward cellular differentiation, we performed unlabeled mass spectrometry on lysates harvested at 24, 48, 72, 96, or 120 h post-treatment with either agent as a monotherapy and in combination. A total of 1,782 proteins were altered by JAK1i, ATRA, or JAK1i+ATRA (Fig. 4A). We further explored the protein expression changes that emerged from the combination treatment, excluding proteins that were altered by both JAK1i and ATRA single-agent treatments, as shown schematically in Fig. 4A. This resulted in 668 total species of interest (Fig. 4A), which we further filtered by requiring a significant change in expression to be present in at least two consecutive time points to ensure that we were evaluating sustained cellular responses across time. This filtering step yielded 126 proteins, shown in Fig. 4B and Online Supplementary Material, Table 1. We next performed enrichment analyses with these 126 proteins, focusing on gene ontology and the reactome and found that proteins within the top ten biological processes were associated with myeloid differentiation (Fig. 4C and Online Supplementary Material, Table 2).
Figure 4.

Mass spectrometry reveals protein expression differences in JAK1i + ATRA-treated cells. Unlabeled mass spectrometry was performed on lysates harvested pre-treatment and at 24, 48, 72, 96, or 120 h post treatment. A Ven diagram representing the number of significantly changed proteins per treatment compared to vehicle and the number of shared protein changes between treatments. All further assessments were performed on 668 proteins, which consisted of the 745 proteins changed in the combination group minus 77 proteins changed by the combination and both monotherapies. B From the 668 proteins of interest, we filtered out those that did not exhibit significant changes in at least two consecutive timepoints. The 126 proteins in this heatmap exhibited significant changes in at least two consecutive time-points, ordered by directionality of change and magnitude of fold change. C Enrichment analysis was performed on the entire set of 126 proteins from B. Top ten enriched pathways are represented along with the proteins associated with those pathways
Interestingly, there were two differentiation effectors that were significantly altered in both RNAseq and proteomic analyses, SPI1 (PU.1) and BCL11A. The transcription factor SPI1, which was up-regulated by the JAK1i+ATRA combination, activates differentiation of myeloid cells into macrophages [21]. BCL11A has been identified as a repressor of myeloid differentiation and is down-regulated upon treatment with JAK1i+ATRA [22, 23].
JAK1i+ATRA Combination Systematically Reduces Leukemic Expansion In vivo
The synergistic effect of JAK1i+ATRA treatment seen in vitro led us to seek validation of this phenomenon in a drug-treated cell line-derived xenograft model. Treatment-naïve MV-4–11 human leukemia cells were injected into sublethally irradiated NSGS mice. Chimerism was established, and mice were subsequently treated days 7–35 post-transplant with ATRA 5 mg/kg, JAKi 3mg/kg, JAKi 3mg/kg+ATRA 5mg/kg, or vehicle. Leukemic engraftment was tracked via weekly flow cytometry. While chimerism within the treatment groups persisted, the combination of JAK1i+ATRA effectively decreased the expansion of leukemic cells peripherally (data not shown). Since this systemic human leukemia model leads to uniform death from leukemia 28–35 days in NSGS mice, all mice were sacrificed for tissue analysis at day 28, when the vehicle control mice exhibited hind-limb paralysis. Hematopoietic tissues were analyzed by flow cytometry for the presence of human leukemic cells. Significant decreases in tumor burden were seen within the spleen and bone marrow of JAK1i+ATRA-treated mice (Fig. 5A). Throughout the duration of the experiments, vehicle and single-treatment group mice incurred weight loss, with combination-treatment mice maintaining a significant body mass in comparison to vehicle by the end of the study (Fig. 5B). Human CD45+ cells were detected via immunohistochemistry (IHC) in bone marrow sections from sacrificed mice (Fig. 5C). JAK1i or ATRA alone did not lead to a significant decrease in leukemia in the bone marrow, whereas the JAK1i+ATRA-treated mice revealed scant staining for leukemia via IHC. In a second MV-4–11 xenograft study, mice were followed until death, and survival was evaluated by Kaplan-Meier analysis (Fig. 5D).
Figure 5.

Combination therapy with JAK1i and ATRA reduces AML expansion in vivo. A Tissues were harvested for chimerism analysis from NSGS mice treated with vehicle (n = 6), 3 mg/kg JAK1i (n = 5), 5 mg/kg ATRA (n = 6), or combination JAK1i+ATRA (n = 6). A non-parametric, unpaired, two-tailed t test was used to calculate significance (mean ± s.d., n = 2). B Weights from mice under treatment from experiments employed in A. C Immunohistochemistry of femurs and spleen (×20) stained with monoclonal antibody for hCD45 reveal residual leukemia cells within the bone marrow and spleen of experimental mice. D Kaplan–Meier analysis from NSGS mice treated with vehicle, 3 mg/kg JAK1i, 5 mg/kg ATRA, or combination JAK1i + ATRA. Statistical significance was calculated using Log-rank (Mantel-Cox) test (n = 5 per arm)
Discussion
ATRA has been a tremendous therapeutic advance in APML. Though its potential in non-M3 AML has not been realized [4,5,6], further mechanistic insight may identify potential treatment strategies or select patient cohorts [8]. Treatment of non-M3 AML with retinoids upregulates RARalpha-regulated genes such as the cell surface antigens CD38 [24, 25]. Thus, while non-M3 AML cells treated with ATRA fail to differentiate and do not undergo apoptosis, they may be “primed” to differentiate or die in the presence of the proper synergistic agent. This is supported by the increase in apoptosis and differentiation seen in non-M3 AML cells treated in vitro through the combination of retinoids with agents such as cytokines, arsenic trioxide, and vitamin D-analogs, and not chemotherapy [26,27,28]. Combining selective inhibitors with ATRA may also have appeal, given, for example, increased activity with ATRA in specific AML clones [13, 14] and differentiation seen with administration of selective inhibitors of AML mutants [29,30,31].
In a recent example, success has been seen when coupling ATRA to drugs inhibiting lysine-specific demethylase 1 (LSD1). Initially, research findings confirmed that the epigenetic programing incurred through inhibition of LSD1 through tranylcypromine (TCP) exposure led to the increased expression of myeloid differentiation genes, allowing for ATRA-driven responses of cellular differentiation. In an in vivo model, AML PDX mice receiving both ATRA and TCP revealed a potent anti-leukemic effect [32]. The concept that LSD1 may be responsible for inhibiting the pro-differentiation effects of ATRA, and that its inhibition may aid greatly in the differentiation therapy under ATRA, gained greater credibility. Following the findings of these and other studies, a phase I/II trial began testing the safety and efficacy of LSD-1 inhibition (TCP) and ATRA in combination as salvage therapy in relapse/refractory AML populations [33]. The trial included 18 patients who were ineligible for intensive treatment. At the close of the trial, overall response rate was 20% with two complete remissions. Of particular interest were the recorded cases of myeloid differentiation noted within the study. Patient samples revealed that the combination of TCP and ATRA could differentiate AML blasts, thereby leading to clinical response [34].
The potential to use other drugs with ATRA is strengthened when considering the presence of specific oncogenic drivers. The JAK/STAT signaling axis is often dysregulated in AML. The findings in our study suggest that JAK1 inhibition and ATRA may be a potential drug combination for differentiation therapy in non-M3 AML. Our findings indicate that this combination effectively shuts down proliferation and initiates differentiation in vitro. In vivo experiments also suggest that JAK1 inhibition in combination with ATRA may hold promise. Inhibition of pSTAT5 with JAK1i INCB52793 led to the decreased cycling and increased differentiation genes in leukemic cells. Given that FLT3-ITD is responsible for constitutive STAT5 signaling, resulting in hyperproliferation and apoptotic suppression, it is possible that MV-4–11 and MOLM-13 exhibited a synergistic effect of JAK1i+ATRA because both cell lines harbor this mutation, while THP-1, K-562, KG-1, Kasumi-1, and HL-60 do not [35,36,37,38,39]. Interestingly, multiple studies have shown that FLT3-ITD AML is correlated with high expression of BCL11A and bad prognosis, and BCL11A has been postulated as a possible target for therapy [23, 40, 41]. Based on our studies, we propose that the inhibition of pSTAT5, achieved by JAK1i and the addition of ATRA, ultimately down-regulates the differentiation suppressor, BCL11A, resulting in subsequent differentiation and synergistic cell death in FLT3-ITD-driven cells. Given that 30% of AML is positive for FLT3-ITD, the possibility of inhibiting this signaling axis through JAK1i without blocking residual JAK2 signaling is of clinical interest. JAK1i+ATRA may be a potential avenue to induce differentiation therapy in non-M3 leukemias, particularly tumors driven via upregulation of STAT5.
Supplementary Material
Key Points.
Dysregulated JAK/STAT signaling is known to drive myeloproliferative neoplasms. While dose-dependent cytopenias limit the use of JAK2 inhibition, selectively targeting JAK1 has been explored as a means to suppress neoplastogenesis. INCB52793 is a novel JAK1 inhibitor found to be 100-fold more selective for JAK1 over JAK2.
Targeting the retinoic acid receptor and JAK1 together synergistically resulted in decreased expansion in AML cell lines in vitro, and preferential reduction of acute myeloid leukemia (AML) cells from the blood, spleen, and bone marrow of treated mice in vivo.
While ATRA is a critical component in the therapy of acute promyelocytic leukemia (M3), it has not been successfully employed in other AML. These data represent a potential for JAK1i+ATRA therapy in non-M3 AML.
Funding
This study was supported by the Incyte Research Institute and the Vanderbilt-Incyte Research Alliance Grant (B. Ferrell, S.Zinkel, J. Irish, C. Lopez, S. Hiebert, M.Savona). M. Savona is a Leukemia and Lymphoma Society Clinical Scholar, and is supported by the E.P. Evans Foundation Discovery Research Grant, the Adventure Allie Discovery Research Fund (M. Savona), the Biff Ruttenburg Foundation (M. Savona), the Beverly and George Rawlings Directorship and the NIH. The Vanderbilt-Ingram Cancer Center is supported by a NIH P30 CA068485–19. The REDCap database tool is supported by grant UL1 TR000445 from NCATS/NIH. The content of this publication does not necessarily reflect the views or policies of the Department of Health and Human Services, nor does mention of trade names, commercial products, or organizations imply endorsement by the U.S. Government.
Conflict of interest
B. Ferrell received research funding for Astex, Forma, and Incyte. S.Zinkel, J. Irish, and C. Lopez received research funding from Incyte. M. Stubbs is an employee of Incyte Research Institute and owns equity in Incyte. S. Hiebert received research support from Incyte through the Vanderbilt-Incyte Research Alliance Grant. M. Savona receives research funding from ALX Oncology, Astex, Incyte, Takeda, and TG Therapeutics; has equity with Karyopharm; serves as an advisory or consultant to AbbVie, Astex, BMS, Celgene, Geron, Incyte, Karyopharm, Ryvu, Sierra Oncology, Taiho, Takeda, TG Therapeutics. Haley E. Ramsey, Kristy Stengel, James C. Pino, Gretchen Johnston, Merrida Childress, Agnieszka E. Gorska, Pia M. Arrate, Londa Fuller, Matthew Villaume, Melissa A. Fischer, Caroline E. Roe, Jing Zou, and Alexander L.R. Lubbock declare that they have no conflicts of interest that might be relevant to the contents of this article.
Footnotes
Availability of data and material
All data generated or analyzed during this study are included in this published article (and its supplementary information files).
Code availability
Not applicable.
Ethics approval
All animal studies were conducted in accordance to guidelines approved by the IACUC at Vanderbilt University Medical Center.
Consent to participate
Not applicable.
Consent for publication
Not applicable.
Contributor Information
Haley E. Ramsey, Cancer Biology Program, Vanderbilt University School of Medicine, Nashville, TN, USA Department of Medicine, Vanderbilt University School of Medicine, Nashville, TN, USA.
Kristy Stengel, Department of Biochemistry, Vanderbilt University School of Medicine, Nashville, TN, USA.
James C. Pino, Department of Biochemistry, Vanderbilt University School of Medicine, Nashville, TN, USA Department of Bioinformatics, Vanderbilt University School of Medicine, Nashville, TN, USA.
Gretchen Johnston, Department of Biochemistry, Vanderbilt University School of Medicine, Nashville, TN, USA.
Merrida Childress, Department of Medicine, Vanderbilt University School of Medicine, Nashville, TN, USA.
Agnieszka E. Gorska, Department of Medicine, Vanderbilt University School of Medicine, Nashville, TN, USA
Pia M. Arrate, Department of Medicine, Vanderbilt University School of Medicine, Nashville, TN, USA
Londa Fuller, Cancer Biology Program, Vanderbilt University School of Medicine, Nashville, TN, USA.
Matthew Villaume, Cancer Biology Program, Vanderbilt University School of Medicine, Nashville, TN, USA; Department of Medicine, Vanderbilt University School of Medicine, Nashville, TN, USA.
Melissa A. Fischer, Cancer Biology Program, Vanderbilt University School of Medicine, Nashville, TN, USA Department of Medicine, Vanderbilt University School of Medicine, Nashville, TN, USA.
P. Brent Ferrell, Jr., Cancer Biology Program, Vanderbilt University School of Medicine, Nashville, TN, USA Department of Medicine, Vanderbilt University School of Medicine, Nashville, TN, USA.
Caroline E. Roe, Department of Cell and Developmental Biology, Vanderbilt University School of Medicine, Nashville, TN, USA Department of Pathology, Microbiology and Immunology, Vanderbilt University School of Medicine, Nashville, TN, USA.
Jing Zou, Department of Medicine, Vanderbilt University School of Medicine, Nashville, TN, USA; Department of Cell and Developmental Biology, Vanderbilt University School of Medicine, Nashville, TN, USA.
Alexander L. R. Lubbock, Department of Biochemistry, Vanderbilt University School of Medicine, Nashville, TN, USA Department of Bioinformatics, Vanderbilt University School of Medicine, Nashville, TN, USA.
Matthew Stubbs, Incyte Research Institute, Wilmington, DE, USA.
Sandra Zinkel, Cancer Biology Program, Vanderbilt University School of Medicine, Nashville, TN, USA; Department of Medicine, Vanderbilt University School of Medicine, Nashville, TN, USA; Department of Cell and Developmental Biology, Vanderbilt University School of Medicine, Nashville, TN, USA; Division of Hematology/Oncology, Vanderbilt-Ingram Cancer Center, Vanderbilt University Medical Center, 777 Preston Research Building, 2200 Pierce Avenue, Nashville, TN, 37232, USA.
Jonathan M. Irish, Department of Pathology, Microbiology and Immunology, Vanderbilt University School of Medicine, Nashville, TN, USA
Carlos F. Lopez, Department of Biochemistry, Vanderbilt University School of Medicine, Nashville, TN, USA Department of Bioinformatics, Vanderbilt University School of Medicine, Nashville, TN, USA.
Scott Hiebert, Department of Medicine, Vanderbilt University School of Medicine, Nashville, TN, USA; Department of Biochemistry, Vanderbilt University School of Medicine, Nashville, TN, USA; Division of Hematology/Oncology, Vanderbilt-Ingram Cancer Center, Vanderbilt University Medical Center, 777 Preston Research Building, 2200 Pierce Avenue, Nashville, TN, 37232, USA.
Michael R. Savona, Cancer Biology Program, Vanderbilt University School of Medicine, Nashville, TN, USA Department of Medicine, Vanderbilt University School of Medicine, Nashville, TN, USA; Vanderbilt Center for Immunobiology, Nashville, TN, USA; Division of Hematology/Oncology, Vanderbilt-Ingram Cancer Center, Vanderbilt University Medical Center, 777 Preston Research Building, 2200 Pierce Avenue, Nashville, TN, 37232, USA.
References
- 1.Montesinos P, Sanz MA. The differentiation syndrome in patients with acute promyelocytic leukemia: experience of the pethema group and review of the literature. Mediterr J Hematol Infect Dis. 2011;3(1):e2011059. [DOI] [PMC free article] [PubMed] [Google Scholar]
- 2.Ades L, Sanz MA, Chevret S, Montesinos P, Chevallier P, Raffoux E, et al. Treatment of newly diagnosed acute promyelocytic leukemia (APL): a comparison of French-Belgian-Swiss and PETHEMA results. Blood. 2008;111(3):1078–84. [DOI] [PubMed] [Google Scholar]
- 3.Sanz MA, Lo Coco F, Martin G, Avvisati G, Rayon C, Barbui T, et al. Definition of relapse risk and role of nonanthracycline drugs for consolidation in patients with acute promyelocytic leukemia: a joint study of the PETHEMA and GIMEMA cooperative groups. Blood. 2000;96(4):1247–53. [PubMed] [Google Scholar]
- 4.Burnett AK, Milligan D, Prentice AG, Goldstone AH, McMullin MF, Hills RK, et al. A comparison of low-dose cytarabine and hydroxyurea with or without all-trans retinoic acid for acute myeloid leukemia and high-risk myelodysplastic syndrome in patients not considered fit for intensive treatment. Cancer. 2007;109(6):1114–24. [DOI] [PubMed] [Google Scholar]
- 5.Estey EH, Thall PF, Pierce S, Cortes J, Beran M, Kantarjian H, et al. Randomized phase II study of fludarabine + cytosine arabinoside + idarubicin +/− all-trans retinoic acid +/− granulocyte colony-stimulating factor in poor prognosis newly diagnosed acute myeloid leukemia and myelodysplastic syndrome. Blood. 1999;93(8):2478–84. [PubMed] [Google Scholar]
- 6.Milligan DW, Wheatley K, Littlewood T, Craig JI, Burnett AK, Group NHOCS. Fludarabine and cytosine are less effective than standard ADE chemotherapy in high-risk acute myeloid leukemia, and addition of G-CSF and ATRA are not beneficial: results of the MRC AML-HR randomized trial. Blood. 2006;107(12):4614–22. [DOI] [PubMed] [Google Scholar]
- 7.Su R, Lin HS, Zhang XH, Yin XL, Ning HM, Liu B, et al. MiR-181 family: regulators of myeloid differentiation and acute myeloid leukemia as well as potential therapeutic targets. Oncogene. 2015;34(25):3226–39. [DOI] [PubMed] [Google Scholar]
- 8.McKeown MR, Corces MR, Eaton ML, Fiore C, Lee E, Lopez JT, et al. Superenhancer analysis defines novel epigenomic subtypes of non-APL AML, including an RARalpha dependency targetable by SY-1425, a potent and selective RARalpha agonist. Cancer Discov. 2017;7(10):1136–53. [DOI] [PMC free article] [PubMed] [Google Scholar]
- 9.Birkenkamp KU, Geugien M, Lemmink HH, Kruijer W, Vellenga E. Regulation of constitutive STAT5 phosphorylation in acute myeloid leukemia blasts. Leukemia. 2001;15(12):1923–31. [DOI] [PubMed] [Google Scholar]
- 10.Zhou J, Bi C, Janakakumara JV, Liu SC, Chng WJ, Tay KG, et al. Enhanced activation of STAT pathways and overexpression of survivin confer resistance to FLT3 inhibitors and could be therapeutic targets in AML. Blood. 2009;113(17):4052–62. [DOI] [PubMed] [Google Scholar]
- 11.Papaemmanuil E, Gerstung M, Bullinger L, Gaidzik VI, Paschka P, Roberts ND, et al. Genomic classification and prognosis in acute myeloid leukemia. N Engl J Med. 2016;374(23):2209–21. [DOI] [PMC free article] [PubMed] [Google Scholar]
- 12.Cancer Genome Atlas Research N, Ley TJ, Miller C, Ding L, Raphael BJ, Mungall AJ, et al. Genomic and epigenomic landscapes of adult de novo acute myeloid leukemia. N Engl J Med. 2013;368(22):2059–74. [DOI] [PMC free article] [PubMed] [Google Scholar]
- 13.Ma HS, Greenblatt SM, Shirley CM, Duffield AS, Bruner JK, Li L, et al. All-trans retinoic acid synergizes with FLT3 inhibition to eliminate FLT3/ITD+ leukemia stem cells in vitro and in vivo. Blood. 2016;127(23):2867–78. [DOI] [PMC free article] [PubMed] [Google Scholar]
- 14.Scholl S, Muller R, Clement JH, Loncarevic IF, Bohmer FD, Hoffken K. ATRA can enhance apoptosis that is induced by Flt3 tyrosine kinase inhibition in Flt3-ITD positive cells. Leuk Res. 2006;30(5):633–42. [DOI] [PubMed] [Google Scholar]
- 15.Trapnell C, Williams BA, Pertea G, Mortazavi A, Kwan G, van Baren MJ, et al. Transcript assembly and quantification by RNA-Seq reveals unannotated transcripts and isoform switching during cell differentiation. Nat Biotechnol. 2010;28(5):511–5. [DOI] [PMC free article] [PubMed] [Google Scholar]
- 16.Subramanian A, Tamayo P, Mootha VK, Mukherjee S, Ebert BL, Gillette MA, et al. Gene set enrichment analysis: a knowledge-based approach for interpreting genome-wide expression profiles. Proc Natl Acad Sci USA. 2005;102(43):15545–50. [DOI] [PMC free article] [PubMed] [Google Scholar]
- 17.Yadav B, Wennerberg K, Aittokallio T, Tang J. Searching for drug synergy in complex dose-response landscapes using an interaction potency model. Comput Struct Biotechnol J. 2015;13:504–13. [DOI] [PMC free article] [PubMed] [Google Scholar]
- 18.Nauseef WM, Olsson I, Arnljots K. Biosynthesis and processing of myeloperoxidase–a marker for myeloid cell differentiation. Eur J Haematol. 1988;40(2):97–110. [DOI] [PubMed] [Google Scholar]
- 19.Park DJ, Vuong PT, de Vos S, Douer D, Koeffler HP. Comparative analysis of genes regulated by PML/RAR alpha and PLZF/RAR alpha in response to retinoic acid using oligonucleotide arrays. Blood. 2003;102(10):3727–36. [DOI] [PubMed] [Google Scholar]
- 20.Martens JH, Brinkman AB, Simmer F, Francoijs KJ, Nebbioso A, Ferrara F, et al. PML-RARalpha/RXR alters the epigenetic landscape in acute promyelocytic leukemia. Cancer Cell. 2010;17(2):173–85. [DOI] [PubMed] [Google Scholar]
- 21.Jego G, Lanneau D, De Thonel A, Berthenet K, Hazoume A, Droin N, et al. Dual regulation of SPI1/PU.1 transcription factor by heat shock factor 1 (HSF1) during macrophage differentiation of monocytes. Leukemia. 2014;28(8):1676–86. [DOI] [PubMed] [Google Scholar]
- 22.Yin J, Xie X, Ye Y, Wang L, Che F. BCL11A: a potential diagnostic biomarker and therapeutic target in human diseases. Biosci Rep. 2019;39(11):BSR20190604. [DOI] [PMC free article] [PubMed] [Google Scholar]
- 23.Yin J, Zhang F, Tao H, Ma X, Su G, Xie X, et al. BCL11A expression in acute phase chronic myeloid leukemia. Leuk Res. 2016;47:88–92. [DOI] [PubMed] [Google Scholar]
- 24.Di Noto R, Lo Pardo C, Schiavone EM, Ferrara F, Manzo C, Vacca C, et al. All-trans retinoic acid (ATRA) and the regulation of adhesion molecules in acute myeloid leukemia. Leuk Lymphoma. 1996;21(3–4):201–9. [DOI] [PubMed] [Google Scholar]
- 25.Yoshida T, Mihara K, Takei Y, Yanagihara K, Kubo T, Bhattacharyya J, et al. All-trans retinoic acid enhances cytotoxic effect of T cells with an anti-CD38 chimeric antigen receptor in acute myeloid leukemia. Clin Transl Immunol. 2016;5(12):e116. [DOI] [PMC free article] [PubMed] [Google Scholar]
- 26.Asou H, Koike M, Elstner E, Cambell M, Le J, Uskokovic MR, et al. 19-nor vitamin-D analogs: a new class of potent inhibitors of proliferation and inducers of differentiation of human myeloid leukemia cell lines. Blood. 1998;92(7):2441–9. [PubMed] [Google Scholar]
- 27.Wang LN, Tang YL, Zhang YC, Zhang ZH, Liu XJ, Ke ZY, et al. Arsenic trioxide and all-trans-retinoic acid selectively exert synergistic cytotoxicity against FLT3-ITD AML cells via co-inhibition of FLT3 signaling pathways. Leuk Lymphoma. 2017;58(10):2426–38. [DOI] [PubMed] [Google Scholar]
- 28.Sanchez PV, Glantz ST, Scotland S, Kasner MT, Carroll M. Induced differentiation of acute myeloid leukemia cells by activation of retinoid X and liver X receptors. Leukemia. 2014;28(4):749–60. [DOI] [PMC free article] [PubMed] [Google Scholar]
- 29.Lu C, Ward PS, Kapoor GS, Rohle D, Turcan S, Abdel-Wahab O, et al. IDH mutation impairs histone demethylation and results in a block to cell differentiation. Nature. 2012;483(7390):474–8. [DOI] [PMC free article] [PubMed] [Google Scholar]
- 30.McMahon CM, Canaani J, Rea B, Sargent RL, Qualtieri JN, Watt CD, et al. Gilteritinib induces differentiation in relapsed and refractory FLT3-mutated acute myeloid leukemia. Blood Adv. 2019;3(10):1581–5. [DOI] [PMC free article] [PubMed] [Google Scholar]
- 31.Yen K, Travins J, Wang F, David MD, Artin E, Straley K, et al. AG-221, a first-in-class therapy targeting acute myeloid leukemia harboring oncogenic IDH2 mutations. Cancer Discov. 2017;7(5):478–93. [DOI] [PubMed] [Google Scholar]
- 32.Schenk T, Chen WC, Gollner S, Howell L, Jin L, Hebestreit K, et al. Inhibition of the LSD1 (KDM1A) demethylase reactivates the all-trans-retinoic acid differentiation pathway in acute myeloid leukemia. Nat Med. 2012;18(4):605–11. [DOI] [PMC free article] [PubMed] [Google Scholar]
- 33.Smitheman KN, Severson TM, Rajapurkar SR, McCabe MT, Karpinich N, Foley J, et al. Lysine specific demethylase 1 inactivation enhances differentiation and promotes cytotoxic response when combined with all-trans retinoic acid in acute myeloid leukemia across subtypes. Haematologica. 2019;104(6):1156–67. [DOI] [PMC free article] [PubMed] [Google Scholar]
- 34.Wass M, Gollner S, Besenbeck B, Schlenk RF, Mundmann P, Gothert JR, et al. A proof of concept phase I/II pilot trial of LSD1 inhibition by tranylcypromine combined with ATRA in refractory/relapsed AML patients not eligible for intensive therapy. Leukemia. 2021;35:701–11. [DOI] [PMC free article] [PubMed] [Google Scholar]
- 35.Spiekermann K, Biethahn S, Wilde S, Hiddemann W, Alves F. Constitutive activation of STAT transcription factors in acute myelogenous leukemia. Eur J Haematol. 2001;67(2):63–71. [PubMed] [Google Scholar]
- 36.Baskiewicz-Masiuk M, Machalinski B. The role of the STAT5 proteins in the proliferation and apoptosis of the CML and AML cells. Eur J Haematol. 2004;72(6):420–9. [DOI] [PubMed] [Google Scholar]
- 37.Fenski R, Flesch K, Serve S, Mizuki M, Oelmann E, Kratz-Albers K, et al. Constitutive activation of FLT3 in acute myeloid leukaemia and its consequences for growth of 32D cells. Br J Haematol. 2000;108(2):322–30. [DOI] [PubMed] [Google Scholar]
- 38.Mizuki M, Fenski R, Halfter H, Matsumura I, Schmidt R, Muller C, et al. Flt3 mutations from patients with acute myeloid leukemia induce transformation of 32D cells mediated by the Ras and STAT5 pathways. Blood. 2000;96(12):3907–14. [PubMed] [Google Scholar]
- 39.Quentmeier H, Reinhardt J, Zaborski M, Drexler HG. FLT3 mutations in acute myeloid leukemia cell lines. Leukemia. 2003;17(1):120–4 [DOI] [PubMed] [Google Scholar]
- 40.Yin B, Delwel R, Valk PJ, Wallace MR, Loh ML, Shannon KM, et al. A retroviral mutagenesis screen reveals strong cooperation between Bcl11a overexpression and loss of the Nf1 tumor suppressor gene. Blood. 2009;113(5):1075–85. [DOI] [PMC free article] [PubMed] [Google Scholar]
- 41.Dong H, Shi P, Zhou Y, Yu Y, Guo X, Yao Y, et al. High BCL11A Expression in Adult Acute Myeloid Leukemia Patients Predicts a Worse Clinical Outcome. Clin Lab. 2017;63(1):85–90. [DOI] [PubMed] [Google Scholar]
Associated Data
This section collects any data citations, data availability statements, or supplementary materials included in this article.