

SUMMARY
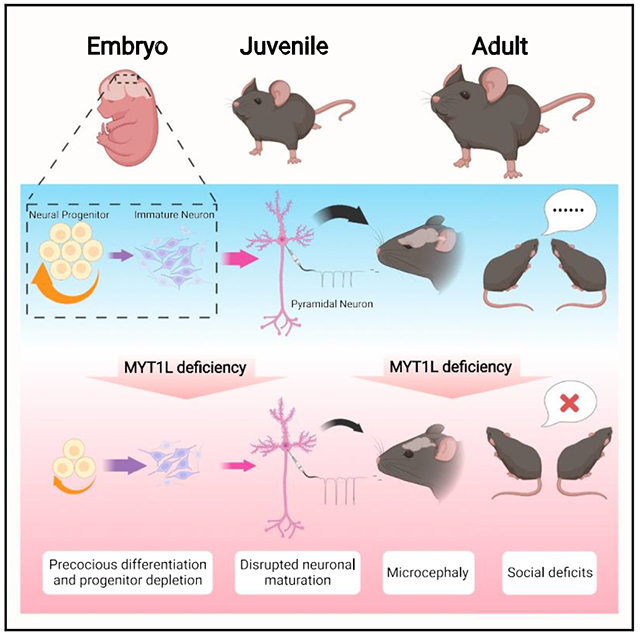
Human genetics have defined a new neurodevelopmental syndrome caused by loss-of-function mutations in MYT1L, a transcription factor known for enabling fibroblast-to-neuron conversions. However, how MYT1L mutation causes intellectual disability, autism, ADHD, obesity, and brain anomalies is unknown. Here, we developed a Myt1l haploinsufficient mouse model that develops obesity, white-matter thinning, and microcephaly, mimicking common clinical phenotypes. During brain development we discovered disrupted gene expression, mediated in part by loss of Myt1l gene-target activation, and identified precocious neuronal differentiation as the mechanism for microcephaly. In contrast, in adults we discovered that mutation results in failure of transcriptional and chromatin maturation, echoed in disruptions in baseline physiological properties of neurons. Myt1l haploinsufficiency also results in behavioral anomalies, including hyperactivity, muscle weakness, and social alterations, with more severe phenotypes in males. Overall, our findings provide insight into the mechanistic underpinnings of this disorder and enable future preclinical studies.
Graphical abstract
In brief
Chen et al. establish the first mouse model of MYT1L syndrome and investigate MYT1L’s function across development in vivo. They show that MYT1L loss of function leads to deficits in cell proliferation, neuronal maturation, and human ADHD/ASD-related behaviors, enabling future preclinical studies for disease therapies.
INTRODUCTION
Mutations in many highly constrained human genes have been associated with intellectual disability (ID) and other developmental disorders (DDs) including autism spectrum disorder (ASD), providing an opportunity to understand their etiology. Many such mutations are chromatin regulators/transcription factors (TFs), such as FOXP1, MECP2, SETD5, and CHD8, and rodent models have been key to defining the CNS consequences of these mutations (Anderson et al., 2020; Gompers et al., 2017; Guy et al., 2001; Katayama et al., 2016; Sessa et al., 2019). Now, recent human genetic studies have shown de novo mutations in another TF, MYT1L, to be strongly associated with ID (Blanchet et al., 2017; de Ligt et al., 2012; Loid et al., 2018; Windheuser et al., 2020) and ASD (De Rubeis et al., 2014; Sanders, 2015; Satterstrom et al., 2018). Clinical series have revealed that most individuals with MYT1L mutations (or deletions of the 2p25.3 region) suffer from ID, with a subset diagnosed with ASD and/or attention-deficit/hyperactivity disorder (ADHD) (Blanchet et al., 2017; Mansfield et al., 2020; Windheuser et al., 2020). Other symptoms include microcephaly, white-matter thinning, obesity, epilepsy, neuroendocrine disruptions, and partially penetrant physical abnormalities (clinodactyly and strabismus). However, histological, cellular, and molecular consequences of germline MYT1L mutation are not yet defined. Furthermore, a better understanding of the function of MYT1L in the developing brain may clarify the pathobiology of this syndrome.
Prior studies, primarily in cell culture, have proposed some molecular and developmental functions for MYT1L. MYT1L is a CCHC zinc finger TF that is highly expressed in the developing brain (Kim et al., 1997; Matsushita et al., 2014; Weiner and Chun, 1997). Early pioneering studies showed that overexpression (OE) of MYT1L, along with BRN2 and ASCL1, is sufficient to reprogram fibroblasts directly into neurons. This indicates that it can, in combination with other TFs, play an instructive role in regulating neuronal differentiation (Pang et al., 2011; Vierbuchen et al., 2010). Chromatin immunoprecipitation sequencing (ChIP-seq) studies in this system indicated that MYT1L binds specific targets. Comparison of these targets with RNA sequencing (RNA-seq) of fibroblasts following MYT1L OE led to the conclusion that MYT1L is a new kind of repressor specifically of non-neuronal genes, thereby restricting cell potential away from non-neuronal fates (Mall et al., 2017). This fits with earlier reports indicating that an isolated central domain of MYT1L can bind the repressor SIN3B (Romm et al., 2005) and that MYT1L can repress gene expression (Manukyan et al., 2018). The related MYT1 gene was shown in the same work to recruit chromatin-closing histone deacetylases. However, work on synthetic reporters showed that MYT1L tended to activate gene expression 4- to 5-fold overall (Jiang et al., 1996; Manukyan et al., 2018), and this could be mapped to the N-terminal domain. Yet although OE of MYT1L in U87 glioma lines both increased and decreased gene expression, the reported MYT1L binding motif (AAA[C/G]TTT) was enriched primarily in promoters of repressed genes, and luciferase activity for three of five endogenous targets showed repression (Manukyan et al., 2018). Thus, whether MYT1L activates gene expression through a different motif or through cooperativity with other TFs is unclear. Furthermore, the direct impact of MYT1L knockdown (KD) or OE on chromatin accessibility has not been assessed.
Although many of the studies have investigated the consequences of MYT1L OE in vitro, most MYT1L variants associated with DD are predicted heterozygous loss-of-function, suggesting haploinsufficiency as the primary mechanism in disease. Yet there is no mammalian system to study the consequences of MYT1L germline haploinsufficiency or complete loss in vivo. Likewise, there have been no comprehensive studies to define the endogenous role of MYT1L in developing and mature brains. Evidence from neuronal differentiation of neural progenitors suggests that rather than only repressing non-neuronal genes, MYT1L is also necessary for activating neuronal genes (Kepa et al., 2017). Specifically, upon short hairpin RNA (shRNA) KD, far more genes were decreased than increased, consistent with loss of an activator, and these corresponded to synaptic proteins that mark neuronal maturation. Indeed, with MYT1L shRNA, neurons failed to mature sufficiently to enable action potentials (Mall et al., 2017). Furthermore, morpholinos in zebrafish followed by in situ hybridization (Blanchet et al., 2017) showed a loss of transcription of two neuropeptides known to express late in maturation (Almazan et al., 1989). Thus, the human brain development phenotypes could be related either to a loss of a repressor (i.e., ectopic expression of non-neuronal genes), as suggested by OE, or to a loss of an activator that promotes neuronal differentiation, as suggested by shRNA. Therefore, determining whether loss of MYT1L results in more opening or closing of chromatin, and the corresponding consequence on gene expression, could inform whether it functions as an activator, a repressor, or both in vivo. Furthermore, characterizing the downstream consequences on brain development, neurophysiology, and behavioral circuit function would provide insight into the conserved roles of this protein and provide a tool for future studies of the disease.
Therefore, we developed a mouse model to understand the consequences of MYT1L mutation in vivo, inspired by a patient with a stop-gain resulting in ID, ASD, and ADHD. We find that MYT1L haploinsufficiency alters chromatin accessibility and corresponding gene expression during development, leading to precocious neuronal differentiation and smaller brains, though without obvious ectopic non-neuronal gene expression. Postnatally, genomic studies reveal a disrupted neuronal maturation, along with electrophysiological abnormalities. Behavioral analysis of these mice revealed clinically relevant muscle weakness and fatigue, obesity, hyperactivity, and social orientation deficits, as revealed by a novel social motivation assay. This new model provides mechanistic insights into MYT1L function in vivo and preclinical opportunities for novel therapeutic development for MYT1L syndrome.
RESULTS
MYT1L is expressed in neuronal lineages across key developmental windows
To establish where MYT1L functions, we first defined its expression across development. First, we looked at temporal expression in mice, to guide spatial expression studies afterward. We found that MYT1L mRNA increased across neurogenesis and peaked on postnatal day (P) 1 but sustained low levels into adulthood (Figure 1A), paralleling human expression (Figure S1A). Furthermore, MYT1L maintained similar protein levels from embryonic day (E) 14 to P1 and then declined (Figure 1B).
Figure 1. MYT1L frameshift mutation results in protein haploinsufficiency, physical anomalies, and obesity.
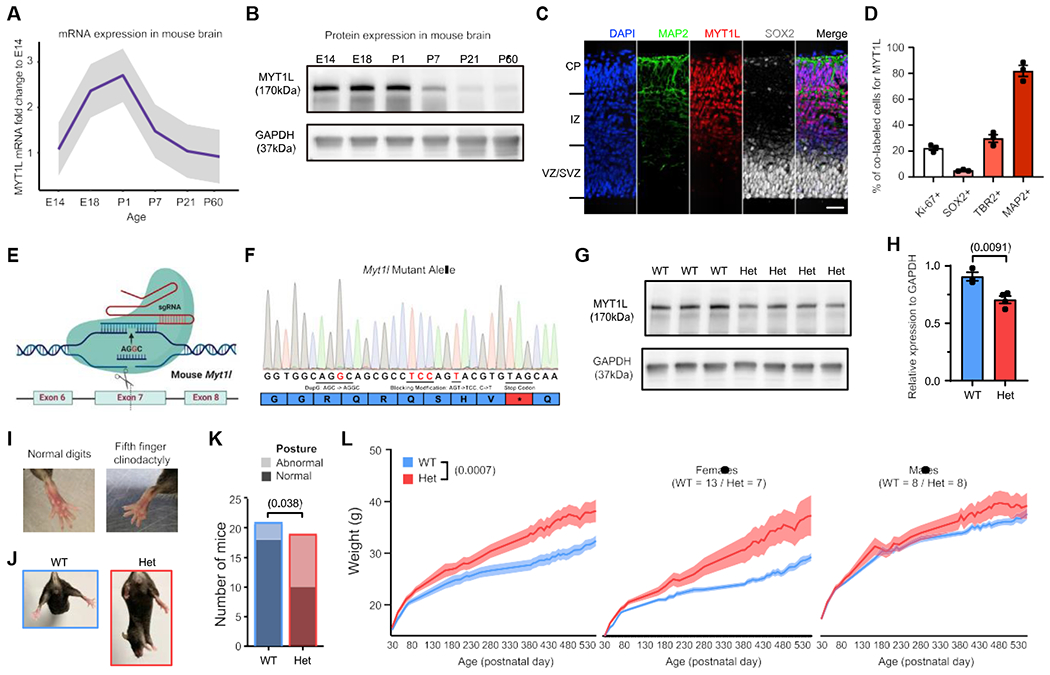
(A) qRT-PCR revealed the trajectory of MYT1L mRNA expression across mouse brain development (n = 3).
(B) Western blot showed a parallel trajectory of protein levels.
(C) IF of MYT1L protein (red) revealed expression in MAP2+ (green) cortical plate (CP), intermediate zone (IZ), and a few in SOX2+ (white) progenitors in the ventricular zone (VZ)/subventricular zone (SVZ). Scale bar, 50 μm.
(D) Quantification of MYT1L+ fraction within different cell types (n = 3).
(E) Schematics for MYT1L-KO mouse line generation.
(F) Sanger sequencing of c.3035dupG mutation on MYT1L mutant allele.
(G and H) Western blot on P1 whole brain lysates confirmed MYT1L protein reduction in Het mice.
(I–K) On physical examination, a subset of Het mice displayed (I) fifth finger clinodactyly and (J and K) abnormal hindlimb posture.
(L) Het mice weighed significantly more than WT mice as adults, which was more pronounced in females.
Data are represented as mean ± SEM. See also Figure S1 and Table S5 for statistical test details.
Initial spatial studies highlighted expression in new neurons of the developing brain (Kim et al., 1997), with an absence in glia. In contrast, a recent report proposed expression in oligodendroglia, promoting their fate (Shi et al., 2018). To resolve this inconsistency, we next investigated MYT1L’s cellular expression. Immunofluorescence (IF) during peak cortical neurogenesis (E14), with a knockout (KO)-validated MYT1L antibody (Figure S1J), revealed MYT1L’s gradient of expression in the cortex and medial ganglionic eminence: almost absent in the progenitor layers (SOX2+) and highest in the upper cortical plate (CP; MAP2+; Figures 1C, 1D, S1B, and S1C), mirroring prior studies (Kim et al., 1997; Matsushita et al., 2014; Weiner and Chun, 1997). This parallels neuronal maturation gradients, with dim intermediate zone (IZ; TBR2+) expression, where immature neurons are found, and strongest expression in CP. In neonates, MYT1L was expressed in BRN2+ and CTIP2+ postmitotic neurons and a small portion of SOX2+ radial glia, but not in OLIG2+ oligodendroglia (Figures S1D and S1E). In adults, MYT1L was expressed in NeuN+ neurons across all regions examined (Figures S1F and S1G). MYT1L was not found in GFAP+ astrocytes or OLIG2+ oligodendroglia (Figure S1H). Collectively, our expression studies indicate that MYT1L’s function commences concurrently with final proliferation of neuronal progenitors, and its expression in all postmitotic neurons implies that MYT1L haploinsufficiency potentially influences any neuron type. Furthermore, the timeline suggests a peak function during neuronal maturation but does not rule out a sustained role in adult neurons.
Generation and characterization of Myt1l-KO mice
Germline mutants of Myt1l would enable studies of its role in CNS development, its function on chromatin, gene expression, and the cellular, physiological, and behavioral phenotypes of haploinsufficiency. Therefore, we generated mice with a mutation on exon7 (chr12:29849338, c.3035dupG, S710fsX; Figure 1E), on the basis of a MYT1L patient mutation in the homologous exon 10 (Table S1), resulting in frameshift and a predicted stop-gain (Figure 1F). As we found Myt1l homozygous mutant (KO) mice die at birth, we confirmed that Myt1l transcripts and protein decreased by 25% in heterozygous mice (Het; Figures 1G, 1H, and S1K), and IF showed complete MYT1L protein loss in KO E14 mouse cortex (Figure S1J). No truncated protein (~80.63 kDa) was produced by the mutation (Figure S1I). Further sequencing of the cDNA from Hets revealed a depletion of the mutant mRNA compared with genomic controls, consistent with nonsense-mediated decay (Figure S1L). Thus, this mutation appears to result in haploinsufficiency.
Next, we assessed mice for physical abnormalities reported in patients. We observed clinodactyly (Figure 1I) and abnormal hindlimb posture: transient hyperflexions of one or both hindlimbs (Figures 1J and 1K), reflected not in clasping but in holding limb(s) at midline. Finally, we also observed obesity in Hets. There was an initial separation of group weights at P45 that became statistically significant at P94 and was more pronounced in females than males (Figure 1L). Thus, Myt1l mutation results in physical alterations and obesity in mice and humans.
MYT1L haploinsufficiency results in microcephaly and thinned white matter
Almost half of patients have CNS malformations such as microcephaly, hydrocephalus, and thinned white matter. Therefore, we investigated structural abnormalities in P60 Hets using Nissl staining (Figures 2A and 2B). Brain organization was grossly normal, yet Hets had decreased brain weight and smaller cortical volume (Figures 2C and 2D), with no change in cortex/brain ratio (Figure S2A). Regarding white matter, there was a trend toward reduced corpus callosum volume (Figure S2B). In addition, there was no cell density change (Figure S2C), indicating that microcephaly in Hets corresponds to fewer cells rather than less parenchyma. We next investigated mouse brains using magnetic resonance (MR)-based diffusion tensor imaging (DTI), a more sensitive, in vivo, clinically translatable technique that can provide both structural and functional information (Figure 2E). From maps of apparent diffusion coefficient (ADC; Figure S2D) and fractional anisotropy (FA; Figure 2F), we segmented several brain regions and performed three-dimensional (3D) reconstruction (Figures 2G, S2E, and S2F). By MR, Hets again had smaller brain volumes, with no size change in the ventricular system (Figures 2H and S2G). With segmentation of FA maps (Figures 2F and 2G), Hets had a smaller corpus callosum volume (Figure 2I). Functionally, FA values were unchanged in white matter and cortex, suggesting that remaining axons were normal (Figure S2H). Lack of MYT1L expression in oligodendroglia (Figures S1E and S1H) suggests that the decrease in white matter reflects a loss of axons rather than oligodendroglial dysfunction (e.g., dysmyelination). Overall, Myt1l mutation results in both decreased brain size and smaller specific white-matter tracts.
Figure 2. MYT1L haploinsufficiency causes microcephaly and white-matter thinning in corpus callosum.
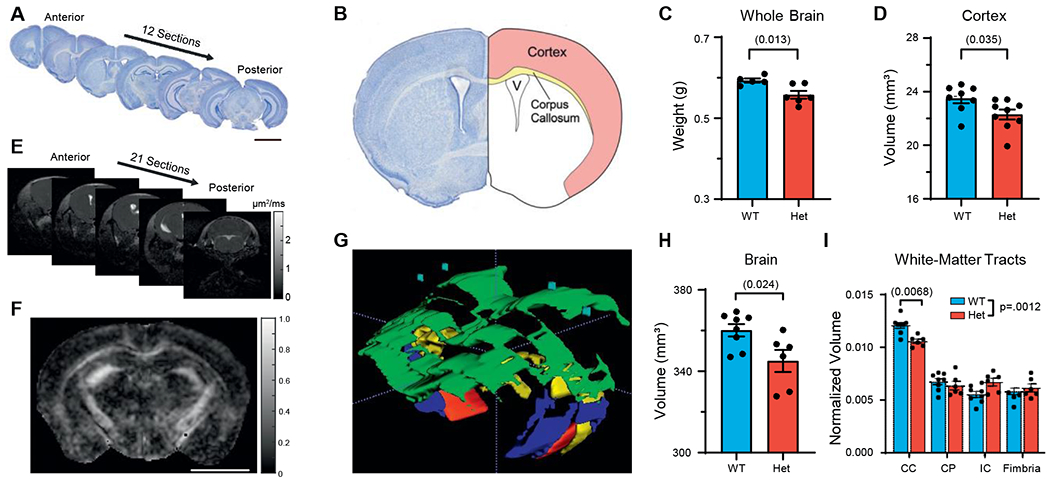
(A) Sectioning strategy for Nissl staining. Scale bar, 3 mm.
(B) Diagram of different brain structures examined.
(C and D) Adult Het mice had decreased brain weight (C) and (D) decreased cortical volume.
(E) Coronal images acquired from DTI.
(F) Fractional anisotropy (FA) map for visualization of white-matter tracts. Scale bar, 0.5 cm.
(G) Three-dimensional reconstruction of different white-matter tracts via FA maps, including corpus callosum (CC; green), cerebral peduncle (CP; red), internal capsule (IC; blue), fimbria (yellow), and cortex (blue).
(H) DTI recapitulated smaller brain phenotype in Het mice.
(I) Histogram showed adult Het mice had decreased corpus callosum volume. Data were normalized to brain volume.
Data are represented as mean ± SEM. See also Figure S2 and Table S5 for statistical test details.
MYT1L loss alters chromatin state during early mouse brain development
We next conducted genomic studies in the developing brain to (1) determine the function of MYT1L in the embryonic brain and (2) understand the developmental deficits that might cause adult structural phenotypes. We focused on E14, when MYT1L begins expression (Figure 1), to leverage previous ChIP-seq analysis from E13.5 (Mall et al., 2017) to examine the consequences of MYT1L loss at direct binding targets. At E14, we could also assay KO brains, which may further potentiate any molecular phenotypes.
First, we performed assay for transposase accessible chromatin sequencing (ATAC-seq) (Figure S3A) to determine how MYT1L loss alters chromatin accessibility. MTY1L is thought to modulate chromatin (Romm et al., 2005), with OE studies highlighting a repressive role (Mall et al., 2017). We sought here to determine if it has the same role during normal brain development. We identified 1,522 (false discovery rate [FDR] < 0.05, 3,630 FDR < 0.1; Table S2) differentially accessible regions (DARs) in mutant cortex (Het and KO), with 871 less accessible DARs (Figures 3A and S3A–S3C) and 641 more accessible DARs (Figures 3B, S3A, S3D, and S3E). Interestingly, KO mice showed smaller changes than Hets in terms of DARs decreasing accessibility after Myt1l mutation (Figures 3A and S3A). Motif analysis of DARs revealed that regions losing accessibility in mutants were enriched for motifs of stem cell TFs (Lhx2, Sox2), as well as the key neurogenic TF Ascl1 (Figure 3C). More accessible DARs are enriched for motifs of pro-differentiation TFs (NF-1 and Olig2; Table S2). A Gene Ontology (GO) analysis of DARs located in transcriptional start sites (TSSs) (Table S4) revealed that less accessible TSSs were enriched for cell cycle and neurogenesis pathways (Figure 3D).
Figure 3. Chromatin accessibility and RNA-seq analysis define molecular consequences of MYT1L loss in the developing brain.
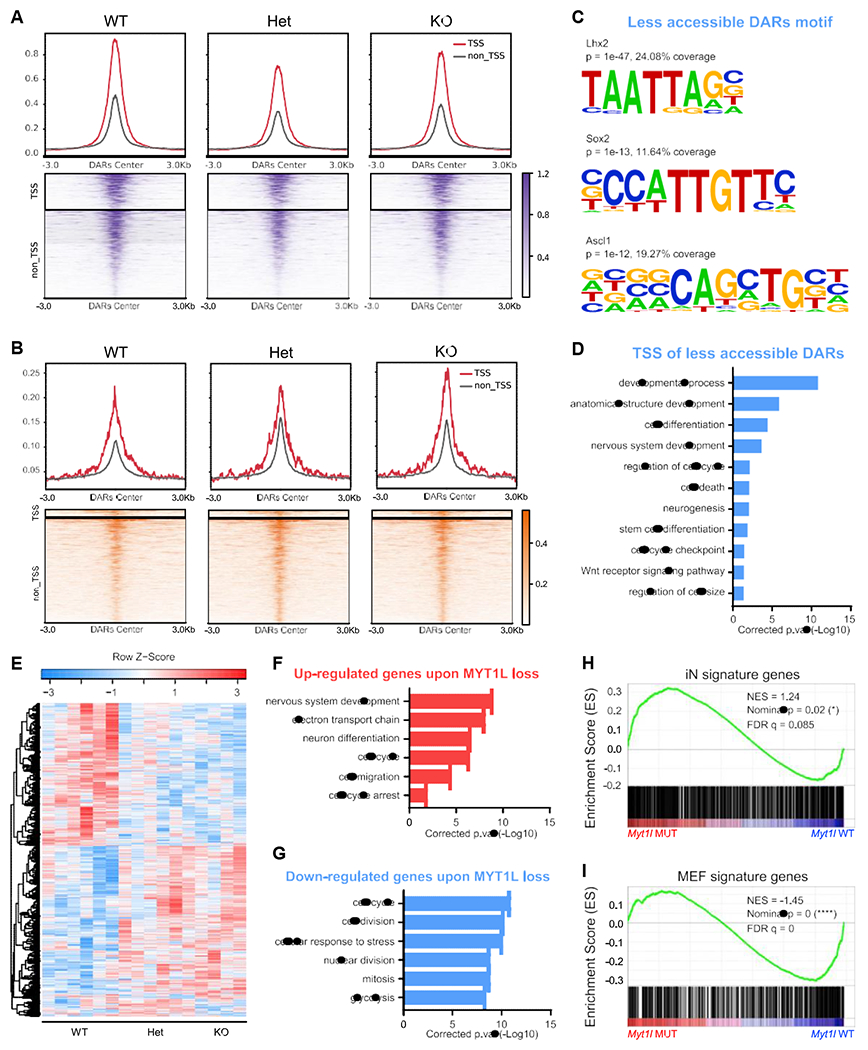
(A and B) Less accessible (A) and (B) more accessible regions in MYT1L mutant E14 mouse cortex identified by ATAC-seq (FDR < 0.1).
(C) Homer motif analysis of less accessible DARs over more accessible DARs.
(D) GO analysis of less accessible DARs associated genes showed the disruption of neurodevelopmental programming in mutants.
(E) Heatmap for differential gene expression in mutants (FDR < 0.1).
(F and G) GO analysis of DEGs revealed an upregulation of early neuronal differentiation pathways (F) and (G) a downregulation of cell proliferation programs.
(H and I) GSEA analysis revealed iN signature genes increased expression (H), while (I) MEF genes decreased expression in mutants cortex.
See also Figure S3 and Table S5 for statistical test details.
Second, we examined MYT1L binding targets defined from E13.5 brain and reprogrammed fibroblasts (Mall et al., 2017). We found that MYT1L loss decreased the accessibility of bound regions (Figure S3F), suggesting the loss of an activator. Also, there were more ChIP targets overlapped with less accessible DARs than more accessible DARs (χ2[1, N = 203] = 11.48, p = 0.0007), further supporting that MYT1L functions to open chromatin during CNS development. However, only a small subset of ChIP targets were DARs (3.62% of 6,652 ChIP peaks). Thus, chromatin accessibility changes in mutants can be attributed to both direct and indirect effects. In sum, MYT1L loss alters chromatin accessibility, including directly bound targets, which likely leads to dysregulated neurodevelopmental gene expression (Figure 3D).
MYT1L loss alters gene expression during early mouse brain development
To understand the transcriptional consequences of this altered chromatin, we conducted RNA-seq on E14 mouse cortex. We identified 1,768 of 13,846 differentially expressed genes (DEGs; Figures 3E and S3G–S3J; Table S3). Fold changes of DEGs correlated well between Het and KO datasets. However, unlike ATAC-seq, in which KOs had smaller effects, there are larger DEG fold changes in KOs than Hets (Figures S3K and S3L). This is consistent with a dose dependence for MYT1L transcriptional regulatory activity.
Decreased gene expression can be caused by TSS closure, so we plotted the ATAC-seq fold changes of TSS for all DEGs. Indeed, there was a concordance between ATAC-seq TSS and RNA-seq changes (Figure S3M). In addition, unlike in neuronal reprogramming, in which MYT1L OE mostly suppressed the expression of ChIP-seq targets, those targets showed subtle decreased expression in E14 RNA-seq upon MYT1L loss (Figures S3N and S3O). Generally, there is no correlation between our mutant fold changes and prior RNA-seq of MYT1L OE in MEF or KD fold changes in cultured neurons (Mall et al., 2017; Figures S3R and S3S). We also categorically defined “in vitro MYT1L-repressed” genes (downregulated by OE, upregulated by KD) and “in vitro MYT1L-induced” genes (upregulated by OE, downregulated by KD). We found that downregulated genes from our in vivo RNA-seq included 33 in vitro MYT1L-induced genes from cultures (p < 0.0005). However, our upregulated genes did not show significant overlap with MYT1L-repressed genes (Figures S3T and S3U). Collectively, the loss of expression of MYT1L target genes in vivo indicates that MYT1L functions preponderantly as an activator during early brain development. This is distinct from the repressor of non-neuronal lineage function reported in direct conversion by OE or KD in vitro (Mall et al., 2017). Specifically, we observed no de-repression of the previously described non-neuronal lineage genes with MYT1L mutation (Figure S3P).
Next, as adult structural abnormalities can be attributed to deficits during development, we examined the gestalt of the RNA-seq using GO analysis (Table S4). There was an upregulation of CNS development pathways (Figure 3F) in mutants, driven by markers of neuronal differentiation, suggesting early differentiation in mutants. Likewise, using gene set enrichment analysis (GSEA), we discovered a downregulation of mouse embryonic fibroblast (MEF) genes and upregulation of induced neuron (iN) genes in E14 mutants (Figures 3H and 3I), indicating that mutant cortex shifted profiles toward early neuronal differentiation. This was further supported by GSEA of pre-defined “mid-fetal” and “early fetal” genes from the human brain, with mid-fetal genes precociously upregulated in mutants (Figures S3V and S3W), opposite to the expression pattern of Chd8 mutants, who have macrocephaly rather than microcephaly (Katayama et al., 2016). We also looked at Wnt and Notch signaling pathways suppressed by MYT1L in OE studies (Mall et al., 2017). However, we found no significant categorical upregulation in our Myt1l mutants (Figures S3X and S3Y). Surprisingly, MYT1L loss also affected cell cycle pathway genes, with inhibitors (e.g., Rb1, Gas1) upregulated and mitosis genes (e.g., Mcm7, Cdca5) downregulated (Figures 3F and 3G; Table S2). We further compared gene expression between Het and KO mice and found a further upregulation of genes associated with chromatin activation in KOs (e.g., Setd2, Dpf3; Figure S3Q). Overall, the results suggest that MYT1L mutation leads to precocious early neuronal programs and perturbs proliferation programs in embryos.
MYT1L loss impairs cell proliferation in developing mouse cortex
Precocious neuronal differentiation could reduce the progenitor pool and thus reduce cell production, resulting in a smaller brain. To validate the prediction from RNA-seq that MYT1L loss affects cell differentiation and proliferation, we first stained cell-stage markers in the E14 cortex (Figure 4A). We found that KOs have decreased apical progenitor (AP, SOX2+) density with normal intermediate progenitor (TBR2+) and postmitotic neuron (TBR1+) density compared with Het and WT mice (Figures 4C–4E and S4A–S4C). After normalizing SOX2+ cells to total cell number, there was still a trend toward fewer SOX2+ cells in KOs (Figure S4A; p = 0.0528), indicating that smaller AP density can be independent of decreased total cell number (Figure 4B). We also found the ratio of TBR2+/SOX2+ but not TBR1+/TBR2+ was increased in mutant mice (Figures S4D and S4E). Overall, we saw a shift from early cell fate (SOX2+) to late cell fate (TBR2+/TBR1+) in Myt1l mutants (Figure 4F), supporting the hypothesized precocious cell differentiation. Proliferating cells (Ki-67+) were also decreased in KOs (Figures 4G–4I), suggesting MYT1L loss affects cell proliferation. Therefore, we performed EdU labeling experiments to measure proliferation rates (Figure 4J). We found that both Het and KO cortices have significantly fewer EdU+ cells (Figure 4K), highlighting slower proliferation rate in the mutant developing cortex.
Figure 4. MYT1L loss disrupts progenitor proliferation by precocious cell-cycle exit.
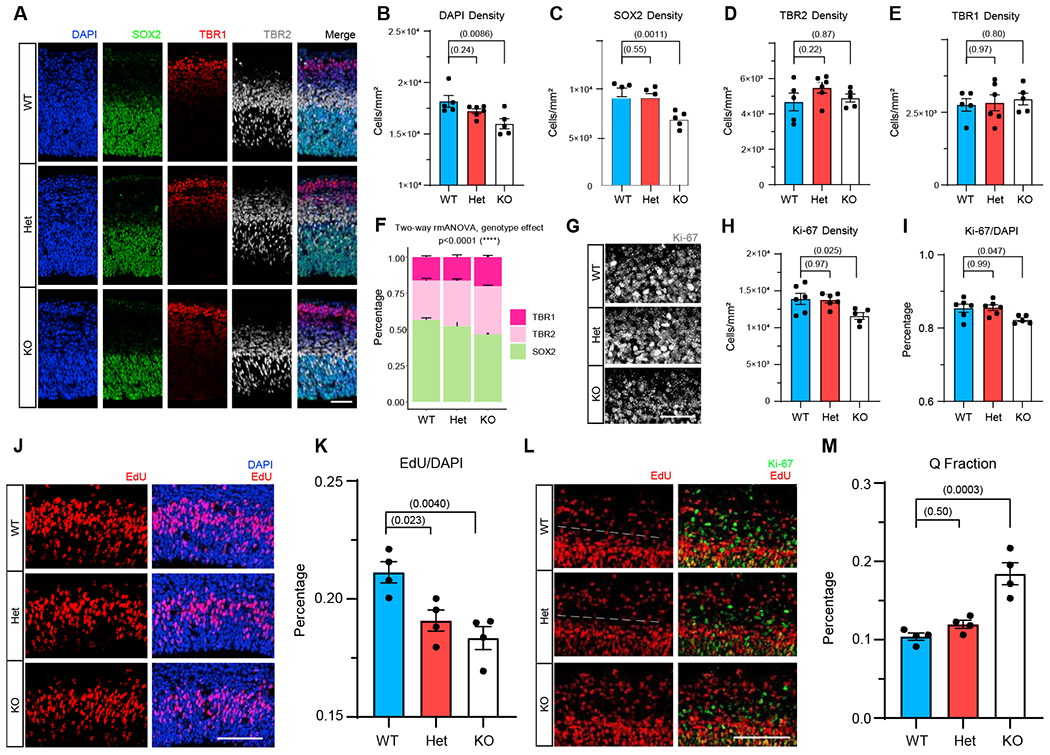
(A) IF for nuclei (DAPI; blue), apical progenitors (SOX2; green), intermediate progenitors (TBR2; gray), and postmitotic neurons (TBR1; red) in the E14 mouse cortex.
(B–E) KO mouse cortex had significantly less cellular density (B) and (C) fewer apical progenitors, with normal (D) intermediate progenitors and (E) postmitotic neurons.
(F) Myt1l mutants have significantly more early cell stage populations but less later cell stage population.
(G–I) KO mice have fewer proliferating cells compared with Het and WT littermates.
(J and K) EdU labeling for a 1.5 h window revealed decreased cell proliferation rate in mutant mouse cortex compared with WT.
(L and M) Co-staining for Ki-67 and EdU (20 h after labeling) experiments (L) found (M) a larger Q fraction value in KO but not in Het mouse cortex. White dashed lines in (L) indicate the border where proliferating cells started to exit the cell cycle and differentiate.
Data are represented as mean ± SEM. Scale bars, 25 μm (A), 50 μm (G), and 100 μm (J and L). See also Figure S4 and Table S5 for statistical test details.
Following mitosis, daughter cells either re-enter the cell cycle to expand the progenitor pool or leave permanently and become neurons. As decreased proliferation could be driven by a greater number of cells exiting the cell cycle, we quantified exiting by co-staining for recently proliferating cells (EdU+) that have lost Ki-67 (Q fraction; Figure 4L; Gompers et al., 2017). KOs had a significantly larger Q fraction (Figure 4M). These results show that MYT1L loss perturbs cell proliferation and enhances cell cycle exit. This corresponds well to the RNA-seq and provides the most parsimonious explanation for the smaller brains: precocious differentiation of some neural progenitors results in less proliferating cells and a decreased brain size in adults.
MYT1L haploinsufficiency results in sustained chromatin changes in adult brain
We next asked if the developmental molecular deficits continue or if MYT1L serves a distinct role in the adult brain. As ID and ASD are not well localized in the brain, we focused on the prefrontal cortex (PFC; Figure S5H), known to be dysregulated in human ADHD (Yasumura et al., 2019). For ATAC-seq, we discovered 4,988 DARs (FDR < 0.05, 9,756 FDR < 0.1; Table S2), with 2,607 less accessible DARs (Figures 5A and S5A–S5C), 2,381 more accessible DARs (Figures 5B, S5D, and S5E), and no peak showing a sex × genotype interaction (Table S2). Motif analysis of DARs revealed that regions of lost accessibility in Hets are enriched for motifs of TFs involved in neuron projection (Egr2) and the DD gene Foxp1, while those more accessible regions had motifs for an early neuronal TF (Eomes; Figures 5C and S5G). GO analysis (Table S4), likewise, highlighted disruption of neuronal projection development and synaptic transmission pathways (Figures 5D and S5H). Similar to E14, ChIP-seq targets had less accessibility in adult Hets (Figure S5F), and more ChIP targets overlapped with less accessible DARs than more accessible DARs (χ2[1, N = 291] = 143.94, p < 0.0001), again suggesting that MYT1L directly acts as an activator in vivo.
Figure 5. Long-term MYT1L deficiency results in arrested maturation of neuronal chromatin and expression patterns.
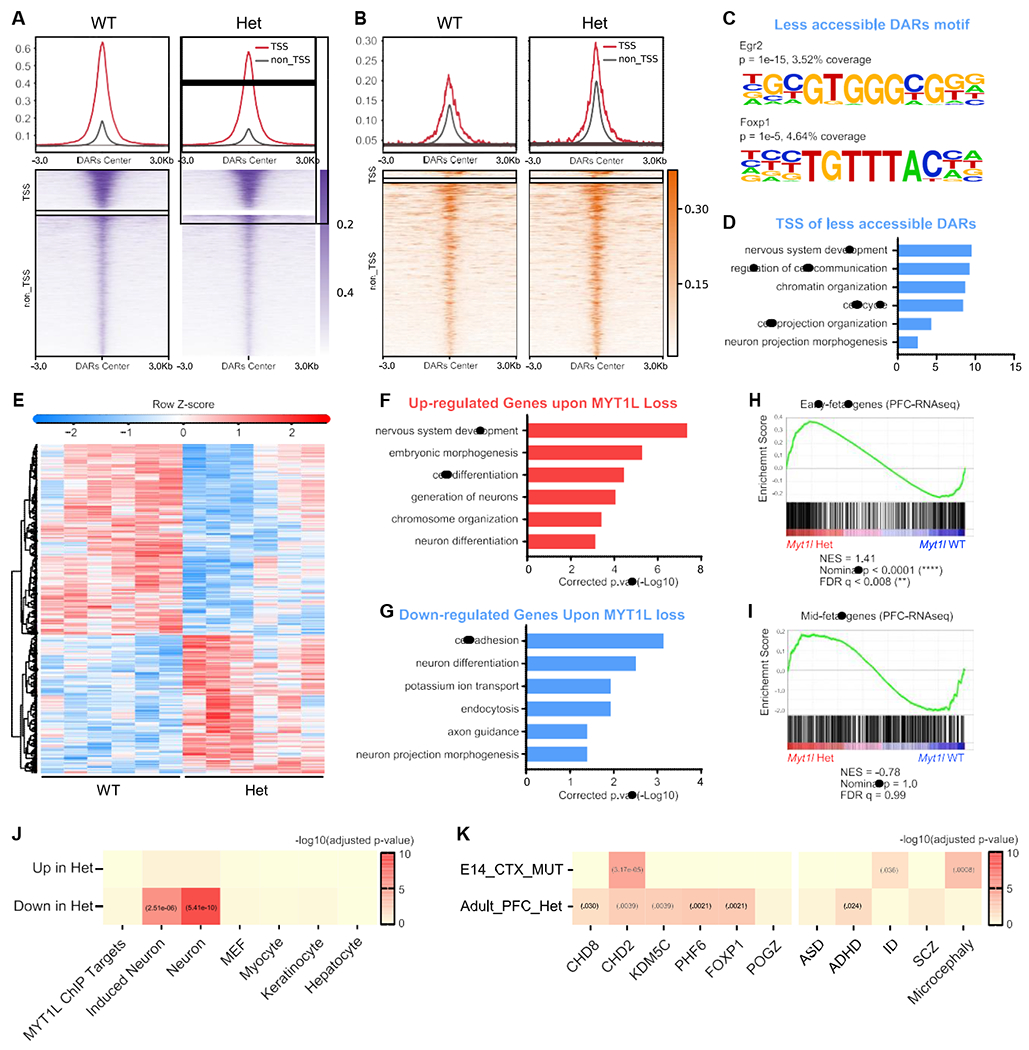
(A and B) Less accessible (A) and (B) more accessible regions in adult Het mouse PFC identified by ATAC-seq (FDR < 0.1).
(C) Homer motif analysis of less accessible DARs over more accessible DARs.
(D) GO analysis of DAR-associated genes showed the dysregulation of neurodevelopmental programming in adult Het mouse PFC.
(E) Heatmap for differential gene expression in adult Het mouse PFC (FDR < 0.1).
(F and G) GO analysis of DEGs revealed an upregulation of early neurodevelopmental pathways (F) and (G) a downregulation of neuron maturation and functions.
(H and I) GSEA analysis revealed that “early fetal” genes increased their expression (H), while (I) “mid-fetal” genes remained unchanged in adult Het mouse PFC compared.
(J) Repressed genes upon MYT1L loss in PFC significantly overlapped with induced neuron and neuronal signature genes.
(K) MYT1L regulated genes were implicated in other ID/ASD mouse models and human genetic datasets.
See alsoFigure S5 and Table S5 for statistical test details.
We also performed RNA-seq on the PFC (Figure S5I) to determine transcriptional consequences. We identified 533 of 14,104 DEGs in Het PFC (Figure 5E; Table S3), with a few significant sex × genotype interactions (Table S3). Mapped to ATAC-seq data, there was correspondence between TSS accessibility and gene expression (Figure S5J; Table S3). In contrast to E14 RNA-seq, ChIP-seq promoter-related genes displayed subtle upregulation upon MYT1L loss in adult RNA-seq (Figure S5K), suggesting that it can also act as a repressor in adults (though more firm conclusions await MYT1L binding data in adult brains). When comparing DEGs’ expression between adult in vivo and prior in vitro RNA-seq, we still did not see correlation in fold changes (Figures S5L and S5M). Interestingly, only upregulated genes from our in vivo RNA-seq significantly overlapped with MYT1L-repressed genes, whereas our downregulated genes did not show any overlap with MYT1L-induced genes (Figures S5N and S5O). Also, the DEGs from E14 but not adult RNA-seq were significantly enriched in ChIP-seq targets (Figures 5J and S3P). These results indicate that MYT1L either has distinct targets in the adult brain or a different role than at E14.
MYT1L haploinsufficiency results in failed transcriptional development
To define a role of MYT1L in the adult brain, we performed GO analysis of DEGs (Table S4). This revealed that genes from early phases of CNS development (e.g., Eomes, Dcx) were upregulated in Hets (Figure 5F). These are genes expressed in immature neurons, again indicating a shift in timing of transcriptional maturation. Then we performed GSEA and confirmed increased expression of “early fetal” genes with no expression change of “mid-fetal,” Wnt signaling, and Notch signaling genes in Hets (Figures 5H, 5I, S5P, and S5Q). Persistent activation of developmental programs suggests that adult Het brains are trapped in an immature state. Indeed, genes downregulated upon MYT1L loss were significantly enriched in neuronal genes, showing an impaired mature neuronal identity (Figure 5J). Likewise, GO analysis showed downregulation of neuronal projection development (e.g., Epha7, L1cam), ion homeostasis (e.g., Kcnt2, Kcne4), and synaptic transmission (Gipc1, Vamp2; Figure 5G), echoing this immaturity and potentially disrupted neuronal functions.
Finally, as MYT1L syndrome is one of several forms of ID/ASD caused by TF mutation, we tested whether DEGs are dysregulated in related models. DEGs from adult RNA-seq significantly overlapped with DEGs from Chd8, Chd2, Kdm5c, Phf6, Foxp1, and Pogz KO mouse models (Figure 5K). DEGs from E14 were enriched in the Chd2 and Chd8 datasets (Figures 5K and S5R). Interestingly, post hoc analysis showed that genes were dysregulated in an opposite direction between Myt1l mutant mice and other ID/ASD mouse models (Figures S5R and S5S). This suggests that genes implicated in different ID/ASD models are pathogenic when dysregulated in either direction.
Comparison with human data showed that DEGs derived from PFC of Het mice were enriched in ADHD and ASD associated genes but not in human IDD, SCZ, or microcephaly genes (Figures 5K and S5R). Conversely, DEGs from E14 only significantly overlapped with human ID and microcephaly (Figures 5K and S5S). Together, these findings highlight some convergence between MYT1L syndrome and other DDs.
MYT1L haploinsufficiency disrupts postnatal neuronal physiology and spine maturity
Het mice showed deficits in transcriptional and chromatin states, with a failure to achieve the mature profile of axonal development. Therefore, we asked whether this manifested in neurophysiological changes at the cellular level. We first examined the passive membrane properties and cell morphology of layer 2/3 pyramidal neurons in the primary visual cortex (V1) at P21–P23, an extensively studied system with similar cell types and mesoscale circuit connectivity to PFC (Oh et al., 2014; Tasic et al., 2018). Compared with age-matched wild-type (WT) neurons, Het neurons exhibited significantly depolarized resting membrane potentials (Figure 6A), and decreased membrane resistance (Figure 6B), which are changes that affect membrane excitability in opposite directions. We also observed a smaller time constant in Hets that was explained by the decrease in membrane resistance and capacitance (Figures 6C and 6D), which could arise from a decrease in total cell surface area or altered ion channel composition. In total, MYT1L haploinsufficiency disrupts the passive physiological properties of pyramidal neurons. To ask whether the change in capacitance was a direct result of cell surface area, we examined the somatic size of the patched neurons. A previous shRNA study on differentiating neural progenitor cells (NPCs) revealed larger cell bodies yet decreased neurites (Kepa et al., 2017). Here, with controlled haploinsufficiency in vivo, we found that MYT1L loss changed neither neuron soma size (Figures 6E, S6A, and S6B) nor many dendrite morphological properties, including length, nodes, as well as complexity (Figures S6D–S6G). We found a small but not significant decrease of total dendrite numbers in Het neurons (p = 0.054; Figure S6C). Yet branch analysis revealed no difference between Het and WT mice (Figures S6H and S6I), and a Sholl analysis showed no differences in spatial aspects of dendritic morphology (Figures 6F and S6J). These results indicate that altered passive properties of Het neurons are not caused by morphological changes but do not rule out the possibility of morphology changes in other brain regions.
Figure 6. MYT1L haploinsufficiency disrupts baseline neuronal properties and dendritic spine maturity but not neuronal morphology.
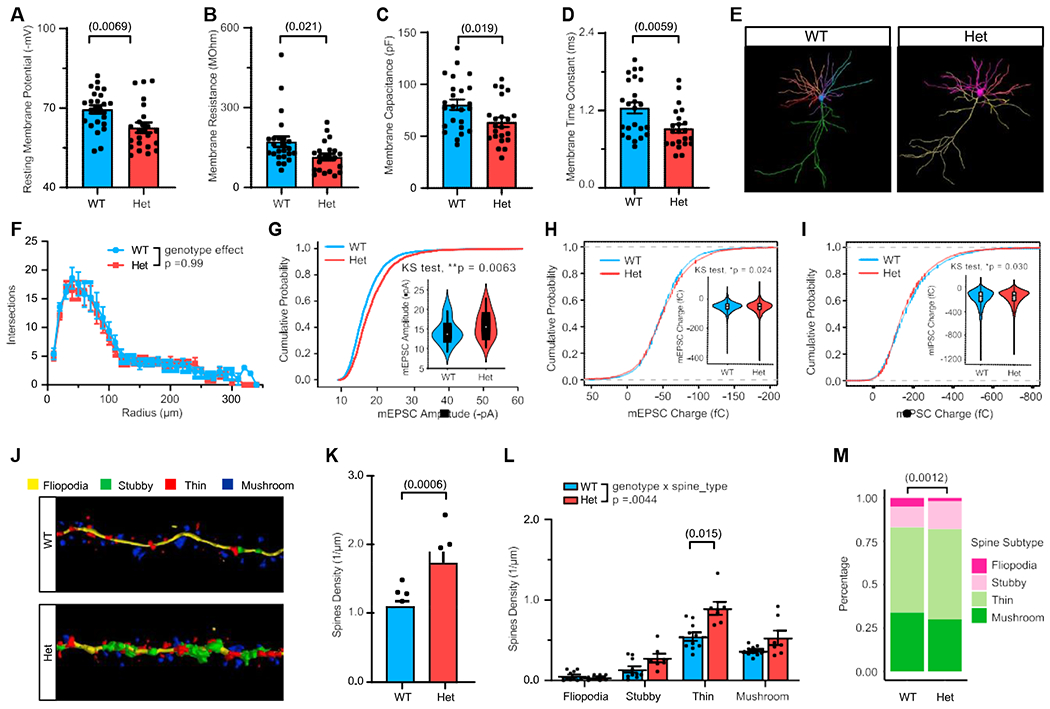
(A–D) MYT1L loss led to less negative membrane potential (A), (B) reduced membrane resistance, (C) decreased membrane capacitance, and (D) smaller membrane time constant in cortical pyramidal neurons.
(E) Neuronal soma and dendrites tracing in Neurolucida.
(F) Sholl analysis revealed no dendrite complexity change across genotypes.
(G) Het neurons showed increased mEPSC amplitude distribution compared with WT neurons.
(H and I) Analysis of individual events of mEPSC and mIPSC revealed that the charges of Het neurons’ mEPSCs are slightly larger (H), (I) while mIPSCs are slightly smaller.
(J) Representative images of spine tracing and subtypes identification using Neurolucida.
(K and L) Het neurons had more apical spines (K) with (L) general increase in different spine subtypes.
(M) Het neurons had a higher percentage of immature spines (stubby, thin) but less mature spines (mushroom) compared with WT.
Data are represented as mean ± SEM. See also Figure S6 and Table S5 for statistical test details.
We next asked whether MYT1L haploinsufficiency affects synaptic strength or numbers in these neurons. Thus, we measured miniature excitatory postsynaptic currents (mEPSCs; Figure S6K). We saw no change in the frequency (Figure S6L), but we did see a trend toward increased mean amplitude of mEPSCs across cells (Figure S6M). More immature cortical neurons have larger mEPSCs (Desai et al., 2002). Investigating all individual mEPSC events revealed that they were indeed shifted toward larger currents (Figure 6G). As excitation/inhibition (E/I) balance is often disrupted in DDs (Gogolla et al., 2009; Nelson and Valakh, 2015), we also measured miniature inhibitory postsynaptic currents (mIPSCs; Figure S6N) to examine E/I balance in Het mice. With no change in mIPSC amplitude, there was a small decrease of mIPSC frequency, though not significant (p = 0.081) (Figures S6O and S6P). We further looked at mEPSC and mIPSC charge and found that the distribution of charge carried by individual postsynaptic current events shifted toward increased excitation (p = 0.024) but decreased inhibition (p = 0.030) in Het neurons (Figures 6H and 6I). These results suggest that MYT1L loss leads to increased E/I ratio in the mouse brain. Morphologically, microscopic investigation of apical dendritic spine density and morphological maturity (Figure 6J) revealed increased spine density (Figure 6K) with decreased mature spines (mushroom) but increased immature spines (thin and stubby) in Hets (Figures 6L and 6M). Neurons generate excessive spines during development and spine numbers decrease via pruning afterward (Bhatt et al., 2009). Thus, increased spine density again indicated disrupted maturation of Het neurons. However, we did not see mEPSC frequency increase in Het neurons, suggesting that extra spines may be immature or non-functional.
MYT1L haploinsufficiency persistently impairs muscle strength and endurance and elevates activity and arousal
We next determined behavioral circuit consequences resulting from MYT1L haploinsufficiency. We evaluated Hets for features related to developmental delays, ID, ADHD, and ASD present in human MYT1L deletion patients by conducting a comprehensive behavioral characterization (Figures 7A and 7B). Language and motor delay are universal in MYT1L deletion patients (Blanchet et al., 2017), so we assessed Hets for gross developmental, communication, and motor delay (Figure 7A). Physically, Hets did not exhibit signs of gross developmental delay in pinnae detachment, eye opening, and postnatal weight gain (Figure 7C). We examined early communicative interaction by recording ultrasonic vocalizations (USV) emitted by isolated pups. Hets exhibited increased USV rates (Figure 7D) following maternal separation that is likely independent of altered respiratory muscle function (Figures 7E–7H). Rather than delayed communicative behavior, this elevated rate suggests an anxiety-like phenotype or, because USV rate also reflects arousal levels, heightened arousal that may reflect a hyperactive phenotype.
Figure 7. Myt1l haploinsufficiency results in heightened USV production and muscle weakness and fatigue.
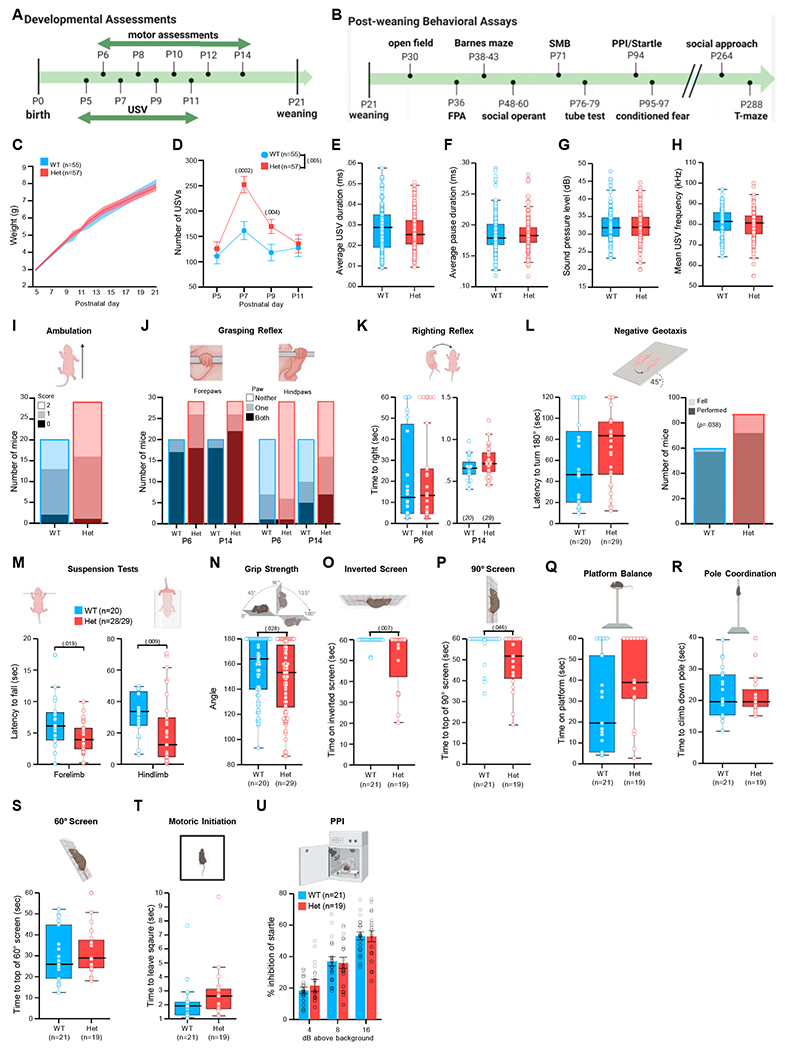
(A and B) Timelines for (A) developmental assessments and (B) post-weaning assays.
(C) Comparable early postnatal weight trajectories.
(D–H) Hets produced fewer USVs than WT (D), which did not differ from WT calls on (E–G) temporal (call duration, pause duration, sound pressure level) or (H) spectral (mean frequency) features.
(I and J) MYT1L loss was not associated with ambulation scores at P8 (I) or (J) grasping reflex.
(K) Hets exhibited latency to righting reflex similar to WT mice.
(L) Latency to exhibit negative geotaxis was comparable, but MYT1L loss was associated with increased falls from the inclined apparatus.
(M) Hets were unable to remain suspended by fore or hindlimbs as long as WT mice.
(N) Hets fell from the grip strength mesh screen at a narrower angle than WT mice.
(O) As adults, Hets hung on an inverted screen for a shorter latency than WT mice.
(P) Hets exhibited a longer latency than WT mice to climb to the top of a 90° screen.
(Q–S) Times to balance on an elevated platform (Q), (R) latencies to down a pole, and (S) latencies to climb up a 60° wire mesh screen were comparable.
(T) Hets initiated movement at a similar latency to WT mice.
(U) Percentage inhibition of startle following a prepulse was similar in Het and WT mice.
For (C), (D), and (U), grouped data are presented as mean ± SEM. For (E)–(H), (K), and (L) (left) and (M)–(T), grouped data are presented as boxplots with thick horizontal lines denoting group medians, boxes 25th to 75th percentiles, and whiskers 1.5 × interquartile range (IQR). Individual data points are open circles. See Table S5 for statistical details.
Possible motor delay was assessed with a battery of tasks conducted from P1 to P14 (Feather-Schussler and Ferguson, 2016), which examined ambulation, posture, reflexes, and muscle strength and endurance. Hets exhibited normal acquisition of ambulation and grasping reflex (Figures 7I and 7J) and comparable latencies for righting and negative geotaxis reflexes (Figures 7K and 7L). However, Myt1l mutation was associated with an inability to hold position during the negative geotaxis test (Figure 7L). Hets were also unable to remain suspended as long on other strength tasks including fore- and hindlimb suspension (Figure 7M) and grip strength (Figure 7N). Although these tasks are not exhaustive, the results suggest that no gross motor delay was present. Yet the strength and endurance deficits suggest hypotonia, a feature reported often in MYT1L deletion patients (Blanchet et al., 2017; Doco-Fenzy et al., 2014; Windheuser et al., 2020).
In an independent cohort assessed from P30 through adulthood (Figure 7B), we also observed reduced muscle strength and endurance in Hets on sensorimotor tasks, including the inverted screen (Figure 7O) and climbing a 90° wire screen (Figure 7P), which require strength and coordination. Hets were largely normal on the remaining tasks for balance, coordination, and movement initiation (Figures 7Q–7T). In addition, we found comparable prepulse inhibition (PPI) in the sensory gating startle/PPI task (Figure 7U). Coupled with the neonatal data, these findings indicate MYT1L loss resulted in muscle weakness suggestive of hypotonia, yet future studies of body composition and muscle pathology will be necessary to confirm this as a model of MYT1L-dependent hypotonia.
As patients show ID, we examined spatial learning and memory and Pavlovian fear conditioning. Hets displayed normal spatial acquisition and memory retention in the Barnes maze (Figures S7A and S7B). However, Hets failed to show typical contextual and cued fear conditioning (Figure S7C), suggesting decreased associative memory. In the same cohort of mice, we examined activity levels for ADHD-like features at P30. Regardless of sex, Hets were hyperactive in the open-field task, traveling a greater distance than WT littermates (Figure S8A). This hyperactivity replicated in subsequent assays: in distance traveled in the social operant task and in heightened baseline force measurements in the startle task (a measurement of movement in the apparatus in the absence of startle stimuli; Figures 8S and S8B). This hyperactive phenotype confounds the interpretation of the conditioning data above because it can mirror a conditioning deficit in this task. Thus, further investigations are necessary to understand any learning deficits in this model. Finally, we assessed the center variables of the open-field task for anxiety-related behaviors (thigmotaxis) and found no increase in anxiety-related behavior in Hets as measured in this task (Figure S8C). The hyperactivity phenotype in the absence of anxiety-related markers sheds more light on the heightened USV data, supporting an interpretation that the increase in call rate reflects elevated arousal.
Figure 8. Myt1l haploinsufficiency altered social behaviors.
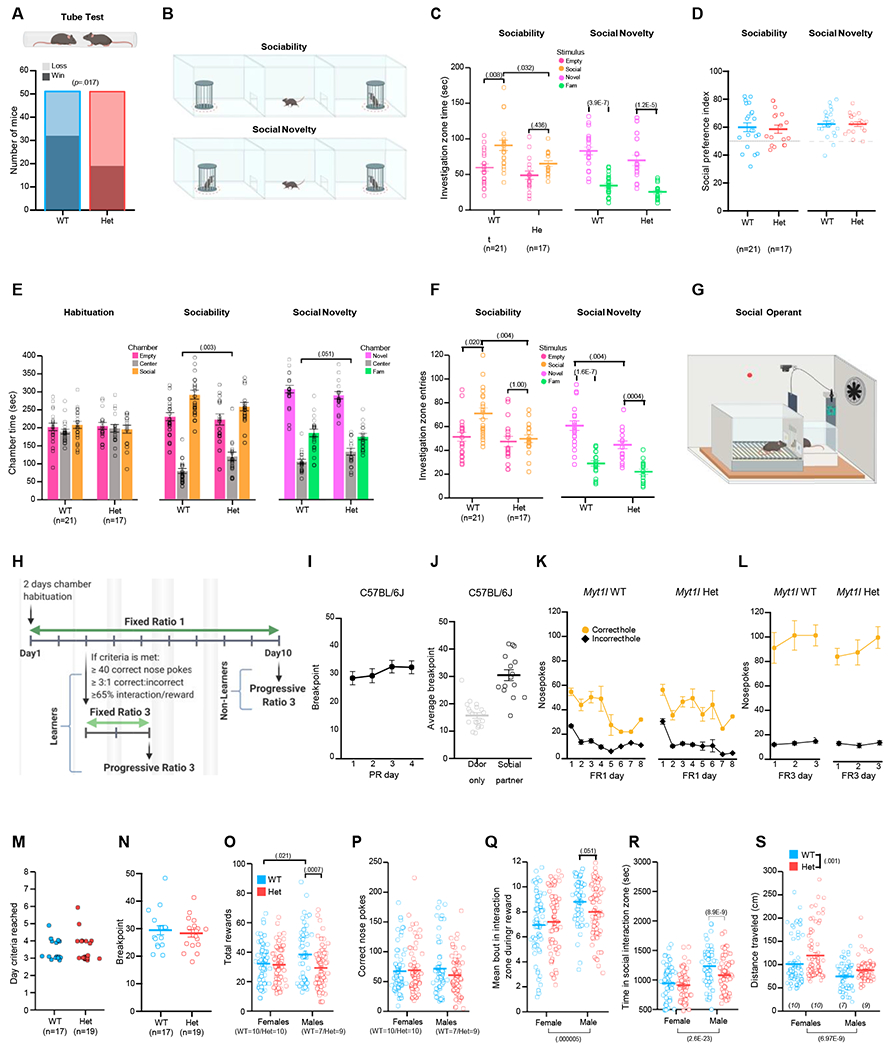
(A) MYT1L loss was associated with losses in the social dominance assay.
(B) Social approach test schematic. Investigation zones are demarcated by the dotted red lines.
(C) In the sociability trial, Hets spent less time investigating the social stimulus than WT mice and failed to show an increase in time spent in the social versus empty investigation zones. No difference was observed in social novelty.
(D) Sociability and social novelty preference scores were comparable.
(E) Hets spent more time in the center chamber during both trials compared with WT mice.
(F) In the sociability trial, Hets entered the zone surrounding the social stimulus fewer times and failed to show an increase in entries into the social cup zone versus the empty cup zone. In the social novelty trial, Hets entered the zone surrounding the novel mouse less than WT mice.
(G and H) Social operant assay and timeline schematics.
(I) C57BL/6J mice show consistency in the maximum level of effort they will exert for access to social interaction reward, demonstrating that performance in the social operant test is reproducible across test days.
(J) This maximum effort is driven by the social aspect of the reward, as demonstrated by the difference in performance between mice that received the social interaction reward and mice that did not.
(K) The time series of task acquisition demonstrates that Myt1l WT and Het mice learn to discriminate between correct and incorrect holes for access to a social interaction reward during FR1 training.
(L) All mice that meet learning criteria are motivated to work harder for the social interaction reward when more effort is required in FR3 testing.
(M and N) Day to reach criteria during social operant training (M) and (N) breakpoint reached during PR3 testing were not different between Het and WT mice.
(O) Het males achieved fewer social rewards compared with WT males.
(P) Het males and females exhibited a comparable number of correct nose pokes as WT littermates.
(Q) During a reward, Het males trended toward less total time in the social interaction zone compared with WT males. Regardless of genotype, males spent more time in the social interaction zone compared with females.
(R) Het males spent less total time in the social interaction zone than WT males. Regardless of genotype, males spent more time in the social interaction zone compared with females.
(S) Female and male Hets traveled farther distances during 1 h social operant trials compared with WT mice. Overall, females traveled farther distances than males during social operant trials.
For (C)–(F), (I)–(L), and (N)–(S), grouped data are mean ± SEM. Individual data points are open circles. See also Figures S7 and S8 and Table S5 for statistical details.
MYT1L haploinsufficiency results in ASD-related social impairments that are particularly robust in males
We also investigated multiple behaviors related to ASD circuits. First, we investigated cognitive inflexibility, sensory sensitivity, repetitive behaviors, and stereotypies across multiple assays. In the spontaneous alternation T-maze, Hets exhibited comparable percentage alternation as WT mice (with both different from chance, 50%; Figure S8D), indicating no preservation here. To assess sensory sensitivities, we quantified responses to stimulation of the plantar surface of the paw with von Frey filaments. Het mice exhibited an overall reduced sensitivity to this tactile stimulation (Figure S8E). Examination of open-field movement plots revealed sharp vertical movements in the perimeter, suggestive of jumping. Therefore, were-analyzed the video data (Figure S8F) to generate supervised machine learning behavioral predictive classifiers for automated quantification of jumping behavior (Video S1). Despite hyperactivity displayed by both male and female Hets (Figure S8A), only female Hets exhibited significantly more jumping (Figure S8G). Therefore, this may be a female-specific overactivity trait. We also did not observe grooming-like stereotyped behavior in the force-plate actometer (FPA), the form of bouts of low mobility, or movement during those bouts (Figures S8H and S8I). Indeed, our machine learning classifier revealed that although there was an interesting sex difference in the duration of grooming bouts (Figure S8J), Myt1l mutation did not further modulate this behavior (Figure S8K). Thus, in the tasks used here, no behaviors related to repetitive/restrictive interests or stereotypies were observed.
Previous work suggested MYT1L promotes differentiation of oligodendroglia (Shi et al., 2018), which could affect myelination. Demyelination can result in a tremor in mice, as assessed by the FPA (Li et al., 2019). However, we did not observe any tremor in Hets (Figure S8L), suggesting that the white matter anomalies we see do not reflect demyelination, consistent with the normal FA values (Figure 3H).
Finally, we assayed multiple aspects of social behavior. To assess social hierarchy behavior, we used the social dominance tube test. MYT1L loss was associated with submission in this test (Figure 8A). In the social approach task (Figure 8B), Hets showed reduced sociability (less time investigating the novel conspecific compared with WT mice) during both trials (Figure 8C), though still exhibiting social preference (Figure 8D). This is due to reduced investigation time overall, as Hets spent more time in the center chamber (Figure 8E). These findings, coupled with reduced entries into the social investigation zone (Figure 8F), indicate reduced sociability in Hets.
Deficits in sociability may be due to reduced motivation to engage with a social partner. Social motivation requires both social reward circuits and social orienting circuits (i.e., attending to a social stimulus when presented) (Chevallier et al., 2012). Therefore, we used data from an adapted and extended social paradigm (Martin and Iceberg, 2015) to understand the effect of MYT1L loss on social motivation directly and parse these two possibilities. We adapted standard operant conditioning (Figures 8G and 8H) to assess social motivation by rewarding nose pokes with an opportunity for transient social interaction (Figures 8I–8L). Social reward seeking is quantified by increasing the number of nose pokes required (work) to elicit each reward, and in parallel the animal’s social orienting can be assessed by tracking its behavior. Hets were normal on learning the task, including day to reach criteria on the basis of correct to incorrect nose pokes (Figure 8M), and appeared to show normal social reward seeking, defined by the maximum number (breakpoint) of correct nose pokes made for a reward (Figure 8N). However, during training male Hets achieved fewer social rewards compared with WT males (Figure 8O), despite exhibiting a comparable number of correct nose pokes (Figure 8P). This suggested the Het males continued to poke despite the presentation of a social reward. Indeed, we found that Het males tended to spend less time at the door during a reward (Figure 8Q) and showed a significant decrease in overall time in the interaction zone (Figure 8R). This reduction is not secondary to increased activity levels of male Hets, as both males and female Hets show increased distance traveled (Figure 8S). Together, these data indicate that Het males failed to cease nose poking and orient to a social stimulus at the WT rate.
DISCUSSION
Here, we generated a model of Myt1l mutation to address the role of MYT1L protein during CNS development and to comprehensively characterize a model of this syndrome. We confirmed that the frameshift mutation results in haploinsufficiency, ruling out a truncated protein mechanism. The lowered protein level leads to physical and behavioral anomalies, many of which reflect observations in patients, including microcephaly, thinned white-matter, muscle weakness, obesity, hyperactivity, and social deficits. This indicates that these mice are a robust model of the disorder and will enable preclinical and mechanistic studies that are not possible in humans.
Along these lines, molecular and neuropathologic studies defined a mechanism for aspects of the syndrome. Specifically, the syndrome’s microcephaly appears to be due to precocious differentiation of progenitors to immature neurons. The most parsimonious interpretation is that loss of proliferating progenitors results in insufficient expansion progenitor pools and thus a correspondingly smaller brain. Although MYT1L loss during early brain development likely results in microcephaly in adult mice, whether such insufficiency leads to other structural and behavioral deficits in adulthood remains unclear. Future Myt1l conditional KOs in adults are necessary to answer this question.
These same molecular studies clarify the role of MYT1L protein levels in normal brain development. In mutants, ATAC-seq revealed substantial change in chromatin accessibility across the genome, with both increases and decreases. Given the shift in cell proportions from precocious differentiation, this represents a mix of direct and indirect effects. Focusing on the likely direct effects (i.e., ChIP peaks), mutants showed a disproportionate loss of accessibility, suggesting that MYT1L more often functions as an activator in vivo. Our RNA-seq findings mirror these observations. One puzzle is the larger overall effects in E14 Hets than KOs (Figure 3A) in ATAC-seq but not in RNA-seq. If it is not experimental noise, then this suggests that some compensation occurs following complete loss of MYT1L, perhaps through upregulation of other chromatin modifiers (Figure S3Q).
A primary role as an activator during normal brain development agrees with some prior data but does contrast with the specific role proposed for MYT1L during transdifferentiation studies. Prior studies defined both activation and repression domains (Manukyan et al., 2018), suggesting that MYT1L may have distinct functions in different contexts. Furthermore, the lack of binding motifs near activated transcripts following MYT1L OE led Manukyan et al. (2018) to speculate that MYT1L’s activating effects involved either a novel motif or indirect recruitment via other TFs. Our data offer some support for the latter conclusion, with ~20% each of reduced accessibility regions showing ASCL1 and LHX motifs, but no enrichment of the MYT1L motif. We also saw some evidence of repressive function for MYT1L, as some regions opened chromatin upon its loss. However, our findings in vivo during development contrast with the role MYT1L was proposed to serve in vitro during directed transdifferentiation of fibroblasts to neurons (Mall et al., 2017), in which OE MYT1L corresponded to a loss of fibroblast gene expression. They concluded MYT1L served as a novel “repressor of all lineages save neurons,” in opposition to the classic REST TF, known to repress the expression of neuron-specific genes in all non-neuronal cells (Chong et al., 1995). However, decrease or loss of MYT1L did not result in ectopic expression of other lineages’ genes in E14 brain, suggesting that such a role is not a major function during normal brain development. In E14 mice, the preponderance of evidence fit a model of a loss of an activator. In the adult, the results were mixed, with ATAC-seq suggesting loss of an activator, while RNA-seq contrasted somewhat.
Yet with regard to later function on neuronal maturation, our adult studies agree in a general way with prior shRNA data in primary neurons and NPCs (Kepa et al., 2017; Mall et al., 2017) that decreasing MYT1L levels disrupt neuronal maturation. Like these studies, we saw a decrease in mature neuronal markers and an aberrant higher expression of immature neuronal markers. Correspondingly, Het neurons exhibited markedly abnormal electrophysiological properties and immature spine morphology. This physiological effect was not as severe as was seen following shRNA from Mall et al. (2017), in which action Potentials were completely lost, or Kepa et al. (2017), in which cell body size was doubled and neurites decreased by half. Perhaps these more robust effects reflect a stronger KD (e.g., 90% for Kepa et al., 2017), and they may explain why KO mice are not viable after birth. Although the physiological significance of increased excitation in Het animals’ visual cortex is still unknown, synaptic and membrane dynamics are key determinants of neuronal computation; thus the changes observed in vivo indicate a functional mechanism by which MYT1L haploinsufficiency-induced changes in transcription and chromatin state may undermine circuit function.
This has lasting behavioral consequences as well, including muscle weakness, hyperactivity, and social deficits, echoing patient prevalence of hypotonia and the diagnosis in a subset of ADHD and ASD (Blanchet et al., 2017). Mutants were hyperactive across numerous tasks, including open field, social operant and PPI/startle, and arguably USVs. The mice also had altered sociality, shown in the standard social approach task. In a task that coupled social operant conditioning to behavioral tracking to assess behavior related to social motivation, mutants, specifically males, learned to hole-poke for a social reward but tended to continue hole poking rather than reorienting to the social stimuli. This finding suggests that this mutation might affect social orienting rather than social reward. In addition, we believe that this adaptation of the social operant protocol may be of use in subtyping deficits leading to social anomalies across different genetic models of neurodevelopmental disorders.
Beyond mechanisms for the structural anomalies, this new MYT1L syndrome model will allow the identification of molecular mechanisms mediating these behavioral anomalies as well. Of particular interest is understanding whether MYT1L acts on the same or different targets across CNS development. In addition, there is also an opportunity to define circuits involved in social orienting in mice, a relatively understudied area. Finally, the robust patient-related phenotypes allow well-powered preclinical studies of potential therapeutics for MYT1L syndrome.
STAR★METHODS
RESOURCE AVAILABILITY
Lead contact
Further information and requests for resources and reagents should be directed to and will be fulfilled by the lead contact, Dr. Joseph D. Dougherty (jdougherty@wustl.edu).
Materials availability
This study did not generate new unique materials.
Data and code availability
The codes for analyzing Illumina sequencing, ATAC-seq, and RNA-seq generated in this study are available via Bitbucket: https://bitbucket.org/jdlabteam/workspace/projects/MYT. The ATAC-seq and RNA-seq raw reads as well as counts data are available at GEO with reference ID GSE173943. Any additional information required to reanalyze the data reported in this work paper is available from the Lead Contact upon request.
EXPERIMENTAL MODEL AND SUBJECT DETAILS
Human subjects
All procedures with human subjects were approved by the Washington University Institutional Review Board (201603131).
Animal models
All procedures using mice were approved by the Institutional Care and Use Committee at Washington University School of Medicine and conducted in accordance with the approved Animal Studies Protocol. All mice used in this study were bred and maintained in the vivarium at Washington University in St. Louis in individually ventilated (36.2 × 17.1 × 13 cm) or static (28.5 × 17.5 × 12 cm; post-weaning behavior only) translucent plastic cages with corncob bedding and ad libitum access to standard lab diet and water. Animals were kept at 12/12 hour light/dark cycle, and room temperature (20-22°C) and relative humidity (50%) were controlled automatically. For all experiments, adequate measures were taken to minimize any pain or discomfort. Breeding pairs for experimental cohorts comprised Myt1l Hets and wild-type C57BL/6J mice (JAX Stock No. 000664) to generate male and female Myt1l Het and WT littermates. For embryonic ATAC-seq, RNA-seq, and EdU labeling, Myt1l Het x Het breeding pairs were used to generate Myt1l WT, Het and homozygous mutant littermates. Animals were weaned at P21, and group-housed by sex and genotype. Biological replicates for all experiments are sex and genotype balanced.
METHOD DETAILS
Generation of MYT1L knockout mice
CRISPR-mediated homology-directed repair (HDR) was used to generate Myt1l S710fsX mice. A Cas9 gRNA was designed to target the 7th exon of the mouse MYT1L gene (seq: 5′ GCTCTTGCTACACGTGCTACNGG 3′), similar to where a patient specific heterozygous de novo mutation defined by our clinical colleagues in a human case with ASD (c.2117dupG). Cutting efficiency of reagents and homologous recombination was confirmed in cell culture. Then validated gRNA and Cas9 protein (IDT) were electroporated into fertilized C57BL6/J oocytes along with single stranded oligonucleotides carrying homology to the targeted region and the G mutation (Seq: 5′ accagcagctatgcacctagcagcagcagcaacctcagctgtggtggtggcagGcagcgccTCCagTacgtgtagcaagagcagctttgactacacacatgacatggaggccgcacacatggcagcc 3′) as well as blocking oligonucleotides (Seq: 5′ accagcagctatgcacctagcagcagcagcaacctcagctgtggtggtggcagcagcgccTCCagTacgtgtagcaagagcagctttgactacacacatgacatggaggccgcacacatggcagcc 3′) for the other strand to prevent homozygous mutation and presumptive embryonic lethality of founders. Eggs were cultured for 1-2 hours to confirm viability, then transferred to pseudopregnant surrogate dams for gestation. Pups were then screened for the targeted allele by amplicon PCR with mutation flanking primers followed by Illumina sequencing.
Founders carrying the appropriate allele were then bred with wild-type C57BL/6J mice (JAX Stock No. 000664) to confirm transmission. F1 pups from the lead founder were genotyped by sequencing as above, then bred to generate experimental animals. Subsequent genotyping at each generation was conducted utilizing allele specific PCR using the MYT1L mutant primers and control primers, amplified using Phusion and the following cycling conditions: 98°C for 3 min, 98°C for 10 s, 61°C for 20 s, 72°C for 20 s, repeat 2-4 for 35 cycles, 72°C for 5 min, and hold at 4°C.
RNA extraction and RT-qPCR
Mice brains or cortex were dissected out at different developmental stages and homogenized in lysis buffer (10 mM Tris-HCl, pH 7.4, 10 mM NaCl, 3 mM MgCl2, 0.1% IGEPAL CA-630, 0.1% RNase inhibitor) on ice. Then lysates were mixed with Trizol LS and chloroform. After centrifugation, RNA was extracted from the aqueous layer with Zymo RNA Clean and Concentrator TM-5 kit. cDNA libraries were prepared using qScript cDNA synthesis Kit (QuantaBio). RT-qPCR were performed using SYBR Green Master Mix (Thermo Fisher) on QuantStudio 6 Flex Real Time PCR System using primers in the Key Resources Table. We normalized cycle counts to Gapdh or β-actin and calculated normalized relative gene expression using ΔΔCT. To compare MYT1L mRNA expression between genotypes, we put 6 WT and 8 Het brains into qPCR procedure. To understand MYT1L expression in human brain, we acquired normalized RNA-seq RPKM values of MYT1L in primary somatosensory cortex (S1C) from Allen Brain Atlas BrainSpan dataset (http://www.brainspan.org/) and plotted MYT1L mRNA temporal expression in R.
KEY RESOURCES TABLE
| REAGENT or RESOURCE | SOURCE | IDENTIFIER |
|---|---|---|
| Antibodies | ||
| Rabbit anti-MYT1L | Proteintech | CAT#25234-1-AP; RRID: AB_2879978 |
| Guinea pig anti-MAP2 | Synaptic Systems | CAT#188044; RRID: AB_2893136 |
| Goat anti-SOX2 | Santa Cruz | CAT#sc-17320; RRID: AB_2286684 |
| Chicken anti-TBR2 | Millipore | CAT#AB15894; RRID: AB_10615604 |
| Rat anti-TBR2 | Invitrogen | CAT#14-4875-82; RRID: AB_11042577 |
| Rat anti-Ki67 | Invitrogen | CAT#14-5698-82; RRID: AB_10854564 |
| Rat anti-CTIP2 | Abcam | CAT#ab18465; RRID: AB_2064130 |
| Mouse anti-BRN2 | Santa Cruz | CAT#sc-393324; RRID: AB_2737347 |
| Rabbit anti-NEUN | Cell Signaling | CAT#12943; RRID: AB_2630395 |
| Goat anti-GFAP | Abcam | CAT#ab53554; RRID: AB_880202 |
| Goat anti-OLIG2 | R&D Systems | CAT#AF2418; RRID: AB_2157554 |
| Rabbit anti-TBR1 | Abcam | CAT#ab31940; RRID: AB_2200219 |
| Mouse anti-GAPDH | Sigma | CAT#G8795; RRID: AB_1078991 |
| Donkey anti-rabbit, Alexa Fluor 488 | Invitrogen | CAT#A-21206; RRID: AB_2535792 |
| Donkey anti-rabbit, Alexa Fluor 546 | Invitrogen | CAT#A10040; RRID: AB_2534016 |
| Donkey anti-rabbit, Alexa Fluor 647 | Invitrogen | CAT#A-31573; RRID: AB_2536183 |
| Donkey anti-chicken, Alexa Fluor 488 | Jackson Immuno Research | CAT#703-545-155; RRID: AB_2340375 |
| Donkey anti-rat, Alexa Fluor 488 | Invitrogen | CAT#A48269; RRID: AB_2893137 |
| Donkey anti-rat, Alexa Fluor 647 | Invitrogen | CAT#A48272; RRID: AB_2893138 |
| Donkey anti-mouse, Alexa Fluor 546 | Invitrogen | CAT#A10036; RRID: AB_2534012 |
| Donkey anti-goat, Alexa Fluor 488 | Jackson Immuno Research | CAT#705-546-147; RRID: AB_2340430 |
| Donkey anti-goat, Alexa Fluor 647 | Jackson Immuno Research | CAT#705-605-003; RRID: AB_2340436 |
| Goat anti-mouse IgG (H+L)-HRP conjugate | Bio-Rad | CAT#1706516; RRID: AB_11125547 |
| Goat anti-rabbit IgG (H+L)-HRP conjugate | Millipore | CAT#AP307P; RRID: AB_11212848 |
| Chemicals, peptides, and recombinant proteins | ||
| Streptavidin, Alexa Fluor 568 conjugate | Invitrogen | CAT#S11226: RRID:AB_2315774 |
| SYBR Green Master Mix | Thermo Fisher | CAT#4309155 |
| Critical commercial assays | ||
| Click-iT EdU Cell Proliferation Kit for Imaging Alexa Fluor-594 | Invitrogen | CAT#C10339 |
| qScript cDNA synthesis Kit | QuantaBio | CAT#95047 |
| Zymo RNA Clean and ConcentratorTM-5 kit | Zymo Research | CAT#R1014 |
| Deposited data | ||
| RNA-seq | Gene Expression Ominibus | GSE173943 |
| ATAC-seq | Gene Expression Ominibus | GSE173943 |
| Experimental models: Organisms/strains | ||
| Mouse, C57BL/6J, Myt1l S710fsX | The Jackson Laboratory | CAT#036428 |
| Mouse, C57BL/6J, Wild-type | The Jackson Laboratory | CAT#000664: RRID: IMSR_JAX:000664 |
| Oligonucleotides | ||
| Myt1l S710fsX founder screening | This paper | F(5′-3′): GGCCTAACCACACTGTCCTC; R(5′-3′): CACAAGTTAGGGCTGGAGGG |
| Myt1l S710fsX PCR genotyping (WT) | This paper | F(5′-3′): ATGTCGCAGTAGCCAAGTC; R(5′-3′): TCTTGCTACACGTGCTACT |
| Myt1l S710fsX PCR genotyping (Mut) | This paper | F(5′-3′): ATGTCGCAGTAGCCAAGTC; R(5′-3′): TCTTGCTACACGTACTGGA |
| Myt1l S710fsX Sanger sequencing | This paper | F(5′-3′): ACCTGTTAGTCACATGAGG; R(5′-3′): TGGTGGAGATGCCTATCTC |
| 1st PCR for illumina sequencing | This paper | F(5′-3′): GTGACTGGAGTTCAGACGTGTGCTCTTCC GATCTCAAGCGGTACTGCAAGAATG; R(5′-3′): ACACTCTTTCCCTACACGACGCTCTTCCGAT CTCTGTGGCATTTCACGACAAC |
| 2nd PCR for illumina sequencing_001 | This paper | F(5′-3′): AATGATACGGCGACCACCGAGATCTAC ACTCTTTCCCTACACGACGCTCTTCCGATCT; R(5′-3′): CAAGCAGAAGACGGCATACGAGATACCGGTGTCGTG ACTGGAGTTCAGACGTGTGCTCTTCCGA |
| 2nd PCR for illumina sequencing_002 | This paper | F(5′-3′): AATGATACGGCGACCACCGAGATCTACA CTCTTTCCCTACACGACGCTCTTCCGATCT; R(5′-3′): CAAGCAGAAGACGGCATACGAGATAAGAGATGTGT GACTGGAGTTCAGACGTGTGCTCTTCCGA |
| 2nd PCR for illumina sequencing_003 | This paper | F(5′-3′): AATGATACGGCGACCACCGAGATCTACA CTCTTTCCCTACACGACGCTCTTCCGATCT; R(5′-3′): CAAGCAGAAGACGGCATACGAGATCTTCACACAGTG ACTGGAGTTCAGACGTGTGCTCTTCCGA |
| 2nd PCR for illumina sequencing_004 | This paper | F(5′-3′): AATGATACGGCGACCACCGAGATCTACAC TCTTTCCCTACACGACGCTCTTCCGATCT; R(5′-3′): CAAGCAGAAGACGGCATACGAGATCAAATCGGAGT GACTGGAGTTCAGACGTGTGCTCTTCCGA |
| 2nd PCR for illumina sequencing_005 | This paper | F(5′-3′): AATGATACGGCGACCACCGAGATCTACACTC TTTCCCTACACGACGCTCTTCCGATCT; R(5′-3′): CAAGCAGAAGACGGCATACGAGATGGTCCCTAAGTG ACTGGAGTTCAGACGTGTGCTCTTCCGA |
| 2nd PCR for illumina sequencing_006 | This paper | F(5′-3′): AATGATACGGCGACCACCGAGATCTACACTC TTTCCCTACACGACGCTCTTCCGATCT; R(5′-3′): CAAGCAGAAGACGGCATACGAGATCCTTCTGTGGTGAC TGGAGTTCAGACGTGTGCTCTTCCGA |
| 2nd PCR for illumina sequencing_007 | This paper | F(5′-3′): AATGATACGGCGACCACCGAGATCTACACT CTTTCCCTACACGACGCTCTTCCGATCT; R(5′-3′): CAAGCAGAAGACGGCATACGAGATTCCGTATTAGTGAC TGGAGTTCAGACGTGTGCTCTTCCGA |
| 2nd PCR for illumina sequencing_008 | This paper | F(5′-3′): AATGATACGGCGACCACCGAGATCTACAC TCTTTCCCTACACGACGCTCTTCCGATCT; R(5′-3′): CAAGCAGAAGACGGCATACGAGATACTTGGGCAGT GACTGGAGTTCAGACGTGTGCTCTTCCGA |
| 2nd PCR for illumina sequencing_009 | This paper | F(5′-3′): AATGATACGGCGACCACCGAGATCTACAC TCTTTCCCTACACGACGCTCTTCCGATCT; R(5′-3′): CAAGCAGAAGACGGCATACGAGATTCCTCCAAAG TGACTGGAGTTCAGACGTGTGCTCTTCCGA |
| 2nd PCR for illumina sequencing_010 | This paper | F(5′-3′): AATGATACGGCGACCACCGAGATCTACACTCT TTCCCTACACGACGCTCTTCCGATCT; R(5′-3′): CAAGCAGAAGACGGCATACGAGATTAGCAAAACG TGACTGGAGTTCAGACGTGTGCTCTTCCGA |
| Myt1l qPCR | This paper | F(5′-3′): ACTATCAAGCAGCGAGCCAG R(5′-3′): CATGTCAGCCTCCATCTGGG |
| Gapdh qPCR | This paper | F(5′-3′): AGGTCGGTGTGAACGGATTTG R(5′-3′): GGGGTCGTTGATGGCAACA |
| β-actin qPCR | This paper | F(5′-3′): CAATAGTGATGACCTGGCCGT R(5′-3′): AGAGGGAAATCGTGCGTGAC |
| Hdac6 qPCR | This paper | F(5′-3′): TCCACCGGCCAAGATTCTTC R(5′-3′): GCCTTTCTTCTTTACCTCCGCT |
| Mcm5 qPCR | This paper | F(5′-3′): CAGAGGCGATTCAAGGAGTTC R(5′-3′): CGATCCAGTATTCACCCAGGT |
| Rnc2 qPCR | This paper | F(5′-3′): CTGTGACGTGGGATGAGTACA R(5′-3′): GACCTGAATCCTGGTTAGCTTTT |
| ATAC-seq i5 adapter_001 | This paper | AATGATACGGCGACCACCGAGATCTACACGTAAGGA GTCGTCGGCAGCGTCAGATGTG |
| ATAC-seq i5 adapter_002 | This paper | AATGATACGGCGACCACCGAGATCTACACCTCTCTA TTCGTCGGCAGCGTCAGATGTG |
| ATAC-seq i5 adapter_003 | This paper | AATGATACGGCGACCACCGAGATCTACACTATC CTCTTCGTCGGCAGCGTCAGATGTG |
| ATAC-seq i7 adapter_001 | This paper | ACATCTCCGAGCCCACGAGACTAAGGCGAATCTC GTATGCCGTCTTCTGCTTG |
| ATAC-seq i7 adapter_002 | This paper | ACATCTCCGAGCCCACGAGACCGTACTAGATCT CGTATGCCGTCTTCTGCTTG |
| ATAC-seq i7 adapter_003 | This paper | ACATCTCCGAGCCCACGAGACAGGCAGAAATC TCGTATGCCGTCTTCTGCTTG |
| ATAC-seq i7 adapter_004 | This paper | ACATCTCCGAGCCC ACGAGACTCCTGAGCATCTCGTA TGCCGTCTTCTGCTTG |
| ATAC-seq i7 adapter_005 | This paper | ACATCTCCGAGCCCACGAGACGGACTCCTATC TCGTATGCCGTCTTCTGCTTG |
| ATAC-seq i7 adapter_006 | This paper | ACATCTCCGAGCCCACGAGACTAGGCATGATCT CGTATGCCGTCTTCTGCTTG |
| ATAC-seq i7 adapter_007 | This paper | ACATCTCCGAGCCCACGAGACCTCTCTACAT CTCGTATGCCGTCTTCTGCTTG |
| ATAC-seq i7 adapter_008 | This paper | ACATCTCCGAGCCCACGAGACCAGAGAGGAT CTCGTATGCCGTCTTCTGCTTG |
| ATAC-seq i7 adapter_009 | This paper | ACATCTCCGAGCCCACGAGACGCTACGCTAT CTCGTATGCCGTCTTCTGCTTG |
| ATAC-seq i7 adapter_010 | This paper | ACATCTCCGAGCCCACGAGACCGAGGCTGAT CTCGTATGCCGTCTTCTGCTTG |
| ATAC-seq i7 adapter_011 | This paper | ACATCTCCGAGCCCACGAGACGTAGAGGAAT CTCGTATGCCGTCTTCTGCTTG |
| ATAC-seq i7 adapter_012 | This paper | ACATCTCCGAGCCCACGAGACGTCGTGATAT CTCGTATGCCGTCTTCTGCTTG |
| ATAC-seq i7 adapter_013 | This paper | ACATCTCCGAGCCCACGAGACACCACTGTATCT CGTATGCCGTCTTCTGCTTG |
| ATAC-seq i7 adapter_014 | This paper | ACATCTCCGAGCCCACGAGACTGGATCTGATCT CGTATGCCGTCTTCTGCTTG |
| ATAC-seq i7 adapter_015 | This paper | ACATCTCCGAGCCCACGAGACCCGTTTGTATCT CGTATGCCGTCTTCTGCTTG |
| ATAC-seq i7 adapter_016 | This paper | ACATCTCCGAGCCCACGAGACTGCTGGGTATC TCGTATGCCGTCTTCTGCTTG |
| ATAC-seq i7 adapter_017 | This paper | ACATCTCCGAGCCCACGAGACAGGTTGGGATC TCGTATGCCGTCTTCTGCTTG |
| ATAC-seq i7 adapter_018 | This paper | ACATCTCCGAGCCCACGAGACAAGAGGCAATC TCGTATGCCGTCTTCTGCTTG |
| Software and algorithms | ||
| R | https://www.r-project.org/ | R version 4.0.0 |
| Fiji / ImageJ | https://fiji.sc | v2.0.0 |
| GraphPad Prism | https://www.graphpad.com | v8.0 |
| FastQC | https://www.bioinformatics.babraham.ac.uk/projects/fastqc/ | v0.11.9 |
| Trimmomatic | Bolger et al., 2014 | v0.39 |
| Bowtie2 | http://bowtie-bio.sourceforge.net/bowtie2/index.shtml | v2.4.0 |
| STAR | https://github.com/alexdobin/STAR | v2.7.0 |
| ITK-SNAP | http://www.itksnap.org/pmwiki/pmwiki.php | v3.8.0 |
| Samtools | http://www.htslib.org | v1.12 |
| Picard | https://github.com/broadinstitute/picard/releases/tag/2.25.2 | v2.25.2 |
| Macs2 | Zhang et al., 2008 | N/A |
| Homer | Heinz et al., 2010 | v4.11 |
| edgeR | Robinson et al., 2010 | v3.12 |
| RUVseq | Risso et al., 2014 | v3.12 |
| DeepTools | https://deeptools.readthedocs.io/en/develop/ | v2.0 |
| HTSeq | Anders et al., 2015 | v0.11.1 |
| Cytoscape | https://cytoscape.org/ | v3.8.0 |
| GSEA | Subramanian et al., 2005 | v4.0.3 |
| BioMart | Durinck etal., 2009 | N/A |
| ChIPpeakAnno | Zhu et al., 2010 | v2.0.5 |
| Metagene2 | https://github.com/ArnaudDroitLab/metagene2 | v3.13 |
| BioRender | https://app.biorender.com/ | |
Western blot
Mice brains or cortex were dissected out at different developmental stages and homogenized in lysis buffer (50 mMTris-HCl, pH 7.4, 100 mM NaCl, 3 mM MgCl2, 1% IGEPAL CA-630, 10 mM NaF, 10 mM Na3Vo4 with Protease inhibitors). After centrifugation, supernatants were collected, and protein concentration was measured by BCA assay. For each sample, 20 μg of protein was run on the 7.5% BioRad precast gel and transferred to the PVDF membrane. We blocked the membrane using TBST with 3% BSA for 2 hours at room temperature (RT). Then, the membrane was incubated with anti-MYT1L (1:500, 25234-1-AP, Proteintech) and anti-GAPDH (1:5000, G8795, Sigma) primary antibodies overnight at 4°C and then incubated with HRP conjugated anti-Mouse (1:2000, 1706516, BioRad) and anti-goat (1:2000, AP307P, Millipore) for one hour at RT. After washing, the membrane was developed in BioRad ECL Western Blotting Substrates and imaged with myECL Imager (Thermo Fisher). Fluorescent intensity was measured by ImageJ and MYT1L expression was normalized to GAPDH. To compare MYT1L protein expression between genotypes, we put 3 WT and 4 Het brains into Western Blot procedure.
Immunofluorescence
Mice brains were dissected out at different developmental stages and fixed in 4% paraformaldehyde (PFA) overnight at 4°C. After gradient sucrose dehydration and O.C.T. compound embedding, brains were sectioned using Leica Cryostat (15 μm for E14 brains and 30 μm for postnatal brains). Antigen retrieval was performed by boiling sections in 95°C 10 nM sodium citrate (pH 6.0, 0.05% Tween-20) for 10 mins. Then, sections were incubated in the blocking buffer (5% normal donkey serum, 0.1% Triton X-100 in PBS) at RT for 1 hour. Primary antibodies, including anti-MYT1L (1:500, 25234-1-AP, Proteintech), anti-MAP2 (1:200, #188044, SYSY), anti-SOX2 (1:200, sc-17320, Santa Cruz), anti-TBR2 (1:400, AB15894, Millipore), anti-Ki-67 (1:500, #14-5698-82, Invitrogen), anti-CTIP2 (1:500, ab18465, Abcam), anti-BRN2 (1:500, sc-393324, Santa Cruz), anti-NEUN (1:500, #12943, Cell Signaling), anti-GFAP (1:500, ab53554, Abcam), anti-OLIG2 (1:200, AF2418, R&D Systems), and anti-TBR1 (1:500, ab31940, Abcam) were used to detect different cell markers. Next, sections were incubated in fluorescence conjugated secondary antibodies, including donkey anti-rabbit (Alexa 488, 546, and 647, Invitrogen), donkey anti-mouse (Alexa 546, Invitrogen), donkey anti-chicken (Alexa 488, Jackson ImmunoResearch), donkey anti-rat (Alexa 488 and 647, Invitrogen), and donkey anti-goat (Alexa 488 and 647, Jackson ImmunoResearch) at 1:500 dilution for 2 hours in RT. Images were captured under Zeiss Confocal Microscope or Zeiss Axio Scan Slide Scanner and cell counting was performed using ImageJ. In order to compare cell numbers of different cell types across genotypes, we had 5 WT, 6 Het, and 5 KO E14 brains for cell counting experiments (Figure 4A). And we had 6 WT, 6 Het, and 5 KO E14 brains to quantify the Ki-67 positive cells (Figures 4G and 4H).
Sanger sequencing
Genomic DNA (gDNA) was extracted from mouse tissue by QIAGEN Blood and Tissue Kit. a 2.2kb gDNA fragment flanking the G duplication site was amplified using the primers (Key Resources Table), Phusion, and following program: 98°C for 2 min, 98°C for 10 s, 60°C for 20 s, 72°C for 1 min, repeat 2-4 for 30 cycles, 72°C for 5 min, and hold at 4°C. PCR products were purified with QIAquick PCR Purification Kit and submitted for sanger sequencing at Genewiz. We used Snapgene to check and visualize sanger sequencing results.
Illumina sequencing
gDNA and cDNA library from mice brains was generated as described in the above sections. To prepare sequencing libraries, we performed two-step PCR to first tag 200bp DNA fragments flaking the mutation site with Illumina adapters (Taq, primers seen Key Resources Table, PCR program: 94°C for 3 min, 94°C for 10 s, 58°C for 20 s, 68°C for 1 min, repeat 2-4 for 30 cycles, 68°C for 5 min, and hold at 4°C) and then add unique index to individual samples (Taq, primers seen supplemental tables, PCR program: 98°C for 3 min, 98°C for 10 s, 64°C for 30 s, 72°C for 1 min, repeat 2-4 for 20 cycles, 72°C for 5 min, and hold at 4°C). Final PCR products were purified by gel extraction using QIAGEN Gel Extraction Kit and submit for 2×150 Illumina sequencing to CGSSB at Washington University School of Medicine. For each sample, we were able to get ~80,000 reads. We conducted quality control on raw reads using FastQC. Then, reads were trimmed by Trimmomatic software and aligned to the mouse genome by STAR. We used VarScan and Samtools to determine the percentage of the mutation in gDNA (n = 8) and cDNA (n = 8) samples.
Nissl staining
Following perfusion with 4% paraformaldehyde, the brains were removed, weighed (WT n = 5, Het n = 6), sectioned coronally using a vibratome at 70 μm, and then mounted onto gelatin coated slides (WT n = 8, Het n = 9). Sections were then rehydrated for 5 minutes in xylene, xylene, 100% ethanol, 100% ethanol, 95% ethanol, 70% ethanol, and deionized water. Using 0.1% cresyl violet at 60°C, sections were stained for two hours and rinsed with two exchanges of deionized water. Differentiation began with 30 s rinses in 70% ethanol, 80% ethanol, and 90% ethanol. Next, a two-minute rinse in 95% ethanol was done, checking microscopically for a clearing background. This was followed by a 30 s rinse in two exchanges of 100% ethanol, a 15-minute rinse using 50% xylene in ethanol, and a 1-hour rinse of xylene. Finally, the sections were mounted and coverslipped using DPX mountant. Whole and regional volumes were outlined by a rater blind to treatment using Stereoinvestigator Software (v 2019.1.3, MBF Bioscience, Williston, Vermont, USA) running on a Dell Precision Tower 5810 computer connected to a QImaging 2000R camera and a Labophot-2 Nikon microscope with electronically driven motorized stage.
In vivo magnetic resonance imaging (MRI): data acquisition
All animal experiments were approved by Washington University’s Institutional Animal Care and Use Committee. MRI experiments were performed on a small-animal MR scanner built around an Oxford Instruments (Oxford, United Kingdom) 4.7T horizontal-bore superconducting magnet and equipped with an Agilent/Varian (Santa Clara, CA) DirectDrive™ console. Data were collected with a laboratory-built, actively-decoupled 7.5-cm ID volume coil (transmit)/1.5-cm OD surface coil (receive) RF coil pair. Mice were anesthetized with isoflurane/O2 (1.2% v/v) and body temperature was maintained at 37 ± 1°C via circulating warm water. Mouse respiratory rate (50-70 breaths/minutes) and body temperature (rectal probe) were monitored with a Small Animal Instruments (SAI, Stony Brook, NY) monitoring and gating unit.
T2-weighted transaxial images (T2W) were collected with a 2D fast spin-echo multi-slice (FSEMS) sequence: echo train length = 4, kzero = 4, repetition time (TR) = 1.5 s, effective echo time (TE) = 60 ms; field of view (FOV) = 24 × 24 mm2, matrix size = 192 × 192, slice thickness = 0.5 mm, 21 slices, 4 averages. Co-registered T1-weighted images (T1W) were collected with a 2D spin-echo multi-slice (SEMS) sequence: TR = 0.8 s, TE = 11.3 ms, 2 averages.
Diffusion Tensor Imaging (DTI) measures the directional water movement along and perpendicular to axons (fractional anisotropy: FA) as a measure of white-matter integrity, and the same images can be used for structural assessments. DTI data were collected using a multi-echo, spin-echo diffusion-weighted sequence with 25-direction diffusion encoding, max b-value = 2200 s/mm2. Two echoes were collected per scan, with an echo spacing of 23.4 ms, and combined offline to increase signal-to-noise ratio (SNR), resulting in a SNR improvement of 1.4x compared with a single echo. Other MR acquisition parameters were TR = 1.5 s, TE = 32 ms, length of diffusion-encoding gradients (δ) = 6 ms, spacing between diffusion gradients (Δ) = 18 ms, FOV = 24 mm x 24 mm, matrix size = 192 × 192, slice thickness = 0.5 mm, 21 slices, 1 average. The total acquisition time was approximately 2 hours and 5 minutes.
DTI data analysis
DTI datasets were analyzed in MATLAB (The MathWorks®, Natick MA). Following zero-padding of the k-space data to matrix size 384 × 384, the data were Fourier-transformed and the images from the two spin echoes were added together. A 3 × 3 Gaussian filter (Sigma = 0.7) was applied and the resulting images were fit as a mono-exponential decay using the standard MR diffusion equation (Stejskal and Tanner, 1965):
in which S is the diffusion-weighted signal intensity, S0 the signal intensity without diffusion weighting, γ is the gyromagnetic ratio, G is the gradient strength, and D is the diffusion coefficient. Eigenvalues (λ1,λ2,λ3) corresponding to the diffusion coefficients in three orthogonal directions were calculated and parametric maps of apparent diffusion coefficient (ADC), axial diffusion (Daxial), radial diffusion (Dradial), and fractional anisotropy (FA) were calculated according to standard methods (Basser and Pierpaoli, 2011; Mori, 2007). Parametric maps were converted into NIfTI (.nii) files for inspection and segmentation in ITK-SNAP (http://www.itksnap.org/pmwiki/pmwiki.php). We ended up analyzing 8 WT mice and 6 Het mice.
ATAC-seq
ATAC-seq was performed as described before (Buenrostro et al., 2015). Briefly, mouse E14 cortex (6 WT, 5 Het, and 6 KO E14 cortex) or adult PFC (P60-P70) was dissected and gently homogenized in cold nuclear isolation buffer (10 mM Tris-HCl, pH 7.4, 10 mM NaCl, 3 mM MgCl2, 0.1% IGEPAL CA-630). Embryonic tissues were pooled across sexes, adult tissues included both sexes, balanced for genotype. Lysates were filtered through 40 μm mesh strainer. After spinning down, 100,000 nuclei were put into the tagmentation reaction for each sample. We had 6 WT, 5 Het and 6 KO cortex for embryonic experiments. For adult PFC experiments, we put 6 WT and 6 PFC into the pipeline. Tagmentation reaction was performed using Illumina Tagment DNA TDE1 Enzyme and Buffer Kit with 30 min incubation time at 37°C. Immediately following the tagmentation, we purified DNA fragments using QIAquick PCR Purification Kit. We took half amount of purified DNA fragments and added Illumina Nextera i5+i7 adapters with unique index to individual samples by PCR reaction (Phusion, primers seen in Key Resources Table, PCR program: 72°C for 5 min, 98°C for 30 s, 98°C for 10 s, 63°C for 30 s, 72°C for 1 min, repeat 3-5 for 8-10 cycles, and hold at 10°C). Generated libraries were purified using AMpure beads(1:1.8 dilution). We ran Tapestation for libraries and checked the nucleosome peaks pattern as quality control. Finally, libraries were submitted to GTAC Washington University School of Medicine for Novaseq aiming for 50M reads per sample.
DAR analysis
Raw reads were trimmed by Trimmomatic software to remove adaptor sequence. We used FastQC to check reads quality before and after trimming. Then reads were mapped to mm10 genome by Bowtie2. We filtered out mitochondrial reads (Samtools), PCR duplicates (Picard), non-unique alignments (MAPQ > 30), and unmapped reads (Samtools). Then a series of QC metrics were examined to ensure ATAC experiments worked well, including insert size distribution, mitochondria reads percentage, non-redundant reads percentage, and TSS enrichment. To adjust read start sites, we shifted reads aligned to + strand by +4bp and reads aligned to - strand by −5 bp by bedtools and awk. After shifting, we merged bam files for all samples in one specific time stage (E14 or adult) together and performed peak calling by MACS2 with q < 0.05. Peaks were annotated by Homer software. In order to perform differential accessible region analysis, we derived peaks read counts from individual sample’s shifted bam file using bedtools. With read counts, utilized edgeR package to identify DARs. Briefly, we first checked library size, read counts distribution, Pearson correlation, and multidimensional scale plots and identified no obvious outlier sample. Then we normalized reads and removed unwanted variables using the RUVseq package. For E14 cortex ATAC-seq, we fitted the data into a nested interaction model to identify altered chromatin accessibility across all genotypes (WT, Het, and KO). And we considered peaks with the same significant fold change (FDR < 0.1) direction in Het and KO as true DARs. For adult PFC, a negative binomial generalized linear model was fitted and sex was counted as covariate when testing for DARs (FDR < 0.1). Heatmaps for DARs were generated by deepTools. TSS peaks were defined as ± 1kb from TSS and all other peaks were considered non-TSS peaks. Metagene2 and ggplot2 were used to extract read depths for example loci and generate average coverage with 95% confidence intervals. MYT1L ChIP targets from Mall et al.’s Table S2 were mapped to ATAC-seq datasets by bedTools and we defined overlapping peaks between the two with 1kb maximum gap. Motif analysis was performed using Homer software on DARs (FDR < 0.1). We used more-accessible regions as background when finding motifs for less-accessible regions and vice versa.
RNA-seq
Embryonic cortex and adult PFC (P60-P70) was dissected out and RNA was extracted as described above. Embryonic tissues were pooled across sexes, adult Adult tissues included both sexes, balanced for genotype. Total RNA integrity was determined using Agilent 4200 Tapestation. Library preparation was performed with 10ng of total RNA with a RIN score greater than 8.0. ds-cDNA was prepared using the SMARTer Ultra Low RNA kit for Illumina Sequencing (Takara-Clontech) per manufacturer’s protocol. cDNA was fragmented using a Covaris E220 sonicator using peak incident power 18, duty factor 20%, cycles per burst 50 for 120 s. cDNA was blunt ended, had an A base added to the 3′ ends, and then had Illumina sequencing adapters ligated to the ends. Ligated fragments were then amplified for 15 cycles using primers incorporating unique dual index tags. Fragments were sequenced on an Illumina NovaSeq-6000 using paired end reads extending 150 bases. Again, raw reads were trimmed by Trimmomatic software to remove adaptor sequence and we used FastQC to check reads quality before and after trimming. rRNA reads were filtered out by Bowtie2. And filtered reads were mapped to the mouse mm10 genome by STAR. Read counts for genes were derived by HTSeq software for individual samples. We checked read counts distribution, junction saturation, library size, Pearson correlation and multidimensional scale plots to rule out any outliers. In the end, we were able to put 6 WT, 6 Het, 4 KO E14 cortex and 6 WT, 6 Het adult PFC into the DGE analysis pipeline.
Differential gene expression analysis
Similar to DAR analysis, we normalized raw counts and removed unwanted variables with the edgeR and RUVseq package. A nested interaction model was fitted to identify differential gene expression across genotypes for E14 cortex RNA-seq. DEGs with the same significant fold change direction in both Het and KO samples were considered as true MYT1L regulated genes and were subjected to downstream analysis. For adult PFC RNA-seq, we fitted the data to a negative binomial generalized linear model with sex as covariates. We applied cut-off FDR < 0.1 to define DEGs. Heatmaps for DEGs were generated by heatmap.2 function in R.
GO analysis
To perform GO analysis on DARs, we assigned DARs (FDR < 0.1) located within ± 1kb from TSS to corresponding genes. GO analysis was performed using BiNGO in Cytoscape. p values were adjusted by Benjamini-Hochberg FDR correction and FDR < 0.05 cut-off was used to determine significant enrichments. The same software and corrected p value cut-off was applied to GO analysis on DEGs (FDR < 0.1) in RNA-seq. Full GO analysis results can be seen in Table S4.
GSEA analysis
GSEA was performed as described before (Subramanian et al., 2005) using GSEA v4.0.3 (https://www.gsea-msigdb.org/gsea/index.jsp). We first examined gene set collections H (Hallmark gene sets) and C2 (curated gene sets of online pathway databases) to understand how MYT1L loss affects different cellular processes in a comprehensive manner. Then we tested the expression changes of MYT1L ChIP targets, human “early-fetal” and “mid-fetal” genes (Kang et al., 2011; Katayama et al., 2016), MEF signature genes, induced neuron signature genes on E14 cortex and adult PFC expression data (See Table S3), Wnt signaling genes (MGI GO:0016055), and Notch signaling genes (MGI GO:0007219). Human gene IDs were converted into mouse gene IDs by BioMart (https://www.ensembl.org/biomart). All analysis was performed with “gene_set” as permutation type and 1,000 permutations. Significant enrichment was determined by FDR < . 1 cut-off.
Comparison between in vivo and in vitro RNA-seq
In vitro RNA-seq data were obtained from Mall et al., 2017 studies on MYT1L overexpression (OE) in MEF and shRNA knockdown (KD) in primary hippocampal neuron cultures (Mall et al., 2017). We defined genes that showed upregulation in OE but downregulation in KD as MYT1L induced genes, while genes getting downregulated in OE but upregulated in KD were considered as MYT1L repressed genes. Then, the hypergeometric test was performed to determine whether there is significant overlapping between DEGs from our in vivo RNA-seq experiments and previously reported MYT1L targeted genes in vitro. We also used R to investigate linear regression of DEGs’ fold changes between in vivo and in vitro RNA-seq experiments.
Disease models and human genetic datasets enrichment
DEGs of different ID/ASD related mouse model were derived from CHD8 haploinsufficient cortex (p < 0.05 for E14.5, FDR < 0.1 for P77)(Gompers et al., 2017), KDM5C KO frontal cortex (p < 0.01)(Iwase et al., 2016), CHD2 haploinsufficient embryonic cortex (p < 0.05) and P30 hippocampus (FDR < 0.1)(Kim et al., 2018), PHF6 KO cortex (FDR < 0.05)(Cheng et al., 2018), FOXP1 KO hippocampus (FDR < 0.05)(Araujo et al., 2015), and POGZ cKO hippocampus (FDR < 0.05)(Suliman-Lavie et al., 2020). For human diseases genetic datasets, we downloaded ASD genes from SFARI (huamn module, gene score 1 and 2), ADHD genes from ADHDgene (http://adhd.psych.ac.cn/), ID genes from IDGenetics (http://www.ccgenomics.cn/IDGenetics/), SCZ genes from SZDB2.0 SNP datasets (http://www.szdb.org/), and Microcephaly genes from DisGeNET (https://www.disgenet.org/home/). Enrichment analysis was performed using the one-sided hypergeometric test and p values were adjusted by Benjamini-Hochberg correction.
EdU labeling
We performed intraperitoneal injection on E14 timed-pregnant females with EdU solution (50mg/kg). For the cell proliferation assay, we waited for 1.5 hours before harvesting embryonic brains. Brains were dissected and fixed with 4% PFA at 4°C overnight. Then we dehydrated and sectioned brains into 15 μm sections on glass slides as described in the immunofluorescence session. Those sections were subjected to EdU detection assay using Click-iT EdU Cell Proliferation Kit for Imaging Alexa Fluor-594 (Invitrogen) with manufacturer instructions. 4 animals per genotype were used for the cell proliferation assay.
For the cell cycle existing assay, we waited for 20 hours before harvesting brains. The same procedure was conducted on fixed brains to get 15 μm sections. Then, antigen retrieval was performed by boiling sections in 95°C 10 nM sodium citrate (pH 6.0, 0.05% Tween-20) for 10 mins. Brain sections were first incubated with anti-Ki-67 primary antibody and Alexa488-fluorescence conjugated secondary antibody before EdU detection assay. EdU+/Ki67+ cells represent neuronal progenitors that remained in the cell cycle, while EdU+/Ki67− cells represent differentiating progenitors that exited the cell cycle. We calculated the Q fraction values as the ratio between EdU+/Ki67− cells and total EdU+ cells to assess the portion of cells starting differentiation within the 20-hour time window. All images were captured under Zeiss Confocal Microscope and cell counting was performed using ImageJ. 4 animals per genotype were used for cell cycle existing assay.
Slice preparation
Coronal brain slices (325 μm) containing V1 were obtained as previously described (Lambo and Turrigiano, 2013) using chilled (1°C) standard artificial CSF (ACSF). ACSF was continuously oxygenated and contained the following (in mm): 126 NaCl, 3 KCl, 2 MgSO4, 1 NaHPO4, 25 NaHCO3, 2 CaCl2, and 14 Dextrose. Slices were cut on a Leica VT1000S vibratome and incubated on a semipermeable membrane covered by room temperature oxygenated standard ACSF.
Slice electrophysiology
V1m was identified, and whole-cell patch-clamp recordings obtained from layer 2/3 pyramidal neurons, as previously described (Lambo and Turrigiano, 2013). In brief, V1m was identified using the mouse brain atlas after adjusting for the lambda-bregma distance for age. The shape and morphology of the white matter were used to identify V1m. Neurons were visualized with a 40 × water-immersion objective using infrared-differential interference contrast optics. Internal recording solution contained (mm): 20 KCl, 100 K-gluconate, 10 HEPES, 4 Mg-ATP, 0.3 Na-GTP, 10 phosphocreatine, and 0.4% biocytin. For AMPA miniature EPSC (mEPSC) recordings, neurons were voltage-clamped to −70 mV in standard ACSF containing TTX (0.2 μm), APV (50 μm), and picrotoxin (20 μm) and warmed to 33°C. For AMPA miniature IPSC (mIPSC) recordings, internal recording solution contained (mM): 120 KCl, 10 HEPES, 4 Mg-ATP, 0.3 Na-GTP, 2.5 phosphocreatine, and 0.2% biocytin. Neurons were voltage-clamped to −70 mV in standard ACSF containing TTX (0.2 μm), APV (50 μm), and DNQX (20 μm). For all recordings, Neurons were excluded from analyses if the resting membrane potential was more positive than −50 mV, input resistance was < 40 MΩ, series resistance was > 20 MΩ, or if any of these parameters changed by > 20% during the recording. Pyramidal neurons were identified by the presence of an apical dendrite and tear-drop shaped soma and morphology was confirmed by post hoc reconstruction of biocytin fills, as described previously (Desai et al., 2002). All physiology data were analyzed using Clampfit (Molecular Devices) and custom software written in Python (available at https://github.com/hengenlab). We recorded 24 neurons from 9 WT animals and 22 neurons from 9 Het animals to compare the passive properties as well as mEPSC (100 events for each recorded neuron) activities across genotypes. We also recorded the mIPSC of 17 neurons from 5 WT animals and 22 neurons from 5 Het animals to assess the E/I balance.
Neuronal morphology analysis
Brain slices from slice electrophysiology were subjected to histochemical analysis using NEUN antibody to confirm neuron identity and streptavidin Alex Fluor-568 (Invitrogen) to label injected biocytin for morphology assessment. Stained sections were mounted in cell gasket with SlowFade Diamond Antifade Mountant (Invitrogen). Images for neuronal body and dendrites were taken under Zeiss LSM 880 Airyscan Confocal Microscope. We used Neurolucida 360 (https://www.mbfbioscience.com/neurolucida360) to trace the neuronal body (15 neurons from 8 WT animals, 14 neurons from 8 Het animals) and dendrites (10 neurons from 5 WT animals, 10 neurons from 6 Het animals) and count different types of dendritic spines (10 neurons from 4 WT animals, 7 neurons from 4 Het animals). Branch analysis and Sholl analysis were performed using Neurolucida Explorer (https://www.mbfbioscience.com/neurolucida-explorer). Then we exported measurements for soma surface area, soma volume, total dendrite number, total dendritic length, average dendrite length, dendrite node number, and complexity ([Sum of the terminal orders + Number of terminals] * [Total dendritic length / Number of primary dendrites]), branch number, branch length, total spine density, and density of different spine subtypes to compare neuron morphological maturation between Hets and WTs.
Behavioral analysis
Animals and experimental design
The behavior phenotypes we investigated were chosen based on the symptom profile of the index patient and that of the greater MYT1L deletion population. We examined the phenotypes of two independent cohorts. The first cohort comprised 57 Het (26 female and 31 male) and 55 WT (29 female and 26 male) mice and was used to assess the first three weeks of postnatal development for gross, motor and communicative delays (Table S6). The second cohort comprised 20 Het (10 female and 10 male) and 21 WT (13 female and 8 male) mice. One female Het died after social operant testing, two male Hets died one month after conditioned fear testing, and another male Het died before T-maze testing. A third cohort comprising 16 WT (8 female and 8 male) and 14 Het (8 female and 6 male) mice was assayed for cognitive inflexibility in the T-maze. These mice were characterized beginning as juveniles and continued through adulthood, and assessed for behavioral features related to the neuropsychiatric diagnoses of our index patient (Table S6). A fourth cohort comprising 23 WT (9 female and 14 male) and 19 Het (11 female and 8 male) mice was assessed for tactile sensitivity using the von Frey filaments. ASD-related repetitive and social behaviors were investigated in the force-plate actometer, spontaneous alternation T-maze, the von Frey assessment of tactile sensitivity, social operant task, social dominance task, and three-chambered social approach assay. ADHD-related hyperactivity was assessed specifically using the open field task, but we also examined general activity across any task in which we conducted subject tracking. We looked at behaviors relevant to ID in the Barnes maze and fear conditioning tasks. To assess mature sensory and motor function, we used a battery of sensory motor tasks and the prepulse inhibition/startle apparatus. Finally, we documented weight throughout the life span, and performed assessments of physical features and posture to identify any dysmorphia. A male experimenter conducted the ultrasonic vocalization recordings, and a female experimenter conducted the remainder of the behavioral testing. Each experimenter was blinded to experimental group designations during testing, which occurred during the light phase. Order of tests was chosen to minimize the effects of stress. Animals were acclimated to the testing rooms 30 - 60 min prior to testing.
Developmental assessment
During the first three weeks postnatal, we assessed the Myt1l Het and WT littermates for signs of gross developmental delay, communicative delay or motor delay, which are universal in MYT1L deletion patients (Blanchet et al., 2017) (See Table S6). To evaluate gross development, the mice were weighed daily from P5 - P21, and evaluated for physical milestones of development including pinna detachment by P5 and eye opening by P14. While human language cannot be explored in mice, vocal communication behavior is conserved across taxa (Ehret, 1980). Mouse pups produce isolation calls as a way to attract the dam for maternal care (Haack et al., 1983), thus it is one of the earliest forms of social communication we can examine in mice. This behavior also has a developmental trajectory, beginning just after birth, peaking during the first week postnatal and disappearing around P14, making it useful for examining delay in early social circuits. Ultrasonic vocalizations (USVs) were recorded on P5, P7. P9 and P11 following our previous methods (Maloney et al., 2018a). Briefly, the dam was removed from the nest and the litter placed in a warming cabinet. The surface temperature of each pup was recorded (HDE Infrared Thermometer; Het: M = 35.4°C, SD = 0.90; WT: M = 35.2°C, SD = 1.16), and then the pup was placed in an empty cage (28.5 × 17.5 × 12 cm) in a sound-attenuating chamber. USVs were recorded for three minutes using an Avisoft UltraSoundGate CM16 microphone, Avisoft UltraSoundGate 116H amplifier, and Avisoft Recorder software (gain = 3 dB, 16 bits, sampling rate = 250 kHz). The pup was then removed, weighed, tissue collected for genotyping (P5 only), and returned to the nest. Following recording of the last pup, the dam was returned to the nest. Frequency sonograms were prepared from recordings in MATLAB (frequency range = 25 kHz to 120 kHz, FFT size = 512, overlap = 50%, time resolution = 1.024 ms, frequency resolution = 488.2 Hz). Individual syllables and other spectral features were identified and counted from the sonograms as previously described (Holy and Guo, 2005; Rieger and Dougherty, 2016).
Possible motor delay was assessed with a battery of tasks conducted during the first two weeks postnatal (Feather-Schussler and Ferguson, 2016), which assess the acquisition of motor function, including ambulation, posture, reflexes, and muscle strength and endurance (See Table S6). A few of key reflexes appear in mouse pups in the first week, including the righting, grasping and negative geotaxis reflexes at about P5-P7. To assess surface righting reflex (P6 and P14), each pup was placed on its back in an empty cage lined with a plastic bench pad and the time to return to a prone position was recorded up to 60 s (Figure 7K). Three trials were averaged for analysis. Acquisition of grasping reflex was assessed (P6 and P14) by placing the blunt side of a razor blade against the palmar surface of each paw and recording the presence or absence of grasping (Figure 7J). Negative geotaxis was evaluated (P10) by placing the pup facing downward on a 45° incline (Figure 7L). The time up to two min the pup required to turn 180° was recorded. Three trials were averaged for analysis. Mice start to ambulate at P5 by crawling and are fully walking by P10. So we examined their ambulation at P8 to identify any delays (Figure 7I). We also looked at the posture of their hindlimb – with maturation of ambulation, the hindlimb angle narrows. Each pup was placed in an empty cage (36.2 × 17.1 × 13 cm) and their ambulation was scored over a 3 min period using the following scale: 0 = no movement, 1 = crawling with asymmetric limb movement, 2 = slow crawling but symmetric limb movement, and 3 = fast crawling/walking. Video of ambulation was recorded at the same time and angle of the hindlimbs was measured with lines from mid-heel through middle digit across three separate frames, which were averaged for analysis. Muscle strength and endurance were assessed with forelimb and hindlimb suspension tests (P10 and P12, respectively) and grip strength (P10, 12 and 14). For forelimb suspension, each pup was allowed to grasp a wire strung across a pencil cup with felt padding with both forepaws (Figure 7M). Latency to release from the wire was recorded across three separate trials that were averaged for analysis. One influential outlier (z = 3.63) was excluded from analysis. Hindlimb suspension ability was measured by placing the pup facing downward into a 50 mL conical tube with the hindlimbs hung over the edge (Figure 7M). Latency to release from the conical edge was recorded across three separate trials that were averaged for analysis. Grip strength was measured by placing each pup in the middle of a horizontal fiberglass wire screen, and slowly rotating the screen vertically until inverted 180° (Figure 7N). The angle at which the pup fell from the screen onto a bench pad was recorded across three separate trials, which were averaged for analysis.
Open field
Locomotor ambulation was measured at P30 to assess activity, exploration, and anxiety-like levels in the open field assay similar to our previous work (Maloney et al., 2018b). Specifically, the behavior of each mouse was evaluated over a 1-hr period in a translucent acrylic apparatus measuring 59 × 39 × 22 cm (Figure S8A), housed inside a custom sound-attenuating chamber (70.5 × 50.5 × 60 cm), under approximately 9 lux illumination (LED Color-Changing Flex Ribbon Lights, Commercial Electric, Home Depot, Atlanta, GA). A CCTV camera (SuperCircuits, Austin, TX) connected to a PC computer running the software program ANY-maze (Stoelting Co., Wood Dale, IL; http://www.anymaze.co.uk/index.htm) tracked the movement of the mouse within the apparatus to quantify distance traveled, and time spent in and entries into the center 50% and outer perimeter zones. The apparatus was cleaned between animals with a 0.02% chlorhexidine diacetate solution (Nolvasan, Zoetis, Parsippany-Troy Hills, NJ).
Pose estimation (DeepLabCut (Mathis et al., 2018) and machine learning classification (SimBA (Nilsson et al., 2020)) were used to further quantify behaviors of the mice in videos recorded during the open field test. Specifically, we used DeepLabCut to estimate the pose of eight body parts of the mice, including nose, left ear, right ear, center, lateral left, lateral right, tail base, and tail end. A random subset of frames from all 41 videos were used for the network training. The trained network was then applied to all videos, yielding pose tracking files. The video and the tracking file of a Het female mouse were input to SimBA to build classifiers for jumping (Figure S8F), facial grooming, and body/tail grooming. A region of interest (ROI) defined as a rectangle covering the center area of the open field was appended to the machine learning features extracted from the tracking file. Then the training video was annotated for interesting behaviors using the SimBA event-logger. Random forest classifiers were trained using default hyperparameters, and classifier performances were evaluated. We set the discrimination threshold of jumping, facial grooming and body/tail grooming to 0.8, 0.444, and 0.521 respectively. The minimum behavior bout length (ms) for all behaviors was set to 200. In the end, the classifiers were applied to analyze all the videos. Facial grooming and body/tail grooming were combined for analyses. The descriptive statistics for each predictive classifier in the project, including the total time, the number of frames, total number of ‘bouts’, mean and median bout interval, time to first occurrence, and mean and median interval between each bout, were generated.
Force-plate actometer
At P36, the presence of stereotyped movements indicative of self-grooming (bouts of low mobility or movement during those bouts) and presence of tremor resulting from possible demyelination was assessed in the force-plate actometer (FPA; Figure S8H), as previously described (Reddy et al., 2012; Tischfield et al., 2017). The custom made FPA consisted of a carbon fiber/nomex composite material load plate measuring 24 × 24 cm surrounded by a clear polycarbonate cage (15 cm high) with a removable clear polycarbonate top perforated with ventilation holes, and housed in a sound-attenuating cabinet measuring 70.5 × 50.5 × 60 cm. Force was measured by summing the signal from four transducers, which is then expressed as a percentage of body weight. Grooming only takes place during low mobility bouts, as previously defined (Reddy et al., 2012) and validated (Tischfield et al., 2017). Raw data was acquired with a DOS-based Free Pascal program and further processed using custom MATLAB scripts(Fowler et al., 2001). To identify any tremor, each force time series was Fourier transformed to identify unique frequencies and plotted as a continuous function or power spectra. Tremor was identified as the frequency at peak power.
Barnes maze
Spatial learning and memory were evaluated in the Barnes maze using methods adapted from previous work (Pitts, 2018). The Barnes maze apparatus consisted of a circular white acrylic platform measuring 122 cm in diameter, with 20 equally spaced holes (5 cm in diameter) around the perimeter 6.35 cm from the edge, elevated 80 cm from the floor (Figures S7A and S7B). The maze was brightly lit with overhead lighting, and extra maze cues were used to aid learning. Testing comprised two acquisition trials separated by 45 minutes on each of 5 consecutive days. During acquisition trials, an escape box measuring 15.2 × 12.7 cm with an inclined entry was attached to the maze underneath one hole location (three escape locations were counterbalanced across mice). Prior to the first trial on the first day, each mouse was placed in the escape hole for 30 s covered by a clear acrylic tube. During each trial, a mouse was placed in the center of the maze facing a random direction, 75 dB white noise sounded until the mouse entered the escape box, which ended the trial. Each mouse was allowed to remain in the escape box for 30 s. If the mouse failed to enter the escape box, the trial would end after a maximum of three minutes and the mouse would be placed in the escape box for 30 s. On the sixth day, a three minute probe trial was conducted to assess each animal’s memory for the previously learned location of the escape box. The escape box was removed, and a mouse was placed in the center of the maze facing a random direction, and 75 dB white noise sounded until the end of the trial. A digital USB 2.0 CMOS Camera (Stoelting Co., Wood Dale, IL) connected to a PC computer running the software program ANY-maze (Stoelting Co., Wood Dale, IL; http://www.anymaze.co.uk/index.htm) tracked the movement of the mouse within the apparatus to quantify distance traveled, frequency and duration of visits to the escape box and to incorrect holes. All males were tested first, followed by the females. The apparatus was cleaned between animals with a 0.02% chlorhexidine diacetate solution (Nolvasan, Zoetis, Parsippany-Troy Hills, NJ).
Social operant
Social motivation, including social reward seeking and social orienting (Chevallier et al., 2012), was evaluated from P48-P60 using a social operant task adapted and extended from previous methods (Martin and Iceberg, 2015; Martin et al., 2014), adding continuous tracking to measure social reward seeking and social orienting in parallel. Standard operant chambers (Med Associates) enclosed in sound-attenuating chambers (Med Associates) were modified. A clear acrylic conspecific stimulus chamber (10.2 × 10.2 × 18.4 cm; Amac box, The Container Store) was attached to the side, separated from the operant chamber proper by a door opening (10.2 × 6 cm) with stainless steel bars (spaced 6mm apart), centered between the nosepoke holes (Figure 8G). A 3D printed filament door was attached via fishing wire to a motor (Longruner) controlled by an Arduino (UNO R3 Board ATmega328P) connected to the Med Associates input panel. The chamber included a red cue light that illuminated at the beginning of the test trial and remained illuminated until the test trial ended. The rest of the chamber was illuminated with a puck light (Honwell) to achieve 54 lux. The operant chamber bottom tray was filled with one cup of fresh corn cob bedding, which was replaced between mice. Operant chambers and stimulus chambers were designated for males or females throughout the experiment. The operant chambers were cleaned with 70% ethanol and the stimulus chambers were cleaned with 0.02% chlorhexidine diacetate solution (acrylic; Nolvasan, Zoetis) between animals. One of the operant chamber holes was designated the “correct” hole, and the other the “incorrect” hole, which were counterbalanced across groups. A nosepoke into the correct hole triggered illumination of a cue light within that hole and the raising (opening) of the door between the operant and stimulus chambers. A nosepoke into the incorrect hole did not trigger an event. The experimental and stimulus animals were allowed to interact across the bars for 12 s (social reward) and then the door was lowered (shut) and the correct hole cue light turned off. The operant chambers were connected to a PC computer via a power box (Med Associates). MED PC-V software quantified nosepokes as “correct,” “incorrect,” and “rewards” to measure social reward seeking behavior as part of social motivation. CCTV cameras (Vanxse) were mounted above the chambers and connected to a PC computer via BNC cables and quad processors. Any-Maze tracking software (Stoelting Co., Wood Dale, IL; http://www.anymaze.co.uk/index.htm) was used to track the experimental and stimulus animals’ behavior to quantify distance traveled, and time spent in and entries into the social interaction zone (6 × 3 cm zone in front of the door in each the operant and stimulus chamber). This allowed us to quantify the social orienting aspect of social motivation, defined as the experimental animal entering and spending time in the social interaction zone. Custom Java tools and SPSS syntax were used to align the Any-Maze tracking data with the timing of rewards in the Med Associates text data to extract presence or absence of each animal within the interaction zones during each second of every reward.
The operant paradigm comprised habituation, training, and testing trials (Figure 8H). For all trials, sex- and age-matched, novel C57BL/6J mice served as conspecific stimulus mice. All mice, experimental and stimulus, were group housed by sex during the entirety of the operant paradigm. The stimulus mice were loaded into and removed from the stimulus chambers prior to the placement and after removal of the experimental mice into the operant chambers, respectively, to prevent the experimental animals from being in the chambers without a conspecific stimulus partner. Habituation consisted of a 30 minute trial on each of two consecutive days, during which the door remained opened, and the nosepoke holes were shifted to be inaccessible to prevent any nose-poking prior to training. This allowed the experimental mice to acclimate to the chamber and the presence of a stimulus partner in the adjoining chamber. Training consisted of 1-hr trials during which the fixed ratio 1 (FR1) reinforcement schedule was used to reward the mouse with a 12 s social interaction opportunity following one correct nosepoke. During the 12 s reward period, any additional correct nosepokes did not result in another reward. Each mouse received at least three days of FR1, after which achievement of learning criteria moved the mouse on to testing. Ten days of FR1 without reaching criteria resulted in “non-learner” status. Learning criteria included at least 40 correct nosepokes, a 3:1 correct:incorrect ratio, and at least 65% of rewards including a social interaction (defined as both experimental and stimulus mice in their respective social interaction zones simultaneously for at least 1 s of the reward). Testing comprised a 1-hr trial on each of 3 consecutive days, during which the fixed ratio 3 (FR3) reinforcement schedule was used to reward the mouse with a 12 s social interaction opportunity following three consecutive correct nosepokes. FR3 served to increase social reward seeking effort required to receive a social reward. Following completion of FR3 testing, breakpoint testing was conducted on the following day during a 1-hr trial. To measure the breakpoint, or maximum nosepokes or effort the animal would exhibit for a social reward, the progressive ratio 3 (PR3) reinforcement schedule was used to reward the mouse with a 12 s social interaction opportunity following a progressive increase in required correct nosepokes by 3 (e.g., 3, 6, 9, 12, etc). Due to the limited number of testing chambers and the length of testing daily, we restricted the number of animals to 17 WTs (10 females, 7 males) and 19 Hets (10 females, 9 males) in order to fit all runs into one day. Task validation data was derived from a cohort of 40 male (n = 20) and female (n = 20) C57BL/6J adult mice (~P60), which served as either experimental mice (n = 20) that received a social partner interaction as a reward or control mice (n = 20) that received only the opening of a door as a reward. The testing procedure was as stated above, except that all mice received four consecutive PR3 testing days to assess reliability of performance within individuals.
Sensorimotor battery
To assess sensorimotor capabilities, performance of the mice was measured at P71-P72 in the following series of tasks based on our previously published methods (Maloney et al., 2018b, 2019a). Walking initiation assessed the ability to initiate movement by placing the mouse on a flat surface in the middle of a taped square measuring 21 × 21 cm and recording the time up to 60 s the animal took to cross the square with all four paws (Figure 7T). Balance was assessed in the platform test, which requires the animal to balance up to 60 s on a wooden platform measuring 1.0 cm thick and 3.3 cm in diameter and elevated 27 cm (Figure 7Q). In the pole test, motor coordination was evaluated as the time the animal took up to 120 s to turn 180° to face downward and climb down the 57.8 cm pole (Figure 7R). The 60° and 90° screen tests assessed a combination of coordination and strength as each mouse was required to turn 180° to face upward while in the middle of a 52 cm long wire mesh screen angled 60° or 90° and climb to the top within 60 s (Fig. 7P,SI). The inverted screen test required muscle strength and endurance for the animal to hang on an inverted wire mesh screen for up to 60 s (Figure 7O). The time for each test was manually recorded to the hundredths of a second using a stopwatch. Two trials were conducted for each test and the average of the two was used in analyses. To avoid exhaustion effects, the order of the tests during the first set of trials was reversed for the second set of trials. The order of the tests was not counterbalanced between animals so that every animal experienced each test under the same conditions. All males were tested first, followed by the females. All equipment was cleaned with 70% ethanol between animals.
Tube test of social dominance
Mice begin to develop social hierarchy behaviors at 6 weeks of age under laboratory conditions, which result in dominance ranks within their social groups (Hayashi, 1993). The tube test of social dominance was used to assess the social hierarchy behavior of the mice as previously described (Maloney et al., 2018b). Briefly, a pair of sex-matched MYT1L Het and WT mice were gently guided into a clear acrylic tube measuring 30 cm in length and 3.6 cm in diameter from either end (Figure 8A). When the mice met in the center, a divider was lifted and the time for one mouse to back out of the tube as the bout loser/submissive partner up to 2 min was recorded. This was repeated once across three consecutive days for each animal with a novel sex-matched partner. Prior to testing, each mouse was habituated to the tube by gently guiding it through the tube from either end across two consecutive days. The tube was cleaned with 0.02% chlorhexidine diacetate solution (Nolvasan, Zoetis, Parsippany-Troy Hills, NJ) between each pair. Each trial was video recorded and subsequently scored for the dominant and submissive partner of each bout. Because testing required sex-matched genotype-mixed pairs, only a subset of 17 WTs (9 females, 8 males) and 17 Hets (9 females and 8 males) were used.
Prepulse inhibition/startle
Sensorimotor gating and reactivity were assessed at P94 in the prepulse inhibition (PPI) /acoustic startle task (Figure 7U) as previously described (Dougherty et al., 2013). Briefly, PPI (response to a prepulse plus the startle pulse) and acoustic startle to a 120 dBA auditory stimulus pulse (40 ms broadband burst) were measured concurrently using computerized instrumentation (StartleMonitor, Kinder Scientific). A total of 65 trials were presented. Twenty startle trials were presented over a 20 min test period, during which the first 5 min served as an acclimation period when no stimuli above the 65 dB white noise background were presented (non-startle trials). The session began and ended by presenting 5 consecutive startle (120 db pulse alone) trials unaccompanied by other trial types. The middle 10 startle trials were interspersed with PPI trials, consisting of an additional 30 presentations of 120 dB startle stimuli preceded by prepulse stimuli of 4, 12, or 20 dB above background (10 trials for each PPI trial type). A percent PPI score for each trial was calculated using the following equation: %PPI = 100 × (startle pulse alone − prepulse + startle pulse)/startle pulse alone. The apparatus was cleaned with 0.02% chlorhexidine diacetate solution (Nolvasan, Zoetis, Parsippany-Troy Hills, NJ).
Fear conditioning
To assess associative memory to an aversive stimuli, we evaluated our mice in the fear conditioning paradigm as we previously described (Maloney et al., 2019a). In this task, freezing behavior was quantified as a proxy for the fear response. Briefly, the apparatus consisted of an acrylic chamber (26 × 18 × 18 cm) with a metal grid floor, an LED cue light and an inaccessible peppermint odorant that is housed in a sound-attenuating chamber (Actimetrics). The cue light turned on at the start of each trial and remained illuminated. The procedure (Figure S7C) comprised a 5-minute training session, an 8-minute contextual memory test, and a 10 minute cued memory test across 3 consecutive days. During training an 80 dB tone (white noise) sounded for 20 s at 100 s, 160 s and 220 s. A 1.0 mA shock (unconditioned stimulus; UCS) was paired with the last two sec of the tone (new conditioned stimulus; CS). Baseline freezing behavior was measured during the first two minutes and the freezing behavior as the conditioned response (CR) to the presentation of tone and foot shock was measured during the last three minutes. Freezing behavior was quantified through the computerized image analysis software program FreezeFrame (Actimetrics, Evanston, IL). During contextual conditioning testing on day 2, no tones or shocks were presented allowing for the evaluation of freezing behavior (CR) in response to the contextual cues associated with the shock stimulus (UCS) from day 1. During cued conditioning testing on day 3 the context of the chamber was changed to an opaque acrylic-walled chamber containing a different (coconut) odorant. The 80 dB tone (CS) began at 120 s and lasted the remainder of the trial. During the first two min baseline freezing behavior to the new context (pre-CS) was measured. During the remaining eight min, freezing behavior (CR) in response to the auditory cue (CS) associated with the shock stimulus (UCS) from day 1 was quantified. Sensitivity to footshocks was evaluated following testing as previously described (Maloney et al., 2019b), and no differences were observed between genotypes (data not shown).
Social approach
The three-chamber social approach task was used to test sociability and social novelty preference as previously described (Maloney et al., 2018b). Sociability is defined here as the preference to spend time with a novel conspecific over a novel empty cup. Social novelty is defined as the preference to spend time with a novel versus familiar conspecific. The clear acrylic apparatus measuring 60 × 39 × 22 cm is divided into three equal chambers each measuring 19.5 × 39 × 22 cm with two doors of 5 × 8 cm (Figure 8B). During testing, an acrylic lid with four air holes is placed on top of the apparatus. Two stainless steel cages (Galaxy Pencil/Utility Cup, Spectrum Diversified Designs, Inc) measuring 10 cm tall and 10 cm in diameter with vertical bars served as conspecific stimulus cages and allowed for controlled, minimal contact interactions between experimental and stimulus mice. The apparatus is placed inside a custom-built sound-attenuating chamber (70.5 × 50.5 × 60 cm). Testing is completed under red light illumination of ~11 lux provided by LED Flex Ribbon Lights (Commercial Electric, Home Depot). Video is captured by a CCTV camera (SuperCircuits) mounted in the top of each sound-attenuated chamber. A PC computer with the program ANY-maze (Stoelting Co., Wood Dale, IL; http://www.anymaze.co.uk/index.htm) recorded video and live tracked the nose, body and tail of the test mouse to produce variables for analysis: distance traveled, time spent in and entries into each chamber and investigation zone. An investigation zone is the area 2 cm outward from the perimeter of each conspecific cage. An entry into the investigation zone requires the nose-point to be within the zone, constituting a purposeful interaction by the test mouse. The social preference score was calculated as (time in social / (time in social + time in empty))*100. The novelty preference score was calculated as (time in novel / (time in novel + time in familiar))*100. Statistical analysis was as previously described ( Nygaard et al., 2019).
Testing consists of four, consecutive 10-minute trials. Trials 1 and 2 habituate the test mouse to the center chamber and the whole apparatus, respectively. At the completion of trial 2 the mouse is gently guided back to the center chamber and doors closed. Trials 3 and 4 test sociability and social novelty preference, respectively. In trial 3, an unfamiliar, sex-matched conspecific (C57BL/6J) in a conspecific cage is added to one of outer chambers, and an empty conspecific cage is added to the other outer chamber. The conspecific cage locations were counterbalanced between groups. The test mouse was allowed to explore freely, and at the end of the trial was guided back to the center chamber. During trial 4, a new novel conspecific mouse (C57BL/6J) is added to the empty cage, the conspecific mouse from trial 3 remains in the same cage to serve as the familiar stimulus. After each test, the apparatus is cleaned with 0.02% chlorhexidine diacetate solution (Nolvasan, Zoetis). The conspecific cages were cleaned with 70% ethanol solution.
Spontaneous alternation T-maze
The spontaneous alternation T-maze was used to assess perseverative exploratory behavior with procedures adapted from our previous work (Maloney et al., 2018b). The apparatus is made of gray acrylic walls with a clear acrylic floor (Figure S8D; Noldus). White paper is adhered to the underside of the floor to create distinction between coat color and the apparatus for contrast. A Start chamber (20 × 8.7 cm) is connected to two radiating arms (25 × 8.7 cm), each separated by a door that closes from the floor up. The doors for each arm and start chamber are controlled automatically by Ethovision XT 14 (Noldus) through air compression provided by an ultra-quiet air compressor (California Air Tools) located in an adjacent room. Video is captured by an IR camera (Basler acA1300) mounted above the apparatus, which is connected to a PC computer. Testing is completed in the dark with four IR LED lights (JC Infrared Illuminator) and consists of 10 consecutive trials. Prior to the start of the trial, the mouse is sequestered in the Start chamber for two minutes to habituate to this chamber. To begin the trial, the start door opens, and the mouse is free to explore. An arm choice is made when the whole body crosses the arm threshold located 11.1 cm beyond the door to the arm, and which triggers all doors to close, and the mouse is allowed to explore the chamber for 15 s. The door to that arm is then lowered, allowing the animal to move back to the Start chamber, triggering the closing of all doors. After 5 s in the Start chamber, the doors all re-open, triggering the beginning of the next trial. If no arm choice is made after two minutes, it is considered a non-choice trial, and the start of the next trial is triggered. Once all 10 trials are completed the mouse is returned to its home cage and the apparatus cleaned with 0.02% chlorhexidine diacetate solution (Nolvasan, Zoetis).
Tactile sensitivity assessment
Tactile sensitivity task assessed reflexive, mechanical sensitivity to a punctate stimulus (von Frey filaments), and was conducted as previously described (Maloney et al., 2018b). The testing apparatus consisted of a metal grid surface elevated 63.5 cm, which allowed access to the plantar surface of each animals’ paws. Each animal was housed in an individual acrylic box (10 cm x 10 cm x 10 cm) open on the bottom and opaque on three sides to prevent visual cues between animals. All mice were acclimated to the testing room 30 min prior to habituation and testing. On days 1 and 2, all mice were habituated to the testing apparatus for 1 hour. On day 3, mice were allowed to acclimate to the testing apparatus for 30 minutes prior to start of testing. Eight different von Frey hair filaments (applying 0.04-2 g of force; North Coast Medical and Rehabilitation Products) were applied to the plantar surface of each animal’s hind paw and withdrawal responses were recorded (Figure S8E). Presentations started with the lowest filament strength (0.04 g) and increased to the maximum filament strength (2 g). Each filament was applied to the plantar surface of each hind paw five times, and the number of paw withdrawal responses was recorded as percentage of responses. To evaluate the changes in paw withdrawal responses to the whole range of filaments over the testing duration, the area of the curve (AUC) was calculated for each animal.
Weight, posture, and physical assessments
All mice from the second cohort were weighed continuously throughout the experiment, starting on P30, to assess obesity-related weight gain in the mice. In addition, on P86, the mice were assessed for posture and physical characteristics. Posture was assessed by picking up the animal by the base of its tail and evaluating the splay of the forelimbs and hindlimbs. Normal posture was defined as splay of both forelimbs and hindlimbs. Abnormal posture was defined as any deviation from this, including hyperflexion or grasping of limbs. Posture was analyzed as a binary measure: normal splayed posture or abnormal posture. The physical examination consisted of assessment of the condition of eyes (presence of debris or cataracts), whiskers (full, partial, pruned), fur (matted or clean), skin (presence of dermatitis), nose (presence of drainage), and anus (presence of prolapse), as well as presence of any seizure-like activity induced by handling or tumors.
QUANTIFICATION AND STATISTICAL ANALYSIS
Statistical analyses and graph plottings were performed using IBM SPSS Statistics (v.26), GraphPad Prism (v.8.2.1), and R (v.4.0.0). Prior to analyses, data was screened for missing values and fit of distributions with assumptions underlying univariate analysis. This included the Shapiro-Wilk test on z-score-transformed data and qqplot investigations for normality, Levene’s test for homogeneity of variance, and boxplot and z-score (±3.29) investigation for identification of influential outliers. Means and standard errors were computed for each measure. Analysis of variance (ANOVA), including repeated-measures or mixed models, was used to analyze data where appropriate. Sex was included as a biological variable in all analyses across all experiments. Simple main effects were used to dissect significant interactions. Where appropriate, the Greenhouse-Geisser or Huynh-Feldt adjustment was used to protect against violations of sphericity. Multiple pairwise comparisons were subjected to Bonferroni correction or Dunnett correction. One-sample t tests were used to determine differences from chance. For data that did not fit univariate assumptions, non-parametric tests were used or transformations were applied. For mouse behavior data, the square root transformation was applied to the USV and fear conditioning data. Chi-square or Fisher’s exact tests were used to assess Myt1l mutation and sex association with categorical variables. Sex x genotype effects are reported where significant, otherwise data are reported and visualized collapsed for sex. The critical alpha value for all analyses was p < 0.05, unless otherwise stated. Figure schematics were generated using BioRender. The datasets generated and analyzed during the current study are available from the corresponding author upon reasonable request. All statistical data can be found in Table S5.
Supplementary Material
Highlights.
Myt1l+/− mice mimic patient phenotypes (e.g., obesity, microcephaly, hyperactivity)
MYT1L loss causes precocious differentiation and progenitor depletion embryonically
Myt1l+/− mice show disrupted neuronal maturation in juveniles and adults
Myt1l+/− mice display ASD-related social impairments, especially in males
ACKNOWLEDGMENTS
We thank Dr. Monica Sentamet and the Genome Engineering and iPSC Center (GEiC) at Washington University in St. Louis for gRNA design and validation; Dr. Michael White and the transgenic services core for oocyte injection; Dr. Cheng Cheng, Dr. Lingchun Kong, Dr. Xiaoying Chen, Dr. Adam Clemens, Weijia Cao, Brant Swiney, Nicole Fuhler, Rena Silverman, and Joelle Schneiderman for technical assistance; Allen Yen and Colin Florian for manuscript proofreading; Drs. Carla Yuede and David Wozniak for access to behavioral equipment; and the Mallinckrodt Institute of Radiology’s Small Animal Magnetic Resonance Facility and Washington University Center for Cellular Imaging for technical support. Funding was provided by the Jakob Gene Fund, the Mallinckrodt Institute of Radiology at Washington University School of Medicine, the McDonnell International Scholars Academy (J.C.), the Brain & Behavior Research Foundation (K.B.H.), NIH grants R01MH107515 and R01MH124808 to J.D.D., and NIH grants 5UL1TR002345 (Institute for Clinical and Translational Science [ICTS]) and P50 HD103525 (Intellectual and Developmental Disabilities Research Centers [IDDRC]).
Footnotes
SUPPLEMENTAL INFORMATION
Supplemental information can be found online at https://doi.org/10.1016/j.neuron.2021.09.009.
DECLARATION OF INTERESTS
The authors declare no competing interests.
INCLUSION AND DIVERSITY
We worked to ensure sex balance in the selection of non-human subjects. We worked to ensure diversity in experimental samples through the selection of the genomic datasets. One or more of the authors of this paper self-identifies as an underrepresented ethnic minority in science. One or more of the authors of this paper self-identifies as a member of the LGBTQ+ community.
REFERENCES
- Almazan G, Lefebvre DL, and Zingg HH (1989). Ontogeny of hypothalamic vasopressin, oxytocin and somatostatin gene expression. Brain Res. Dev. Brain Res 45, 69–75. [DOI] [PubMed] [Google Scholar]
- Anders S, Pyl PT, and Huber W (2015). HTSeq – a Python framework to work with high-throughput sequencing data. Bioinformatics 31, 166–169. [DOI] [PMC free article] [PubMed] [Google Scholar]
- Anderson AG, Kulkarni A, Harper M, and Konopka G (2020). Single-cell analysis of Foxp1-driven mechanisms essential for striatal development. Cell Rep. 30, 3051–3066.e7. [DOI] [PMC free article] [PubMed] [Google Scholar]
- Araujo DJ, Anderson AG, Berto S, Runnels W, Harper M, Ammanuel S, Rieger MA, Huang H-C, Rajkovich K, Loerwald KW, et al. (2015). FoxP1 orchestration of ASD-relevant signaling pathways in the striatum. Genes Dev. 29, 2081–2096. [DOI] [PMC free article] [PubMed] [Google Scholar]
- Basser PJ, and Pierpaoli C (2011). Microstructural and physiological features of tissues elucidated by quantitative-diffusion-tensor MRI. 1996. J. Magn. Reson 213, 560–570. [DOI] [PubMed] [Google Scholar]
- Bhatt DH, Zhang S, and Gan W-B (2009). Dendritic spine dynamics. Annu. Rev. Physiol 71, 261–282. [DOI] [PubMed] [Google Scholar]
- Blanchet P, Bebin M, Bruet S, Cooper GM, Thompson ML, Duban-Bedu B, Gerard B, Piton A, Suckno S, Deshpande C, et al. ; Clinical Sequencing Exploratory Research Study Consortium; Deciphering Developmental Disorders Consortium (2017). MYT1L mutations cause intellectual disability and variable obesity by dysregulating gene expression and development of the neuroendocrine hypothalamus. PLoS Genet. 13, e1006957. [DOI] [PMC free article] [PubMed] [Google Scholar]
- Bolger AM, Lohse M, and Usadel B (2014). Trimmomatic: a flexible trimmer for Illumina sequence data. Bioinformatics 30, 2114–2120. [DOI] [PMC free article] [PubMed] [Google Scholar]
- Buenrostro J, Wu B, Chang H, and Greenleaf W (2015). ATAC-seq: a method for assaying chromatin accessibility genome-wide. Curr. Protoc. Mol. Biol 109, 21.29.1–21.29.9. [DOI] [PMC free article] [PubMed] [Google Scholar]
- Cheng C, Deng P-Y, Ikeuchi Y, Yuede C, Li D, Rensing N, Huang J, Baldridge D, Maloney SE, Dougherty JD, et al. (2018). Characterization of a mouse model of Börjeson-Forssman-Lehmann syndrome. Cell Rep. 25, 1404–1414.e6. [DOI] [PMC free article] [PubMed] [Google Scholar]
- Chevallier C, Kohls G, Troiani V, Brodkin ES, and Schultz RT (2012). The social motivation theory of autism. Trends Cogn. Sci 16, 231–239. [DOI] [PMC free article] [PubMed] [Google Scholar]
- Chong JA, Tapia-Ramírez J, Kim S, Toledo-Aral JJ, Zheng Y, Boutros MC, Altshuller YM, Frohman MA, Kraner SD, and Mandel G (1995). REST: a mammalian silencer protein that restricts sodium channel gene expression to neurons. Cell 80, 949–957. [DOI] [PubMed] [Google Scholar]
- de Ligt J, Willemsen MH, van Bon BWM, Kleefstra T, Yntema HG, Kroes T, Vulto-van Silfhout AT, Koolen DA, de Vries P, Gilissen C, et al. (2012). Diagnostic exome sequencing in persons with severe intellectual disability. N. Engl. J. Med 367, 1921–1929. [DOI] [PubMed] [Google Scholar]
- De Rubeis S, He X, Goldberg AP, Poultney CS, Samocha K, Cicek AE, Kou Y, Liu L, Fromer M, Walker S, et al. ; DDD Study; Homozygosity Mapping Collaborative for Autism; UK10K Consortium (2014). Synaptic, transcriptional and chromatin genes disrupted in autism. Nature 515, 209–215. [DOI] [PMC free article] [PubMed] [Google Scholar]
- Desai NS, Cudmore RH, Nelson SB, and Turrigiano GG (2002). Critical periods for experience-dependent synaptic scaling in visual cortex. Nat. Neurosci 5, 783–789. [DOI] [PubMed] [Google Scholar]
- Doco-Fenzy M, Leroy C, Schneider A, Petit F, Delrue M-A, Andrieux J, Perrin-Sabourin L, Landais E, Aboura A, Puechberty J, et al. (2014). Early-onset obesity and paternal 2pter deletion encompassing the ACP1, TMEM18, and MYT1L genes. Eur. J. Hum. Genet 22, 471–479. [DOI] [PMC free article] [PubMed] [Google Scholar]
- Dougherty JD, Maloney SE, Wozniak DF, Rieger MA, Sonnenblick L, Coppola G, Mahieu NG, Zhang J, Cai J, Patti GJ, et al. (2013). The disruption of Celf6, a gene identified by translational profiling of serotonergic neurons, results in autism-related behaviors. J. Neurosci 33, 2732–2753. [DOI] [PMC free article] [PubMed] [Google Scholar]
- Durinck S, Spellman PT, Birney E, and Huber W (2009). Mapping identifiers for the integration of genomic datasets with the R/Bioconductor package biomaRt. Nat. Protoc 4, 1184–1191. [DOI] [PMC free article] [PubMed] [Google Scholar]
- Ehret G (1980). Development of sound communication in mammals. In Advances in the Study of Behavior, Rosenblatt JS, Hinde RA, Beer C, and Busnel M-C, eds. (San Diego, CA: Academic Press; ), pp. 179–225. [Google Scholar]
- Feather-Schussler DN, and Ferguson TS (2016). A battery of motor tests in a neonatal mouse model of cerebral palsy. J. Vis. Exp (117), 53569. [DOI] [PMC free article] [PubMed] [Google Scholar]
- Fowler SC, Birkestrand BR, Chen R, Moss SJ, Vorontsova E, Wang G, and Zarcone TJ (2001). A force-plate actometer for quantitating rodent behaviors: illustrative data on locomotion, rotation, spatial patterning, stereotypies, and tremor. J. Neurosci. Methods 107, 107–124. [DOI] [PubMed] [Google Scholar]
- Gogolla N, Leblanc JJ, Quast KB, Südhof TC, Fagiolini M, and Hensch TK (2009). Common circuit defect of excitatory-inhibitory balance in mouse models of autism. J. Neurodev. Disord 1, 172–181. [DOI] [PMC free article] [PubMed] [Google Scholar]
- Gompers AL, Su-Feher L, Ellegood J, Copping NA, Riyadh MA, Stradleigh TW, Pride MC, Schaffler MD, Wade AA, Catta-Preta R, et al. (2017). Germline Chd8 haploinsufficiency alters brain development in mouse. Nat. Neurosci 20, 1062–1073. [DOI] [PMC free article] [PubMed] [Google Scholar]
- Guy J, Hendrich B, Holmes M, Martin JE, and Bird A (2001). A mouse Mecp2-null mutation causes neurological symptoms that mimic Rett syndrome. Nat. Genet 27, 322–326. [DOI] [PubMed] [Google Scholar]
- Haack B, Markl H, and Ehret G (1983). Sound communication between parents and offspring. In The Auditory Psychobiology of the Mouse, Williot JF, ed. (New York: Psychology Press; ), pp. 57–97. [Google Scholar]
- Hayashi S (1993). Development and diversity of social structure in male mice. J. Ethol 11, 77–82. [Google Scholar]
- Heinz S, Benner C, Spann N, Bertolino E, Lin YC, Laslo P, Cheng JX, Murre C, Singh H, and Glass CK (2010). Simple combinations of lineage-determining transcription factors prime cis-regulatory elements required for macrophage and B cell identities. Mol. Cell 38, 576–589. [DOI] [PMC free article] [PubMed] [Google Scholar]
- Holy TE, and Guo Z (2005). Ultrasonic songs of male mice. PLoS Biol. 3, e386. [DOI] [PMC free article] [PubMed] [Google Scholar]
- Iwase S, Brookes E, Agarwal S, Badeaux AI, Ito H, Vallianatos CN, Tomassy GS, Kasza T, Lin G, Thompson A, et al. (2016). A mouse model of X-linked intellectual disability associated with impaired removal of histone methylation. Cell Rep. 14, 1000–1009. [DOI] [PMC free article] [PubMed] [Google Scholar]
- Jiang Y, Yu VC, Buchholz F, O’Connell S, Rhodes SJ, Candeloro C, Xia YR, Lusis AJ, and Rosenfeld MG (1996). A novel family of Cys-Cys, His-Cys zinc finger transcription factors expressed in developing nervous system and pituitary gland. J. Biol. Chem 271, 10723–10730. [DOI] [PubMed] [Google Scholar]
- Kang HJ, Kawasawa YI, Cheng F, Zhu Y, Xu X, Li M, Sousa AMM, Pletikos M, Meyer KA, Sedmak G, et al. (2011). Spatio-temporal transcriptome of the human brain. Nature 478, 483–489. [DOI] [PMC free article] [PubMed] [Google Scholar]
- Kasper EM, Larkman AU, Lübke J, and Blakemore C (1994). Pyramidal neurons in layer 5 of the rat visual cortex. II. Development of electrophysiological properties. J. Comp. Neurol 339, 475–494. [DOI] [PubMed] [Google Scholar]
- Katayama Y, Nishiyama M, Shoji H, Ohkawa Y, Kawamura A, Sato T, Suyama M, Takumi T, Miyakawa T, and Nakayama KI (2016). CHD8 haplionsufficiency results in autistic-like phenotypes in mice. Nature 537, 675–679. [DOI] [PubMed] [Google Scholar]
- Kepa A, Martinez Medina L, Erk S, Srivastava DP, Fernandes A, Toro R, Lévi S, Ruggeri B, Fernandes C, Degenhardt F, et al. (2017). Associations of the intellectual disability gene MYT1L with helix-loop-helix gene expression, hippocampus volume and hippocampus activation during memory retrieval. Neuropsychopharmacology 42, 2516–2526. [DOI] [PMC free article] [PubMed] [Google Scholar]
- Khacho M, Clark A, Svoboda DS, MacLaurin JG, Lagace DC, Park DS, and Slack RS (2017). Mitochondrial dysfunction underlies cognitive defects as a result of neural stem cell depletion and impaired neurogenesis. Hum. Mol. Genet 26, 3327–3341. [DOI] [PMC free article] [PubMed] [Google Scholar]
- Kim JG, Armstrong RC, v Agoston D, Robinsky A, Wiese C, Nagle J, and Hudson LD (1997). Myelin transcription factor 1 (Myt1) of the oligodendrocyte lineage, along with a closely related CCHC zinc finger, is expressed in developing neurons in the mammalian central nervous system. J. Neurosci. Res 50, 272–290. [DOI] [PubMed] [Google Scholar]
- Kim YJ, Khoshkhoo S, Frankowski JC, Zhu B, Abbasi S, Lee S, Wu YE, and Hunt RF (2018). Chd2 is necessary for neural circuit development and long-term memory. Neuron 100, 1180–1193.e6. [DOI] [PMC free article] [PubMed] [Google Scholar]
- Klein Gunnewiek TM, Van Hugte EJH, Frega M, Guardia GS, Foreman K, Panneman D, Mossink B, Linda K, Keller JM, Schubert D, et al. (2020). m.3243A > G-induced mitochondrial dysfunction impairs human neuronal development and reduces neuronal network activity and synchronicity. Cell Rep. 31, 107538. [DOI] [PubMed] [Google Scholar]
- Kroon T, van Hugte E, van Linge L, Mansvelder HD, and Meredith RM (2019). Early postnatal development of pyramidal neurons a cross layers of the mouse medial prefrontal cortex. Sci. Rep 9, 5037. [DOI] [PMC free article] [PubMed] [Google Scholar]
- Lambo ME, and Turrigiano GG (2013). Synaptic and intrinsic homeostatic mechanisms cooperate to increase L2/3 pyramidal neuron excitability during a late phase of critical period plasticity. J. Neurosci 33, 8810–8819. [DOI] [PMC free article] [PubMed] [Google Scholar]
- Li Y, Xu Y, Benitez BA, Nagree MS, Dearborn JT, Jiang X, Guzman MA, Woloszynek JC, Giaramita A, Yip BK, et al. (2019). Genetic ablation of acid ceramidase in Krabbe disease confirms the psychosine hypothesis and identifies a new therapeutic target. Proc. Natl. Acad. Sci. U S A 116, 20097–20103. [DOI] [PMC free article] [PubMed] [Google Scholar]
- Loid P, Mäkitie R, Costantini A, Viljakainen H, Pekkinen M, and Mäkitie O (2018). A novel MYT1L mutation in a patient with severe early-onset obesity and intellectual disability. Am. J. Med. Genet. A 176, 1972–1975. [DOI] [PubMed] [Google Scholar]
- Mall M, Kareta MS, Chanda S, Ahlenius H, Perotti N, Zhou B, Grieder SD, Ge X, Drake S, Euong Ang C, et al. (2017). Myt1l safeguards neuronal identity by actively repressing many non-neuronal fates. Nature 544, 245–249. [DOI] [PMC free article] [PubMed] [Google Scholar]
- Maloney SE, Chandler KC, Anastasaki C, Rieger MA, Gutmann DH, and Dougherty JD (2018a). Characterization of early communicative behavior in mouse models of neurofibromatosis type 1. Autism Res. 11, 44–58. [DOI] [PMC free article] [PubMed] [Google Scholar]
- Maloney SE, Akula S, Rieger MA, McCullough KB, Chandler K, Corbett AM, McGowin AE, and Dougherty JD (2018b). Examining the reversibility of long-term behavioral disruptions in progeny of maternal SSRI exposure. eNeuro 5, ENEURO.0120-18.2018. [DOI] [PMC free article] [PubMed] [Google Scholar]
- Maloney SE, Rieger MA, Al-Hasani R, Bruchas MR, Wozniak DF, and Dougherty JD (2019a). Loss of CELF6 RNA binding protein impairs cocaine conditioned place preference and contextual fear conditioning. Genes Brain Behav. 18, e12593. [DOI] [PMC free article] [PubMed] [Google Scholar]
- Maloney SE, Yuede CM, Creeley CE, Williams SL, Huffman JN, Taylor GT, Noguchi KN, and Wozniak DF (2019b). Repeated neonatal isoflurane exposures in the mouse induce apoptotic degenerative changes in the brain and relatively mild long-term behavioral deficits. Sci. Rep 9, 2779. [DOI] [PMC free article] [PubMed] [Google Scholar]
- Mansfield P, Constantino JN, and Baldridge D (2020). MYT1L: a systematic review of genetic variation encompassing schizophrenia and autism. Am. J. Med. Genet. B. Neuropsychiatr. Genet 183, 227–233. [DOI] [PMC free article] [PubMed] [Google Scholar]
- Manukyan A, Kowalczyk I, Melhuish TA, Lemiesz A, and Wotton D (2018). Analysis of transcriptional activity by the Myt1 and Myt1l transcription factors. J. Cell. Biochem 119, 4644–4655. [DOI] [PubMed] [Google Scholar]
- Maravall M, Stern EA, and Svoboda K (2004). Development of intrinsic properties and excitability of layer 2/3 pyramidal neurons during a critical period for sensory maps in rat barrel cortex. J. Neurophysiol 92, 144–156. [DOI] [PubMed] [Google Scholar]
- Martin L, and Iceberg E (2015). Quantifying social motivation in mice using operant conditioning. J. Vis. Exp 8, e53009. [DOI] [PMC free article] [PubMed] [Google Scholar]
- Martin L, Sample H, Gregg M, and Wood C (2014). Validation of operant social motivation paradigms using BTBR T+tf/J and C57BL/6J inbred mouse strains. Brain Behav. 4, 754–764. [DOI] [PMC free article] [PubMed] [Google Scholar]
- Mathis A, Mamidanna P, Cury KM, Abe T, Murthy VN, Mathis MW, and Bethge M (2018). DeepLabCut: marker less pose estimation of user-defined body parts with deep learning. Nat. Neurosci 21, 1281–1289. [DOI] [PubMed] [Google Scholar]
- Matsushita F, Kameyama T, Kadokawa Y, and Marunouchi T (2014). Spatiotemporal expression pattern of Myt/NZF family zinc finger transcription factors during mouse nervous system development. Dev. Dyn 243, 588–600. [DOI] [PubMed] [Google Scholar]
- Mori S (2007). Introduction to Diffusion Tensor Imaging (Amsterdam, the Netherlands: Elsevier; ). [Google Scholar]
- Nelson SB, and Valakh V (2015). Excitatory/inhibitory balance and circuit homeostasis in autism spectrum disorders. Neuron 87, 684–698. [DOI] [PMC free article] [PubMed] [Google Scholar]
- Nilsson SR, Goodwin NL, Choong JJ, Hwang S, Wright HR, Norville ZC, Tong X, Lin D, Bentzley BS, Eshel N, et al. (2020). Simple Behavioral Analysis (SimBA) – an open source toolkit for computer classification of complex social behaviors in experimental animals. bioRxiv. 10.1101/2020.04.19.049452. [DOI] [Google Scholar]
- Oh SW, Harris JA, Ng L, Winslow B, Cain N, Mihalas S, Wang Q, Lau C, Kuan L, Henry AM, et al. (2014). A mesoscale connectome of the mouse brain. Nature 508, 207–214. [DOI] [PMC free article] [PubMed] [Google Scholar]
- Pang ZP, Yang N, Vierbuchen T, Ostermeier A, Fuentes DR, Yang TQ, Citri A, Sebastiano V, Marro S, Südhof TC, and Wernig M (2011). Induction of human neuronal cells by defined transcription factors. Nature 476, 220–223. [DOI] [PMC free article] [PubMed] [Google Scholar]
- Pitts MW (2018). Barnes maze procedure for spatial learning and memory in mice. Biol. Protoc 8, e2744. [DOI] [PMC free article] [PubMed] [Google Scholar]
- Reddy AS, Wozniak DF, Farber NB, Dearborn JT, Fowler SC, and Sands MS (2012). Bone marrow transplantation alters the tremor phenotype in the murine model of globoid-cell leukodystrophy. J. Clin. Med 1, 1–14. [DOI] [PMC free article] [PubMed] [Google Scholar]
- Rieger MA, and Dougherty JD (2016). Analysis of within subjects variability in mouse ultrasonic vocalization: pups exhibit inconsistent, state-like patterns of call production. Front. Behav. Neurosci 10, 182. [DOI] [PMC free article] [PubMed] [Google Scholar]
- Risso D, Ngai J, Speed TP, and Dudoit S (2014). Normalization of RNA-seq data using factor analysis of control genes or samples. Nat. Biotechnol 32, 896–902. [DOI] [PMC free article] [PubMed] [Google Scholar]
- Robinson MD, McCarthy DJ, and Smyth GK (2010). edgeR: a Bioconductor package for differential expression analysis of digital gene expression data. Bioinformatics 26, 139–140. [DOI] [PMC free article] [PubMed] [Google Scholar]
- Romm E, Nielsen JA, Kim JG, and Hudson LD (2005). Myt1 family recruits histone deacetylase to regulate neural transcription. J. Neurochem 93, 1444–1453. [DOI] [PMC free article] [PubMed] [Google Scholar]
- Sanders SJ (2015). First glimpses of the neurobiology of autism spectrum disorder. Curr. Opin. Genet. Dev 33, 80–92. [DOI] [PubMed] [Google Scholar]
- Satterstrom FK, Kosmicki JA, Wang J, Breen MS, Rubeis SD, An J-Y, Peng M, Collins RL, Grove J, Klei L, et al. (2018). Novel genes for autism implicate both excitatory and inhibitory cell lineages in risk. bioRxiv. 10.1101/484113. [DOI] [Google Scholar]
- Sessa A, Fagnocchi L, Mastrototaro G, Massimino L, Zaghi M, Indrigo M, Cattaneo S, Martini D, Gabellini C, Pucci C, et al. (2019). SETD5 regulates chromatin methylation state and preserves global transcriptional fidelity during brain development and neuronal wiring. Neuron 104, 271–289.e13. [DOI] [PubMed] [Google Scholar]
- Shi Y, Shao Q, Li Z, Gonzalez GA, Lu F, Wang D, Pu Y, Huang A, Zhao C, He C, and Cao L (2018). Myt1L promotes differentiation of oligodendrocyte precursor cells and is necessary for remyelination after lysolecithin-induced demyelination. Neurosci. Bull 34, 247–260. [DOI] [PMC free article] [PubMed] [Google Scholar]
- Stejskal EO, and Tanner JE (1965). Spin diffusion measurements: spin echoes in the presence of a time-dependent field gradient. J. Chem. Phys 42, 288–292. [Google Scholar]
- Subramanian A, Tamayo P, Mootha VK, Mukherjee S, Ebert BL, Gillette MA, Paulovich A, Pomeroy SL, Golub TR, Lander ES, and Mesirov JP (2005). Gene set enrichment analysis: a knowledge-based approach for interpreting genome-wide expression profiles. Proc. Natl. Acad. Sci. U S A 102, 15545–15550. [DOI] [PMC free article] [PubMed] [Google Scholar]
- Suliman-Lavie R, Title B, Cohen Y, Hamada N, Tal M, Tal N, Monderer-Rothkoff G, Gudmundsdottir B, Gudmundsson KO, Keller JR, et al. (2020). Pogz deficiency leads to transcription dysregulation and impaired cerebellar activity underlying autism-like behavior in mice. Nat. Commun 11, 5836. [DOI] [PMC free article] [PubMed] [Google Scholar]
- Tasic B, Yao Z, Graybuck LT, Smith KA, Nguyen TN,Bertagnolli D, Goldy J, Garren E, Economo MN, Viswanathan S, et al. (2018). Shared and distinct transcriptomic cell types across neocortical areas. Nature 563, 72–78. [DOI] [PMC free article] [PubMed] [Google Scholar]
- Tischfield DJ, Saraswat DK, Furash A, Fowler SC, Fuccillo MV, and Anderson SA (2017). Loss of the neurodevelopmental gene Zswim6 alters striatal morphology and motor regulation. Neurobiol. Dis 103, 174–183. [DOI] [PMC free article] [PubMed] [Google Scholar]
- Vierbuchen T, Ostermeier A, Pang ZP, Kokubu Y, Südhof TC, and Wernig M (2010). Direct conversion of fibroblasts to functional neurons by defined factors. Nature 463, 1035–1041. [DOI] [PMC free article] [PubMed] [Google Scholar]
- Weiner JA, and Chun J (1997). Png-1, a nervous system-specific zinc finger gene, identifies regions containing postmitotic neurons during mammalian embryonic development. J. Comp. Neurol 381, 130–142. [DOI] [PubMed] [Google Scholar]
- Windheuser IC, Becker J, Cremer K, Hundertmark H, Yates LM, Mangold E, Peters S, Degenhardt F, Ludwig KU, Zink AM, et al. (2020). Nine newly identified individuals refine the phenotype associated with MYT1L mutations. Am. J. Med. Genet. A 182, 1021–1031. [DOI] [PubMed] [Google Scholar]
- Yasumura A, Omori M, Fukuda A, Takahashi J, Yasumura Y, Nakagawa E, Koike T, Yamashita Y, Miyajima T, Koeda T, et al. (2019). Age-related differences in frontal lobe function in children with ADHD. Brain Dev. 41, 577–586. [DOI] [PubMed] [Google Scholar]
- Zhang Y, Liu T, Meyer CA, Eeckhoute J, Johnson DS, Bernstein BE, Nusbaum C, Myers RM, Brown M, Li W, and Liu XS (2008). Model-based analysis of ChIP-Seq (MACS). Genome Biol. 9, R137. [DOI] [PMC free article] [PubMed] [Google Scholar]
- Zhu LJ, Gazin C, Lawson ND, Pagès H, Lin SM, Lapointe DS, and Green MR (2010). ChIPpeakAnno: a Bioconductor package to annotate ChIP-seq and ChIP-chip data. BMC Bioinformatics 11, 237. [DOI] [PMC free article] [PubMed] [Google Scholar]
Associated Data
This section collects any data citations, data availability statements, or supplementary materials included in this article.
Supplementary Materials
Data Availability Statement
The codes for analyzing Illumina sequencing, ATAC-seq, and RNA-seq generated in this study are available via Bitbucket: https://bitbucket.org/jdlabteam/workspace/projects/MYT. The ATAC-seq and RNA-seq raw reads as well as counts data are available at GEO with reference ID GSE173943. Any additional information required to reanalyze the data reported in this work paper is available from the Lead Contact upon request.