

Abstract
Background
The main aim of this study was to develop a nomogram prediction model for poor functional prognosis after patellar fracture surgery in the elderly based on the hospital for special surgery (HSS) knee score.
Methods
A retrospective analysis of 168 elderly patients with patellar fractures was performed to collect demographic data, knee imaging, and functional prognosis preoperatively and during the 6-month postoperative follow-up period. Good functional prognosis of knee joint was defined as the percentage of HSS knee scores on the injured side relative to the uninjured side ≥ 80% at six-month postoperative review. Multifactorial linear regression analysis and logistic regression analysis were then used to identify risk factors of functional prognosis and develop the nomogram prediction model. Furthermore, the validity and accuracy of the prediction model were evaluated using C-index, area under the curve (AUC), and decision curve analyses.
Results
The final screening from the 12 potential risk factors yielded three high-risk factors which were included in the nomogram prediction model: advanced age (OR 0.28 (95% CI 0.11-0.67), P = 0.005), sarcopenia (OR 0.11 (95% CI 0.05-0.26), P < 0.001), and low albumin level (OR 1.14 (95% CI 1.02-1.29), P = 0.025). The model had a good predictive ability with an AUC of 0.857 (95% CI (0.783-0.929)) for the training group and a C-index of 0.836 for the overall sample. In addition, the decision analysis curve indicated that the model had good clinical applicability.
Conclusion
Our predictive model is effective in predicting the risk of poor functional prognosis after patellar fracture surgery in the elderly by assessing high-risk factors such as advanced age, sarcopenia, and serum albumin levels. This prediction model can help clinicians to make individualized risk prediction, early identification of patients at high risk for poor functional outcome, and appropriate interventions.
1. Introduction
The patella, an integral part of the human knee extension device, plays an important biomechanical function in knee joint movement. Previous studies have reported that patellar fracture is a common fracture of the lower extremities which occurs mostly in the aging population, with an increasing incidence resulting from low energy trauma such as falls [1, 2]. The vast majority of patellar fractures require surgical intervention [3], and the postoperative functional recovery varies from patient to patient. Therefore, identifying the factors that influence functional prognosis can help clinicians to improve patient recovery.
Sarcopenia is a progressive and generalized skeletal muscle disorder involving the accelerated loss of muscle mass and function [4–6]. Previous studies have demonstrated an association between sarcopenia and adverse health outcomes such as falls, long-term care placement, poorer quality of life, and mortality [7–9]. In addition, epidemiological studies conducted in Asian countries using the AWGS 2014 criteria have reported that the prevalence of sarcopenia ranged from 5.5% to 25.7% [10–12]. Generally, patients admitted in hospitals and in care homes have a higher prevalence of sarcopenia when compared with people in the community. Currently, there is neglect and inadequate treatment of sarcopenia despite it being an important public health problem. In addition, the clinical significance of sarcopenia on functional prognosis after orthopedic surgery has not been elucidated.
The functional prognosis after patellar fracture surgery directly affects the patients' quality of life. Therefore, development of accurate predictive models and early individualized interventions may be effective in improving patients' functional outcomes. Previous studies have reported that the Hospital for Special Surgery knee score (HSS) is an effective and reliable instrument for evaluating the functional prognosis of patella fractures [13–15]. The main objective of this study was to develop a predictive model of poor functional prognosis after patellar fracture in the elderly based on HSS scores, with the overarching goal of exploring the risk factors associated with functional prognosis.
2. Materials and Methods
2.1. Setting and Sample
This retrospective study was approved by the Ethics Committee of Shanghai General Hospital affiliated to Shanghai Jiao Tong University (approval No. 2020KY220). In addition, the study met the stipulations of the Helsinki declaration. We have referred to this document and calculated the sample size required for this study [16]. We screened patellar fracture patients over 60 years old who were treated using Kirschner wire tension band fixation at our institution from November 2018 to May 2020. All the patients were residents of China, and the treatment procedure was performed by one orthopedic trauma surgeon with more than fifteen years of experience. Kirschner's wire and tension band were provided by Trauson (China) and Zimmer (USA), respectively. The operative criteria was as follows: patellar fractures displaced more than 2 mm, uneven joint surface over 2 mm, and fractures with extensor support band tear [17]. Patients were excluded if they had previous knee movement dysfunction, history of knee surgery, associated systemic or multiorgan injury, cognitive impairment, chronic debilitating diseases (neoplasms, renal insufficiency, and Parkinson's disease), postoperative internal fixation failure and infection, or follow-up of less than six months. Signed informed consent was obtained from the participating patients prior to starting the study. Ultimately, 168 patients, 63 males and 105 females, who met the inclusion criteria were included in this study; 37 patients were excluded according to the exclusion criteria (Figure 1). The fracture types were then classified using AO classification system according to the preoperative X-ray and three-dimensional computed tomography (3D CT) of the knee joint. The laboratory blood test results taken in this study were the patients' preoperative fasting venous blood samples. In addition, we obtained the basic clinical characteristics of the patients such as sex and age before the surgery.
Figure 1.
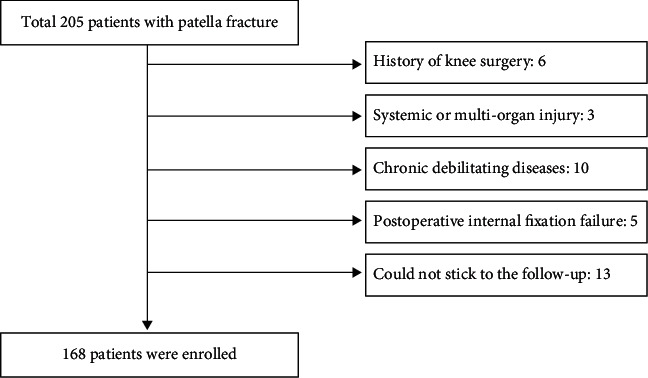
Flow chart for screening patients.
2.2. Assessment of Sarcopenia
The definition of sarcopenia in this study was based on the consensus of the Asian Working Group for Sarcopenia (AWGS) [18, 19]. The patients were classified as having sarcopenia if they had low muscle strength and low muscle mass. The body weight adjusted cross-sectional area of midthigh muscle (tmCSA/BW cm2/kg) measured by CT (Siemens, Germany) was used as an indicator of low muscle mass (males ≤ 1.58 cm2/kg and females ≤ 1.25 cm2/kg) [18, 20]. The middle of the thigh is defined as the midpoint of the line between the midpoint of femoral intertrochanteric crest and the midpoint of intercondylar line of the femur. On the other hand, the handgrip strength is used as an indicator of low muscle strength (males < 26 kg and females < 18 kg) [19]. In this study, the grip strength was measured in the dominant hand using a Jamar ergometer (Asimow Engineering, USA) with the elbow flexed at 90 degrees and the forearm in a neutral position. The average of three trials was recorded in kilograms, with a 5-minute interval between trials. All patients completed the sarcopenia assessment before operation.
2.3. Functional Prognosis Measure
The Hospital for Special Surgery (HSS) knee score and the range of motion of knee joint were used to evaluate knee function [21], where the assessments were performed preoperatively, three months postoperatively, and six months postoperatively. The range of motion of knee joint was evaluated using a standard goniometer, and the final value was reported as a percentage of the injured side relative to the uninjured side. We hypothesized that the functional status of the knee on the injured side would be similar to that on the uninjured side due to the inability of accurately measuring the functional status of the knee prior to the fracture on the injured side. This was then verified using a clinical interview, and the functional status of the patient was measured as a percentage of the HSS knee scores on the injured side relative to the uninjured side. The first assessment was completed by two independent orthopedic surgeons within 24 hours of admission, and the average of the two measurements was used for the final analysis. At three and six months after the operation, the patient returned to the hospital for knee function and radiographic evaluation. Two orthopedic surgeons, who did not know the patient's clinical information, assessed the patient's knee mobility and completed the patient's HSS knee scores during this period. The average of their measurements was then used for the final analysis. The percentage of HSS knee scores on the injured side relative to the uninjured side at 6-month postoperative review ≥ 80% was used as an indicator of good functional prognosis [13].
2.4. Radiological Assessment
At six months postoperatively, radiological assessment was performed by two independent observers, who did not know the patient's clinical information. Insall-Salvati index [22], Blackburne-Peel index [23], congruence angle [24], and lateral patellofemoral angles [25] were measured using lateral and Laurin knee radiograph. The measurement was repeated three times, and the average of the measurements was used for the final analysis.
2.5. Statistical Analysis
The Kolmogorov-Smirnov test was used to determine the normality of variable distributions. Continuous data that followed a normal distribution were expressed as mean and standard deviation, while continuous data that did not follow a normal distribution were expressed as median (25% percentile–75% percentile). The independent samples t-test and Mann–Whitney test were used to test normally distributed continuous and nonnormally distributed continuous variables, respectively. In addition, the chi-square test was used to test the differences in categorical variables. All the statistical tests in this study were performed using Windows SPSS (Release 22.0; SPSS. Chicago, IL, USA). The categorical variables were dummy coded with the subgroup using the largest sample size as the reference group. Linear regression analysis and forward stepwise variable selection were used to initially determine the relationship between potential predictors and the dependent variables (HSS knee scores at 6 months postoperatively) [26] and performed residual analysis to determine model validity. P < 0.05 was considered to be statistically significant.
Principal component analysis (PCA) was used to check the distribution of the dataset. Furthermore, a multivariate logistic regression model was used to verify the potential influences identified by the multifactorial linear regression model and then used to develop a nomogram predictive model for predicting the risk of poor functional outcomes in elderly patients with patellar fractures after surgery. A calibration curve was used to assess the accuracy of nomogram [27]. We then measured the C-index and plotted the area under curve (AUC) in order to further quantify the recognition performance of the nomogram [28]. R language (R software version 3.5.3) was used to perform further iterations (10,000 repeated samples) on the nomogram to more accurately calculate the C-index [29]. Finally, decision curve analysis was used to assess the clinical utility of the nomogram [30].
3. Results
3.1. Basic Characteristics of the Data
We collected the complete data from 168 elderly patients with patella fractures (63 males and 103 females). The males had an average age of 65.75 ± 6.42 years, while the females had an average age of 66.62 ± 6.79 years. Patients were categorized into good functional prognosis and bad functional prognosis groups based on the definition of good functional prognosis in the method. The characteristics of all the patients are shown in Table 1. At 6 months postoperatively, 122 of 168 patients (72.6%) had a good functional prognosis, while the remaining 46 patients (27.4%) had a poor functional prognosis. The obtained results indicated that there were significant differences in age, cardiac disease, sarcopenia, BMI, serum albumin, and hemoglobin between the two groups (P < 0.05). The group with poor functional prognosis was older and had higher rates of cardiac disease and sarcopenia. In addition, they had a lower BMI, serum albumin, and hemoglobin levels.
Table 1.
Demographic data of the good and bad functional prognosis groups.
| Total (n = 168) | Good functional prognosis (n = 122) | Bad functional prognosis (n = 46) | P value | |
|---|---|---|---|---|
| Gender | ||||
| Male | 63 (37.5%) | 46 (37.7%) | 17 (37.0%) | |
| Female | 105 (62.5%) | 76 (62.3%) | 29 (63.0%) | 0.929 |
| Age (year) | 66.29 ± 6.65 | 64.46 ± 4.90 | 71.15 ± 8.15 | <0.001 |
| ≥60 and <70 | 129 (76.8%) | 104 (85.2%) | 25 (54.3%) | |
| ≥70 | 39 (23.2%) | 18 (14.8%) | 21 (45.7%) | <0.001 |
| Diabetes | ||||
| Yes | 37 (22.0%) | 27 (22.1%) | 10 (21.7%) | |
| No | 131 (78.0%) | 95 (77.9%) | 36 (78.3%) | 0.956 |
| Hypertensive disease | ||||
| Yes | 50 (29.8%) | 31 (25.4%) | 19 (41.3%) | |
| No | 118 (70.2%) | 91 (74.6%) | 27 (58.7%) | 0.069 |
| Cardiac disease | ||||
| Yes | 44 (26.2%) | 26 (21.3%) | 18 (39.1%) | |
| No | 124 (73.8%) | 96 (78.7%) | 28 (60.9%) | 0.019 |
| Hyperlipidemia | ||||
| Yes | 48 (28.6%) | 39 (32.0%) | 9 (19.6%) | |
| No | 120 (71.4%) | 83 (68.0%) | 37 (80.4%) | 0.113 |
| Sarcopenia | ||||
| Yes | 43 (25.6%) | 15 (12.3%) | 28 (60.9%) | |
| No | 125 (74.4%) | 107 (87.7%) | 18 (39.1%) | <0.001 |
| Time to surgery (day) | 2.57 ± 1.40 | 2.53 ± 1.43 | 2.67 ± 1.32 | 0.560 |
| BMI (kg/m2) | 23.06 ± 3.62 | 23.55 ± 3.33 | 20.57 ± 4.06 | 0.004 |
| Albumin (g/L) | 41.51 ± 3.68 | 42.12 ± 3.58 | 39.88 ± 3.49 | <0.001 |
| Hemoglobin (g/L) | 132.07 ± 14.23 | 133.55 ± 13.91 | 128.14 ± 14.47 | 0.028 |
| tmCSA/BW (cm2/kg) | 1.38 ± 0.18 | 1.40 ± 0.18 | 1.33 ± 0.17 | 0.018 |
| Grip strength (kg) | 21.86 ± 7.48 | 23.09 ± 7.22 | 18.62 ± 7.27 | <0.001 |
| Affected side | ||||
| Right | 59 (35.1%) | 39 (32.0%) | 20 (43.5%) | |
| Left | 109 (64.9%) | 83 (68.0%) | 26 (56.5%) | 0.163 |
| Fracture type | ||||
| A | 29 (17.3%) | 21 (17.2%) | 8 (17.4%) | |
| B | 24 (14.2%) | 14 (11.5%) | 10 (21.7%) | |
| C | 115 (68.5%) | 87 (71.3%) | 28 (60.9%) | 0.224 |
The fractures are classified using the radiological assessment method of the AO classification system. ∗Statistically significant difference (P < 0.05).
3.2. Screening of Predictors
The obtained radiographic results during postoperative follow-up revealed that there was no significant difference between the good functional prognosis group and the poor functional prognosis group (Table 2). Moreover, the two groups did not differ statistically in the recovery of knee range of motion, but the HSS scores of the two groups were significantly different. The HSS scores of the good functional prognosis group were significantly higher than those of the poor functional prognosis group at three months and six months postoperatively (both P < 0.001, Table 3). The HSS score at six months postoperatively was then used as the dependent variable where single-factor, multifactor linear regression analysis, and forward stepwise variable selection were performed to initially determine the relationship between the potential risk factors and the dependent variable. Three risk factors were selected from fifteen possible influences: advanced age (Beta = −0.48, P < 0.001, Partial R2 = 0.405), sarcopenia (Beta = −0.42, P < 0.001, Partial R2 = 0.173), and hypoalbuminemia (Beta = 0.14, P = 0.007, Partial R2 = 0.016); the results indicated that the relative magnitude of the total regression contribution of these three factors was 59.4% (Table 4). PCA results showed that there was no multicollinearity in the data distribution; P-P chart of regression-standardized residuals and histogram of residual analysis showed that the data distribution was linear and normal distribution, respectively (Figures 2 and 3). The variance inflation factor of predictors was less than 10, and the tolerance was greater than 0.1 showed that data distribution had independence and consistency of variance (Table 4). In summary, the model had good linear trend, independence, normality, and consistency of variance.
Table 2.
Radiologic outcomes at six months postoperatively.
| Radiologic outcomes | Good prognosis | Bad prognosis | P value |
|---|---|---|---|
| Insall-Salvati index | 0.99 ± 0.15 | 1.02 ± 0.14 | 0.141 |
| Blackburne-Peel index | 0.92 ± 0.16 | 0.89 ± 0.18 | 0.272 |
| Congruence angle (degree) | 1.80 ± 4.32 | 2.32 ± 4.09 | 0.483 |
| Lateral patellofemoral angle (degree) | 7.23 ± 2.66 | 6.78 ± 2.69 | 0.327 |
∗Statistically significant difference (P < 0.05).
Table 3.
Functional outcomes after surgery for patellar fracture.
| Functional outcomes | Improved group | Unimproved group | P value | |
|---|---|---|---|---|
| Range of motion (%) | Month 3 | 78.33 ± 4.41 | 77.15 ± 5.47 | 0.150 |
| Month 6 | 84.74 ± 4.55 | 83.82 ± 5.16 | 0.259 | |
| HSS scores (%) | Month 3 | 81.49 ± 6.22 | 68.87 ± 5.43 | <0.001 |
| Month 6 | 88.48 ± 5.31 | 74.41 ± 5.08 | <0.001 |
∗Statistically significant difference (P < 0.05).
Table 4.
Multivariable regression analyses for independent predictors of HSS knee scores at 6 months postoperatively.
| Model | Predictors | Beta | P value | Partial R2 | Tolerance | VIF |
|---|---|---|---|---|---|---|
| Multivariable | Age | -0.48 | <0.001 | 0.405 | 0.889 | 1.125 |
| Sarcopenia | -0.42 | <0.001 | 0.173 | 0.876 | 1.141 | |
| Albumin | 0.14 | 0.007 | 0.016 | 0.938 | 1.066 |
Linear regression analysis and forward stepwise variable selection with residual analysis of variance were used to determine if the model had linear trend, independence, normality, and variance congruence. VIF: variance inflation factor.
Figure 2.
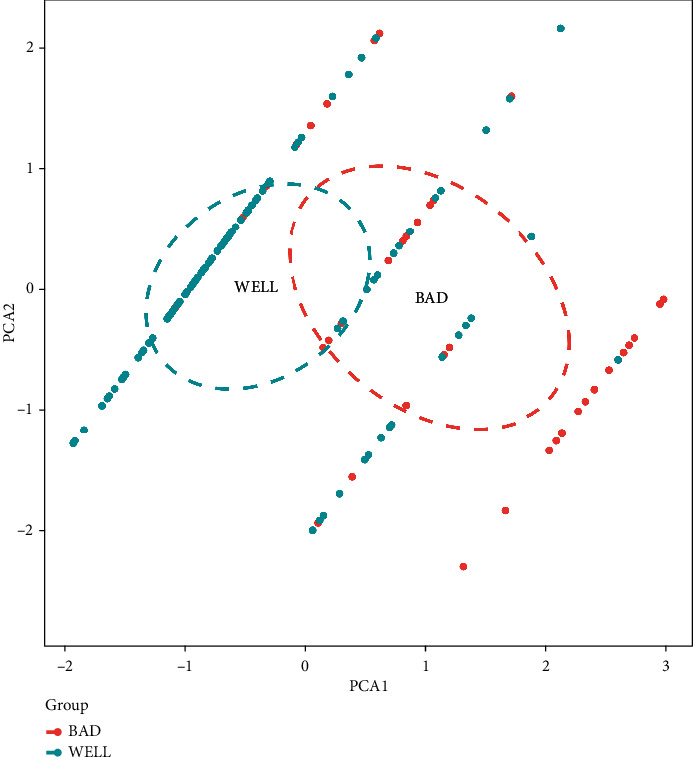
Results of principal component analysis. Blue dots represent good prognosis samples, while red dots represent poor prognosis samples.
Figure 3.
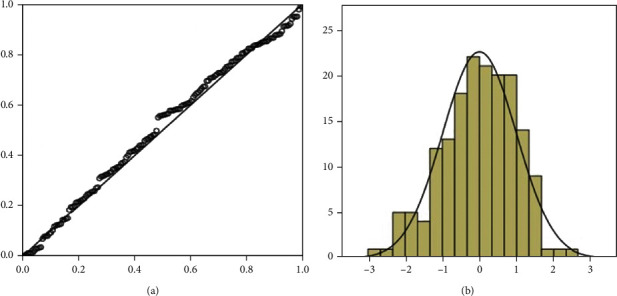
(a) P-P chart of regression-standardized residuals. (b) Histogram of residual analysis.
3.3. Establishment and Test of the Nomogram Prediction Model
A logistic model was then used to verify the three risk factors identified by the multifactorial linear regression model (Table 5); the obtained results indicated that age (OR 0.28 (95% CI 0.11-0.67), P = 0.005), sarcopenia (OR 0.11 (95% CI 0.05-0.26), P < 0.001), and serum albumin levels (OR 1.14 (95% CI 1.02-1.29), P = 0.025) were all statistically significant. Then, we used the R software to construct nomogram prediction model (Figure 4).
Table 5.
Chart of prediction factors.
| Variable | Prediction model | ||
|---|---|---|---|
| β | Odds ratio (95% CI) | P value | |
| (Intercept) | -3.442 | 0.03 (0-4.06) | 0.163 |
| Sarcopenia | -2.173 | 0.11 (0.05-0.26) | <0.001 |
| Age | -1.287 | 0.28 (0.11-0.67) | 0.005 |
| Albumin | 0.134 | 1.14 (1.02-1.29) | 0.025 |
β is the regression coefficient.
Figure 4.
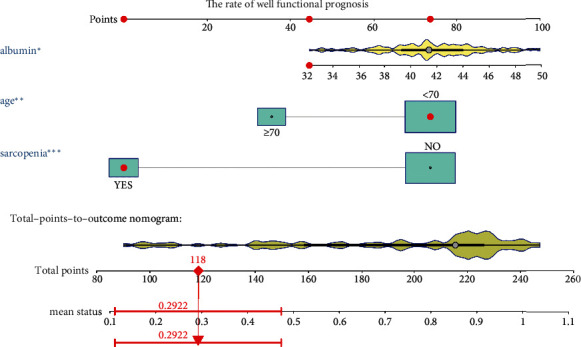
The nomogram model for predicting functional prognosis. Note: age, sarcopenia, and serum albumin levels were included. ∗P < 0.05, ∗∗P < 0.01, ∗∗∗P < 0.005.
The calibration curve of the nomogram was close to the perfect prediction curve of ideal model suggesting that the model can be used to predict the risk of poor functional outcome after patellar fracture surgery in the elderly patients (Figure 5(a)). The obtained AUC of this prediction model was 0.857 (95% CI (0.783-0.929)) (Figure 5(b)). In addition, the model showed a good predictive power with a C-index of 0.865 (95% CI (0.785-0.929)), 0.821 (95% CI (0.616-0.949)), and 0.836 (95% CI (0.767-0.904)) in the training set, the validation set, and the entire cohort, respectively. Figure 6 shows the decision analysis curve of a poor prediction model for functional outcome after patella fracture in the elderly. The decision analysis curve indicated that clinical decisions based on the nomogram prediction model could better predict the recovery of functional outcome.
Figure 5.
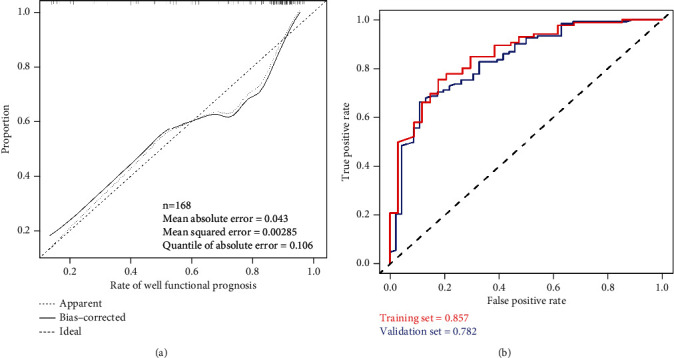
Evaluation of the nomogram prediction model. (a) A calibration curve for predicting the risk of poor functional outcome after patellar fracture in the elderly. The diagonal dashed line is the perfect prediction of the ideal model, while the solid line is the predictive power of the model. (b) The area under the curve (AUC) of a nomogram model indicates the probability of accurately predicting a poor postoperative functional outcome in a randomized patient selection scenario.
Figure 6.
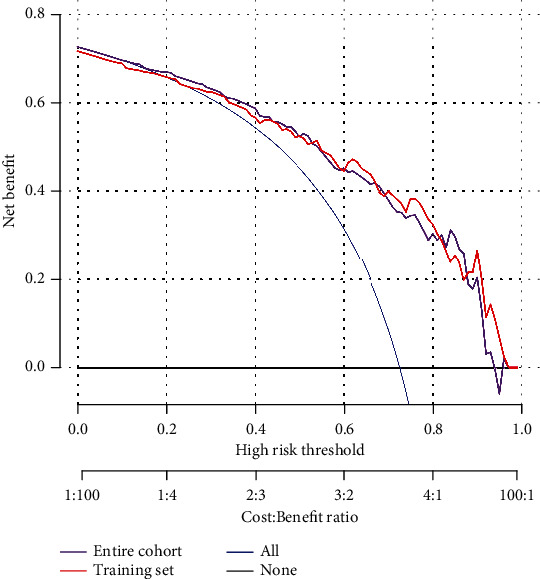
Decision analysis curve includes training test and overall groups.
4. Discussion
The development of the R software has led to nomogram prediction models being widely used in the field of clinical prognosis assessment. Previous studies have reported that nomogram prediction models have clear quantitative indexes which can accurately evaluate the prognosis [31–33]. This retrospective study assessed, for the first time, the risk of poor functional outcome after patella fracture surgery in the elderly using a nomogram prediction model that included three variables: age, sarcopenia, and serum albumin level. The obtained results after the internal sample survey indicated that the model has a strong predictive ability. In addition, the high C-index and AUC index indicated that the predictive model can be widely and accurately used to assess the functional prognosis of patellar fractures in the elderly. The HSS score was proposed by the American Hospital for Special Surgery in 1976, and it includes six dimensions: pain, function, joint mobility, muscle strength, knee flexion deformity, and knee stability. The score has been widely used for evaluating knee functional prognosis [34]. In this study, the HSS score at 6 months postoperatively was used as an index to assess the early functional outcome of elderly patella fracture patients. In addition, multifactorial linear regression analysis, logistic regression analysis, and the R software were used to construct a nomogram. Results obtained from the nomogram indicated that advanced age, sarcopenia, and hypoalbuminemia were the main risk factors affecting the functional outcome after patella fracture surgery.
Sarcopenia was first named by Rosenberg in 1989 [35]. It is primarily characterized by loss of muscle mass, low muscle strength, and/or low physical performance [36]. Sarcopenia is a systemic muscle disease which has serious physical and clinical consequences that significantly increases medical expenses [37]. Previous studies have reported that the direct medical costs of sarcopenia in the United States in 2000 was about $18.5 billion, accounting for 1.5% of the total medical expenditures in that year [38]. The impact of sarcopenia on the functional outcome of lower extremity fractures may be more pronounced than in the upper extremity fractures because the lower limb accounts for more than 50% of the body's skeletal muscle mass [39]. This study demonstrated that sarcopenia is a risk factor for poor functional outcome after patellar fracture in the elderly. The obtained results after conducting multifactorial linear regression analysis indicated that the relative degree of regression contribution by sarcopenia was 17.3%, and its P value in the logistic regression was <0.001, which was consistent with the results reported in other studies [40–42]. The adverse effects of sarcopenia on functional prognosis can be attributed to the disruption of the balance between the anabolic and catabolic pathways of muscle protein metabolism, the decrease in size and number of muscle fibers, the shift from type II to type I, and the infiltration of muscle and intermuscular fat. Previous studies have reported that all these factors severely affect the normal function of the skeletal muscle in patients with sarcopenia [43–45]. On the other hand, the reduction of the skeletal muscle mass reduces the balance control of the body and the mechanical load on the skeleton, thereby resulting in less stressful bone remodeling which causes osteoporosis and low bone mass, with both bone and muscle interacting to delay postoperative functional recovery [46]. Some studies have shown that resistance training and nutritional support therapy can improve the symptoms of sarcopenia. However, the ideal index for intervention has not yet been elucidated, and thus, further research is needed [47].
This study also found that a low preoperative serum albumin level was an important risk factor for poor functional outcome after patella fracture, which is consistent with the results reported in previous studies [48–51]. Serum albumin, the main component of total serum protein, is synthesized by the liver and plays an important role in maintaining blood colloid osmolarity, in vivo transport of metabolic substances, and nutritional support. Serum albumin is regarded as an important nutritional indicator, and low serum albumin levels are directly associated with the poor nutritional status of patients. However, further studies should be conducted to determine the specific impact of nutritional interventions on functional outcomes after surgery [52, 53].
The model developed in this study can effectively predict the risk of poor functional outcome after patella fracture surgery in the elderly. This can achieve individualized risk prediction, thereby helping clinicians to identify patients having a high risk of poor functional outcome at an early stage and thus take appropriate intervention measures. However, this study had some limitations: firstly, the cohort used was not representative of all patients with patella fractures; secondly, the study did not include all possible influencing factors, although the statistical examination has validated the reliability and validity of our predictive model; and thirdly, the study did not perform tests to assess physical functions such as gait speed, short physical fitness battery (SPPB), and timed walk test (TUG) because the patella fracture limited the patient's knee motor function, which to some extent influenced the assessment of the severity of sarcopenia.
5. Conclusion
This study developed a predictive model for assessing the risk of poor functional outcome after patella fracture surgery in the elderly, which the model has shown to be valid and reliable. The results obtained from the model suggest that advanced age, sarcopenia, and low serum albumin levels are high risk factors for a poor functional outcome.
Acknowledgments
This work was supported by the National Natural Science Foundation of China (No. 81371963).
Contributor Information
Yisheng Chen, Email: 1131303222@qq.com.
Jie Tao, Email: jietao1965@163.com.
Data Availability
We provided the original data of this manuscript in the supplementary information files.
Conflicts of Interest
The authors declare that they have no conflicts of interest.
Authors' Contributions
Chenting Ying and Chenyang Guo contributed equally to this work.
Supplementary Materials
This supplemental file is the original data for the 168 patients enrolled in the manuscript during preoperative and postoperative follow-up, which contains patient ID, functional outcome, sarcopenia, age, affect side, cardiac disease, hypertensive disease, diabetes, hyperlipidemia, BMI, grip strength, tmCSA/BW, albumin, hemoglobin, AO type, wait time for surgery, etc.
References
- 1.Byun S.-E., Sim J.-A., Joo Y. B., et al. Changes in patellar fracture characteristics: a multicenter retrospective analysis of 1596 patellar fracture cases between 2003 and 2017. Injury . 2019;50(12):2287–2291. doi: 10.1016/j.injury.2019.10.016. [DOI] [PubMed] [Google Scholar]
- 2.Larsen P., Court-Brown C. M., Vedel J. O., Vistrup S., Elsoe R. Incidence and epidemiology of patellar fractures. Orthopedics . 2016;39(6):e1154–e1158. doi: 10.3928/01477447-20160811-01. [DOI] [PubMed] [Google Scholar]
- 3.Melvin J. S., Mehta S. Patellar fractures in adults. The Journal of the American Academy of Orthopaedic Surgeons . 2011;19(4):198–207. doi: 10.5435/00124635-201104000-00004. [DOI] [PubMed] [Google Scholar]
- 4.Cruz-Jentoft A. J., Sayer A. A. Sarcopenia. Lancet . 2019;393(10191):2636–2646. doi: 10.1016/S0140-6736(19)31138-9. [DOI] [PubMed] [Google Scholar]
- 5.Cruz-Jentoft A. J., Baeyens J. P., Bauer J. M., et al. Sarcopenia: European consensus on definition and diagnosis: report of the European Working Group on Sarcopenia in Older People. Age and Ageing . 2010;39(4):412–423. doi: 10.1093/ageing/afq034. [DOI] [PMC free article] [PubMed] [Google Scholar]
- 6.Cruz-Jentoft A. J., Bahat G., Bauer J., et al. Sarcopenia: revised European consensus on definition and diagnosis. Age and Ageing . 2019;48(1):16–31. doi: 10.1093/ageing/afy169. [DOI] [PMC free article] [PubMed] [Google Scholar]
- 7.Newman A. B., Kupelian V., Visser M., et al. Strength, but not muscle mass, is associated with mortality in the health, aging and body composition study cohort. The Journals of Gerontology Series A: Biological Sciences and Medical Sciences . 2006;61(1):72–77. doi: 10.1093/gerona/61.1.72. [DOI] [PubMed] [Google Scholar]
- 8.Yamada M., Nishiguchi S., Fukutani N., et al. Prevalence of sarcopenia in community-dwelling Japanese older adults. Journal of the American Medical Directors Association . 2013;14(12):911–915. doi: 10.1016/j.jamda.2013.08.015. [DOI] [PubMed] [Google Scholar]
- 9.Woo J., Leung J., Sham A., Kwok T. Defining sarcopenia in terms of risk of physical limitations: a 5-year follow-up study of 3, 153 Chinese men and women. Journal of the American Geriatrics Society . 2009;57(12):2224–2231. doi: 10.1111/j.1532-5415.2009.02566.x. [DOI] [PubMed] [Google Scholar]
- 10.Yoshimura N., Muraki S., Oka H., et al. Is osteoporosis a predictor for future sarcopenia or vice versa? Four-year observations between the second and third ROAD study surveys. Osteoporosis International . 2017;28(1):189–199. doi: 10.1007/s00198-016-3823-0. [DOI] [PubMed] [Google Scholar]
- 11.Woo J., Leung J., Morley J. E. Defining sarcopenia in terms of incident adverse outcomes. Journal of the American Medical Directors Association . 2015;16(3):247–252. doi: 10.1016/j.jamda.2014.11.013. [DOI] [PubMed] [Google Scholar]
- 12.Yu R., Leung J., Woo J. Incremental predictive value of sarcopenia for incident fracture in an elderly Chinese cohort: results from the osteoporotic fractures in men (MrOs) study. Journal of the American Medical Directors Association . 2014;15(8):551–558. doi: 10.1016/j.jamda.2014.02.005. [DOI] [PubMed] [Google Scholar]
- 13.Jiang W., Li Y., Kotian R. N., Lin B., Zhang X. A novel three-dimensional strapping reduction for the treatment of patellar fractures. Journal of Orthopaedic Surgery and Research . 2019;14(1):p. 249. doi: 10.1186/s13018-019-1294-7. [DOI] [PMC free article] [PubMed] [Google Scholar]
- 14.Wild M., Fischer K., Hilsenbeck F., Hakimi M., Betsch M. Treating patella fractures with a fixed-angle patella plate--A prospective observational study. Injury . 2016;47(8):1737–1743. doi: 10.1016/j.injury.2016.06.018. [DOI] [PubMed] [Google Scholar]
- 15.Berg E. E. Extensile exposure of comminuted patella fractures using a tibial tubercle osteotomy: results of a new technique. Journal of Orthopaedic Trauma . 1998;12(5):351–355. doi: 10.1097/00005131-199806000-00010. [DOI] [PubMed] [Google Scholar]
- 16.Noordzij M., Dekker F. W., Zoccali C., Jager K. J. Sample size calculations. Nephron. Clinical Practice . 2011;118(4):c319–c323. doi: 10.1159/000322830. [DOI] [PubMed] [Google Scholar]
- 17.Henrichsen J. L., Wilhem S. K., Siljander M. P., Kalma J. J., Karadsheh M. S. Treatment of patella fractures. Orthopedics . 2018;41(6):e747–e755. doi: 10.3928/01477447-20181010-08. [DOI] [PubMed] [Google Scholar]
- 18.Chen L.-K., Lee W.-J., Peng L.-N., Liu L.-K., Arai H., Akishita M. Recent advances in sarcopenia research in Asia: 2016 update from the Asian Working Group for Sarcopenia. Journal of the American Medical Directors Association . 2016;17(8):767.e1–767.e7. doi: 10.1016/j.jamda.2016.05.016. [DOI] [PubMed] [Google Scholar]
- 19.Chen L.-K., Liu L.-K., Woo J., et al. Sarcopenia in Asia: consensus report of the Asian Working Group for Sarcopenia. Journal of the American Medical Directors Association . 2014;15(2):95–101. doi: 10.1016/j.jamda.2013.11.025. [DOI] [PubMed] [Google Scholar]
- 20.Kim T. N., Park M. S., Lee E. J., et al. Comparisons of three different methods for defining sarcopenia: an aspect of cardiometabolic risk. Scientific Reports . 2017;7(1):p. 6491. doi: 10.1038/s41598-017-06831-7. [DOI] [PMC free article] [PubMed] [Google Scholar]
- 21.Irrgang J. J., Anderson A. F. Development and validation of health-related quality of life measures for the knee. Clinical Orthopaedics and Related Research . 2002;402:95–109. doi: 10.1097/00003086-200209000-00009. [DOI] [PubMed] [Google Scholar]
- 22.Yang B., Tan H., Yang L., Dai G., Guo B. Correlating anatomy and congruence of the patellofemoral joint with cartilage lesions. Orthopedics . 2009;32(1):p. 20. doi: 10.3928/01477447-20090101-27. [DOI] [PubMed] [Google Scholar]
- 23.Gaillard R., Bankhead C., Budhiparama N., Batailler C., Servien E., Lustig S. Influence of patella height on total knee arthroplasty: outcomes and survival. The Journal of Arthroplasty . 2019;34(3):469–477. doi: 10.1016/j.arth.2018.10.037. [DOI] [PubMed] [Google Scholar]
- 24.Seyfettinoğlu F., Köse Ö., Oğur H. U., Tuhanioğlu Ü., Çiçek H., Acar B. Is there a relationship between patellofemoral alignment and Osgood-Schlatter disease? A Case-Control Study. The Journal of Knee Surgery . 2020;33(1):67–72. doi: 10.1055/s-0038-1676523. [DOI] [PubMed] [Google Scholar]
- 25.Dong J., Xu H., Jin G., et al. The adaptive change of patellofemoral joint after arthroscopic discoid lateral meniscus plasty: an observational study. Medicine (Baltimore) . 2018;97(6, article e9827) doi: 10.1097/MD.0000000000009827. [DOI] [PMC free article] [PubMed] [Google Scholar]
- 26.Roh Y. H., Noh J. H., Gong H. S., Baek G. H. Effect of low appendicular lean mass, grip strength, and gait speed on the functional outcome after surgery for distal radius fractures. Archives of Osteoporosis . 2017;12(1):p. 41. doi: 10.1007/s11657-017-0335-2. [DOI] [PubMed] [Google Scholar]
- 27.Kramer A. A., Zimmerman J. E. Assessing the calibration of mortality benchmarks in critical care: the Hosmer-Lemeshow test revisited. Critical Care Medicine . 2007;35(9):2052–2056. doi: 10.1097/01.CCM.0000275267.64078.B0. [DOI] [PubMed] [Google Scholar]
- 28.Pencina M. J., D'Agostino R. B. Overall C as a measure of discrimination in survival analysis: model specific population value and confidence interval estimation. Statistics in Medicine . 2004;23(13):2109–2123. doi: 10.1002/sim.1802. [DOI] [PubMed] [Google Scholar]
- 29.Kang X.-R., Chen B., Chen Y.-S., et al. A prediction modeling based on SNOT-22 score for endoscopic nasal septoplasty: a retrospective study. PeerJ . 2020;8, article e9890 doi: 10.7717/peerj.9890. [DOI] [PMC free article] [PubMed] [Google Scholar]
- 30.Van Calster B., Wynants L., Verbeek J. F. M., et al. Reporting and interpreting decision curve analysis: a guide for investigators. European Urology . 2018;74(6):796–804. doi: 10.1016/j.eururo.2018.08.038. [DOI] [PMC free article] [PubMed] [Google Scholar]
- 31.Polterauer S., Grimm C., Hofstetter G., et al. Nomogram prediction for overall survival of patients diagnosed with cervical cancer. British Journal of Cancer . 2012;107(6):918–924. doi: 10.1038/bjc.2012.340. [DOI] [PMC free article] [PubMed] [Google Scholar]
- 32.Wei L., Champman S., Li X., et al. Beliefs about medicines and non-adherence in patients with stroke, diabetes mellitus and rheumatoid arthritis: a cross-sectional study in China. BMJ Open . 2017;7(10, article e017293) doi: 10.1136/bmjopen-2017-017293. [DOI] [PMC free article] [PubMed] [Google Scholar]
- 33.Yang J., Li Y., Liu Q., et al. Brief introduction of medical database and data mining technology in big data era. Journal of Evidence-Based Medicine . 2020;13(1):57–69. doi: 10.1111/jebm.12373. [DOI] [PMC free article] [PubMed] [Google Scholar]
- 34.Insall J. N., Ranawat C. S., Aglietti P., Shine J. A comparison of four models of total knee-replacement prostheses. The Journal of Bone and Joint Surgery. American Volume . 1976;58(6):754–765. doi: 10.2106/00004623-197658060-00003. [DOI] [PubMed] [Google Scholar]
- 35.Janssen I. Evolution of sarcopenia research. Applied Physiology, Nutrition, and Metabolism . 2010;35(5):707–712. doi: 10.1139/H10-067. [DOI] [PubMed] [Google Scholar]
- 36.Chen L.-K., Woo J., Assantachai P., et al. Asian Working Group for Sarcopenia: 2019 consensus update on sarcopenia diagnosis and treatment. Journal of the American Medical Directors Association . 2020;21(3):300–307.e2. doi: 10.1016/j.jamda.2019.12.012. [DOI] [PubMed] [Google Scholar]
- 37.Steffl M., Sima J., Shiells K., Holmerova I. The increase in health care costs associated with muscle weakness in older people without long-term illnesses in the Czech Republic: results from the Survey of Health, Ageing and Retirement in Europe (SHARE) Clinical Interventions in Aging . 2017;12:2003–2007. doi: 10.2147/CIA.S150826. [DOI] [PMC free article] [PubMed] [Google Scholar]
- 38.Janssen I., Shepard D. S., Katzmarzyk P. T., Roubenoff R. The healthcare costs of sarcopenia in the United States. Journal of the American Geriatrics Society . 2004;52(1):80–85. doi: 10.1111/j.1532-5415.2004.52014.x. [DOI] [PubMed] [Google Scholar]
- 39.Janssen I., Heymsfield S. B., Wang Z. M., Ross R. Skeletal muscle mass and distribution in 468 men and women aged 18-88 yr. Journal of Applied Physiology . 2000;89(1):81–88. doi: 10.1152/jappl.2000.89.1.81. [DOI] [PubMed] [Google Scholar]
- 40.Chang C.-D., Wu J. S., Mhuircheartaigh J. N., et al. Effect of sarcopenia on clinical and surgical outcome in elderly patients with proximal femur fractures. Skeletal Radiology . 2018;47(6):771–777. doi: 10.1007/s00256-017-2848-6. [DOI] [PubMed] [Google Scholar]
- 41.Chen Y.-P., Wong P.-K., Tsai M., Jr., et al. The high prevalence of sarcopenia and its associated outcomes following hip surgery in Taiwanese geriatric patients with a hip fracture. Journal of the Formosan Medical Association . 2020;119(12):1807–1816. doi: 10.1016/j.jfma.2020.02.004. [DOI] [PubMed] [Google Scholar]
- 42.Landi F., Calvani R., Ortolani E., et al. The association between sarcopenia and functional outcomes among older patients with hip fracture undergoing in-hospital rehabilitation. Osteoporosis International . 2017;28(5):1569–1576. doi: 10.1007/s00198-017-3929-z. [DOI] [PubMed] [Google Scholar]
- 43.Ciciliot S., Rossi A. C., Dyar K. A., Blaauw B., Schiaffino S. Muscle type and fiber type specificity in muscle wasting. The International Journal of Biochemistry & Cell Biology . 2013;45(10):2191–2199. doi: 10.1016/j.biocel.2013.05.016. [DOI] [PubMed] [Google Scholar]
- 44.Nilwik R., Snijders T., Leenders M., et al. The decline in skeletal muscle mass with aging is mainly attributed to a reduction in type II muscle fiber size. Experimental Gerontology . 2013;48(5):492–498. doi: 10.1016/j.exger.2013.02.012. [DOI] [PubMed] [Google Scholar]
- 45.Correa-de-Araujo R., Harris-Love M. O., Miljkovic I., Fragala M. S., Anthony B. W., Manini T. M. The need for standardized assessment of muscle quality in skeletal muscle function deficit and other aging-related muscle dysfunctions: a symposium report. Frontiers in Physiology . 2017;8:p. 87. doi: 10.3389/fphys.2017.00087. [DOI] [PMC free article] [PubMed] [Google Scholar]
- 46.Batsis J. A., Mackenzie T. A., Jones J. D., Lopez-Jimenez F., Bartels S. J. Sarcopenia, sarcopenic obesity and inflammation: results from the 1999-2004 National Health and Nutrition Examination Survey. Clinical Nutrition . 2016;35(6):1472–1483. doi: 10.1016/j.clnu.2016.03.028. [DOI] [PMC free article] [PubMed] [Google Scholar]
- 47.Dent E., Morley J. E., Cruz-Jentoft A. J., et al. International clinical practice guidelines for sarcopenia (ICFSR): screening, diagnosis and management. The Journal of Nutrition, Health & Aging . 2018;22(10):1148–1161. doi: 10.1007/s12603-018-1139-9. [DOI] [PubMed] [Google Scholar]
- 48.Sim S. D., Sim Y. E., Tay K., et al. Preoperative hypoalbuminemia: poor functional outcomes and quality of life after hip fracture surgery. Bone . 2021;143, article 115567 doi: 10.1016/j.bone.2020.115567. [DOI] [PubMed] [Google Scholar]
- 49.Ryan S., Politzer C., Fletcher A., Bolognesi M., Seyler T. Preoperative hypoalbuminemia predicts poor short-term outcomes for hip fracture surgery. Orthopedics . 2018;41(6):e789–e796. doi: 10.3928/01477447-20180912-03. [DOI] [PubMed] [Google Scholar]
- 50.Bohl D. D., Shen M. R., Hannon C. P., Fillingham Y. A., Darrith B., Della Valle C. J. Serum albumin predicts survival and postoperative course following surgery for geriatric hip fracture. The Journal of Bone and Joint Surgery. American Volume . 2017;99(24):2110–2118. doi: 10.2106/JBJS.16.01620. [DOI] [PubMed] [Google Scholar]
- 51.Wilson J. M., Boissonneault A. R., Schwartz A. M., Staley C. A., Schenker M. L. Frailty and malnutrition are associated with inpatient postoperative complications and mortality in hip fracture patients. Journal of Orthopaedic Trauma . 2019;33(3):143–148. doi: 10.1097/BOT.0000000000001386. [DOI] [PubMed] [Google Scholar]
- 52.Kim S., McClave S. A., Martindale R. G., Miller K. R., Hurt R. T. Hypoalbuminemia and clinical outcomes: what is the mechanism behind the relationship? The American Surgeon . 2017;83(11):1220–1227. doi: 10.1177/000313481708301123. [DOI] [PubMed] [Google Scholar]
- 53.Cabrerizo S., Cuadras D., Gomez-Busto F., Artaza-Artabe I., Marín-Ciancas F., Malafarina V. Serum albumin and health in older people: review and meta analysis. Maturitas . 2015;81(1):17–27. doi: 10.1016/j.maturitas.2015.02.009. [DOI] [PubMed] [Google Scholar]
Associated Data
This section collects any data citations, data availability statements, or supplementary materials included in this article.
Supplementary Materials
This supplemental file is the original data for the 168 patients enrolled in the manuscript during preoperative and postoperative follow-up, which contains patient ID, functional outcome, sarcopenia, age, affect side, cardiac disease, hypertensive disease, diabetes, hyperlipidemia, BMI, grip strength, tmCSA/BW, albumin, hemoglobin, AO type, wait time for surgery, etc.
Data Availability Statement
We provided the original data of this manuscript in the supplementary information files.