

Abstract
Introduction
Altered peripheral immune/inflammatory system and brain volumetric changes have been implicated in the pathophysiology of bipolar disorder (BD). This study aimed to evaluate how peripheral levels of cytokines are related to volumetric brain changes in euthymic patients with BD.
Methods
Euthymic patients with BD (n=21) and healthy controls (n=22) were enrolled in this exploratory study. Blood samples were collected on the same day of clinical assessment and neuroimaging. Cytokines were measured through cytometric bead array (CBA) method. Neuroimaging data were acquired using a sagittal three-dimensional Magnetic Resonance Imaging (MRI) T1-weighted fast field echo sequence and was processed using FreeSurfer.
Results
Compared to controls, BD patients had significantly lower volumes in the cingulate, medial-orbitofrontal (MOF) and parahippocampal regions. We found a negative correlation between right MOF volume and interferon-gamma (IFN-γ) levels (β −0.431, p=0.049) and a positive correlation between IL-10 levels and left posterior cingulate volume (β 0.457, p=0.048).
Conclusion
Our results support the involvement of inflammatory pathways in structural brain changes in BD.
Keywords: Bipolar disorder, neuroinflammation, neuroimaging, gray matter, prefrontal cortex, accelerated aging
Background
The pathophysiology of BD is complex, involving genetic, epigenetic and environmental factors1,2. Current theoretical frameworks postulate that these factors underlie neuronal changes (e.g. hyperexcitability), further leading towards: a) circuitry and brain matter changes (e.g., respectively, default mode network alterations and gray matter loss); b) systemic consequences (e.g. increased inflammation and oxidative stress); and c) behavioral correlates (e.g. changes in energy and activity levels)3. Together these pathways determine functional outcome in BD, commonly marked by cognitive deficits and poor psychosocial adjustment3–5.
Over the years, BD has been linked to peripheral and central nervous system immune and/or inflammatory mechanisms6–8. Cytokines – molecules responsible for immune cells interactios – have been reported to be increased in patients with BD, especially during mood episodes9–12, including IL-1β, IL-4, IL-6, IL-10, TNF-α, and IFN-γ8,13–15.
Regarding structural neuroimaging findings, reductions in brain grey matter (GM) volumes and thickness in several regions have been consistently reported in BD16–18. Specific cortical areas found with low GM were frontal regions, including orbitofrontal cortex, inferior frontal cortex, pars orbitalis, middle frontal cortex, right ventral prefrontal cortex, right fronto-insular cortex,19–22; occipitotemporal regions, including lingual gyrus, planum polare, temporal pole, and temporal gyrus,19,20,22,23, and other cortical regions, like parahippocampal gyrus and cingulate cortex22,24,25, and subcortical regions, namely insula, claustrum, hippocampus, and thalamus20,26.
Despite the evidence pointing out the involvement of both peripheral inflammation and structural brain changes in BD, only a few studies have evaluated the potential link or association between these two different features of BD pathophysiology. Apart from few studies showing a link between volumetric alterations and IL-619,27, there is a dearth of research investigating potential associations between inflammatory biomarkers and volumetric changes in BD28. Our study aimed at exploring potential correlations between peripheral inflammatory biomarkers and frontolimbic volumes in patients with BD.
Methods
Study Sample
This study was performed at the UT Center of Excellence on Mood Disorders, Houston, TX. Twenty-one patients with BD type I were recruited from the associated outpatient clinic. Healthy controls (n=22) were recruited through flyers placed in the community.
The inclusion criteria for cases and control were a) Age 18–65 years old; b) any race/ethnicity; c) fluency in English; d) have the capacity to give informed consent. Additional specific inclusion criteria for the patient group were a) Bipolar I disorder; b) euthymic mood state, identified as lack of any active symptoms of severe depression or mania or psychosis (based on the clinical scales mentioned below). The inclusion criteria for controls incorporated a) no lifetime diagnosis of major psychiatric and neurologic disorders; b) no family history of any axis-I psychiatric disorder and/or hereditary neurologic disorders in first-degree relatives. For both cases and controls, the exclusion criteria were a) any current major medical problems that could potentially affect brain anatomy or function; b) history of any central nervous system diseases; c) family history of hereditary neurological disorders; d) pregnancy; e) substance abuse or dependence; f) any contraindications to magnetic resonance imaging (e.g., floating metallic objects in the body). The Structured Clinical Interview SCID for DSM-IV29 was administered to confirm the diagnosis of BD among patients and the absence of a psychiatric diagnosis in controls. Written informed consent was obtained from patients and healthy controls. The UT Health Institutional Review Board approved the study protocol.
Demographic data, including age, sex, weight, height, and education were obtained. Any potential confounding effects of cognitive deficits were ruled out through our exclusionary criteria and cognitive assessment with the MoCA30. Only patients performing above the cutoff points in the general cognitive assessment scale were recruited for the study.
Clinical scales
To assess clinical variables, the following scales were used – a) The Clinical Global Impressions (CGI) Scale with subscales of CGI-1 = severity of mania, CGI-2 = severity of depression, CGI-3 = severity of overall illness; b) Montgomery–Åsberg Depression Rating Scale (MADRS) for depressive symptoms; c) Young Mania Rating Scale (YMRS) for manic symptoms d) Behavioral Inhibition System (BIS) scale for aversive motives; and e) Functioning Assessment Short Test (FAST) for functional impairment.
Blood work
Blood samples were collected in vacuum tubes, centrifuged twice at 1,800g, and samples were stored in −80° C freezer for further processing. Plasma levels of interleukins (IL-1β, 2, 4, 6, 8,10), TNF-α, IFN-γ were assessed through cytometric bead array (CBA). The concentrations were measured in pg/ml. All imaging and plasma analyses were performed blindly to the clinical status of the participants.
Neuroimaging
Based on current literature, frontolimbic regions were assessed to compare between BD patients and controls. All structural neuroimaging scans were acquired using a 3.0 T magnetic resonance imaging (MRI) Philips scanner (Philips Medical System, Andove, MA) using a sagittal three-dimensional T1-weighted fast field echo sequence with the following parameters: Repetition time (TR) = 8.0 ms, echo time (TE) = 3.68 ms, flip angle = 6°, field of view (FOV) = 288 mm, slice thickness =0.88 mm, matrix size = 288×288 and 180 slices. Cortical thickness and grey matter volumes measures were acquired using FreeSurfer suite version 6.031–33. FreeSurfer is a fully automated software that performs motion correction, intensity normalization, automated topology correction, and atlas-based cortical segmentation and labeling of MRI images34.
Analyses
The statistical packages STATA35 and SPSS36 were used for the statistical analyses. Student t-test and chi-square test were used for the statistical inference regarding the comparison of both groups on the variables of interest. Linear regression was used for the correlation analysis between volumetric data and cytokines, with age as a covariate, and further to assess the correlation between clinical data with significant volumetric and cytokine levels.
Results
Both groups had similar demographic profiles and, as expected, all psychopathological scores were significantly higher in BD patients compared to controls (Table 1). At the time of the study, 23% of the BD group were using lithium, 27% were taking anticonvulsants, 50% were on antidepressants, 5% were on atypical and 14% were on typical antipsychotics.
Table 1:
Demographic and clinical comparison between patients with BD and controls
| Cases (n=21) | Controls (n=22) | P | |
|---|---|---|---|
| Age (Mean ± SD) in years | 33.9 ± 9.17 | 33.91 ± 9.99 | 0.999 |
| Sex [Male n (%)] | 7 (33.3) | 9 (40.9) | 0.607 |
| Education (Mean ± SD) in years | 14.8 ± 2.84 | 13.45 ± 1.97 | 0.086 |
| BMI (Mean ± SD) | 27.86 ± 7.01 | 30.17 ± 7.29 | 0.349 |
| CGI-1 | 2 ± 0.95 | 1 ± 0 | < 0.001 |
| CGI-2 | 2.52 ± 1.12 | 1 ± 0 | < 0.001 |
| CGI-3 | 2.86 ± 0.96 | 1 ± 0 | < 0.001 |
| MADRS | 12.1 ± 9.76 | 0.14 ± 0.47 | < 0.001 |
| YMRS | 6.00 ± 6.29 | 0.05 ± 0.213 | < 0.001 |
| BIS | 54.43 ± 11.04 | 37.18 ± 10.67 | < 0.001 |
| FAST | 29.84 ± 15.3 | 3.5 ± 4.67 | < 0.001 |
Footnotes:
CGI- Clinical Global Impressions, CGI-1 = severity of mania, CGI-2 = severity of depression CGI-3 = severity of overall illness, MADRS- Montgomery–Åsberg Depression Rating Scale, YMRS - Young Mania Rating Scale, BIS-Behavioral Inhibition System scale, FAST- Functioning Assessment Short Test; the Student t-test and the chi-square test were used for the statistical inference; a significance level of 0.05 was adopted
No significant differences were found between BD patients and controls with regards to any of the assessed cytokine levels (Table 2).
Table 2:
Serum cytokine level differences between patients with BD and healthy controls
| Serum cytokine levels (pg/mL) | Cases (n=21) Mean ± SD | Controls (n=22) Mean ± SD | p |
|---|---|---|---|
| IFN-γ | 0.708 ± 0.269 | 0.766 ± 0.447 | 0.609 |
| IL-1b | 8.319 ± 2.428 | 7.856 ± 2.913 | 0.575 |
| IL-2 | 2.000 ± 0.567 | 2.274 ± 1.050 | 0.297 |
| IL-4 | 2.957 ± 1.059 | 3.048 ± 1.850 | 0.847 |
| IL-6 | 5.350 ± 2.946 | 4.303 ± 1.727 | 0.161 |
| IL-8/CXCL8 | 6.974 ± 2.452 | 6.300 ± 2.478 | 0.375 |
| IL-10 | 12.897 ± 6.274 | 13.100 ± 7.805 | 0.925 |
| TNF-α | 9.716 ± 2.155 | 9.040 ± 2.587 | 0.359 |
Footnotes:
IFN-γ: interferon-gamma, IL: interleukin, CXCL8: C-X-C Motif Chemokine Ligand 8, TNF-α: tumor necrosis factor-alpha
With respect to the volumes of the brain structures analyzed, BD patients had significantly lower GM volumes in i) left Caudal-Anterior-Cingulate; ii) left Pars orbitalis; iii) left Posterior-Cingulate; iv) right Medial-Orbito-Frontal; v) right Parahippocampal; and had lower WM left Pars orbitalis volume (Table 3). Effect size for all the significantly lower volumes were at least medium (p < 0.05, d > 0.5). No other volumetric differences were found in frontal, hippocampus or amygdala regions between BD patients and healthy controls.
Table 3:
Frontolimbic differences between patients with BD and healthy controls
| Structural regions (volume in mm3) | Cases (n=21) Mean ± SD | Controls (n=22) Mean ± SD | p | Cohen’s d |
|---|---|---|---|---|
| LH Caudal-Anterior-Cingulate | 1.109 ± 0.208 | 1.295 ± 0.303 | 0.03 | 0.716 |
| RH Caudal-Anterior-Cingulate | 1.521 ± 0.365 | 1.516 ± 0.364 | 0.96 | 0.014 |
| LH Pars Orbitalis | 1.397 ± 0.261 | 1.583 ± 0.261 | 0.02 | 0.713 |
| RH Pars Orbitalis | 1.752 ± 0.277 | 1.853 ± 0.299 | 0.26 | 0.35 |
| LH Posterior-Cingulate | 2.001 ± 0.272 | 2.251 ± 0.447 | 0.03 | 0.676 |
| RH Posterior-Cingulate | 2.241 ± 0.346 | 2.183 ± 0.447 | 0.63 | 0.145 |
| LH Medial-Orbito-Frontal | 3.354 ± 0.457 | 3.470 ± 0.459 | 0.41 | 0.253 |
| RH Medial-Orbito-Frontal | 3.204 ± 0.355 | 3.491 ± 0.564 | 0.05 | 0.609 |
| LH Parahippocampal | 1.541 ± 0.271 | 1.635 ± 0.256 | 0.25 | 0.357 |
| RH Parahippocampal | 1.417 ± 0.200 | 1.583 ± 0.211 | 0.01 | 0.807 |
| WM LH Parsorbitalis | 0.566 ± 0.120 | 0.668 ± 0.153 | 0.02 | 0.742 |
Footnotes:
LH – left hemisphere, RH- right hemisphere, WM- white matter the Student t-test was used for the statistical inference; a significance level of 0.05 was adopted
With a regression model adjusted for age as a covariate in regions significantly different between cases and controls, a significant negative correlation was found between the RH Medial-Orbito-Frontal volume and IFN-γ (β −0.431, p=0.049), as well as a significant positive correlation between IL-10 and LH Posterior-Cingulate volume (β 0.457, p=0.048) in BD patients (figure 1, figure 2). No significant correlations were reported between any other cytokine and other brain structures in BD patients or healthy controls.
Figure 1: Correlation between IFN-γ and medial orbitofrontal gray matter volume between patients with BD and controls.
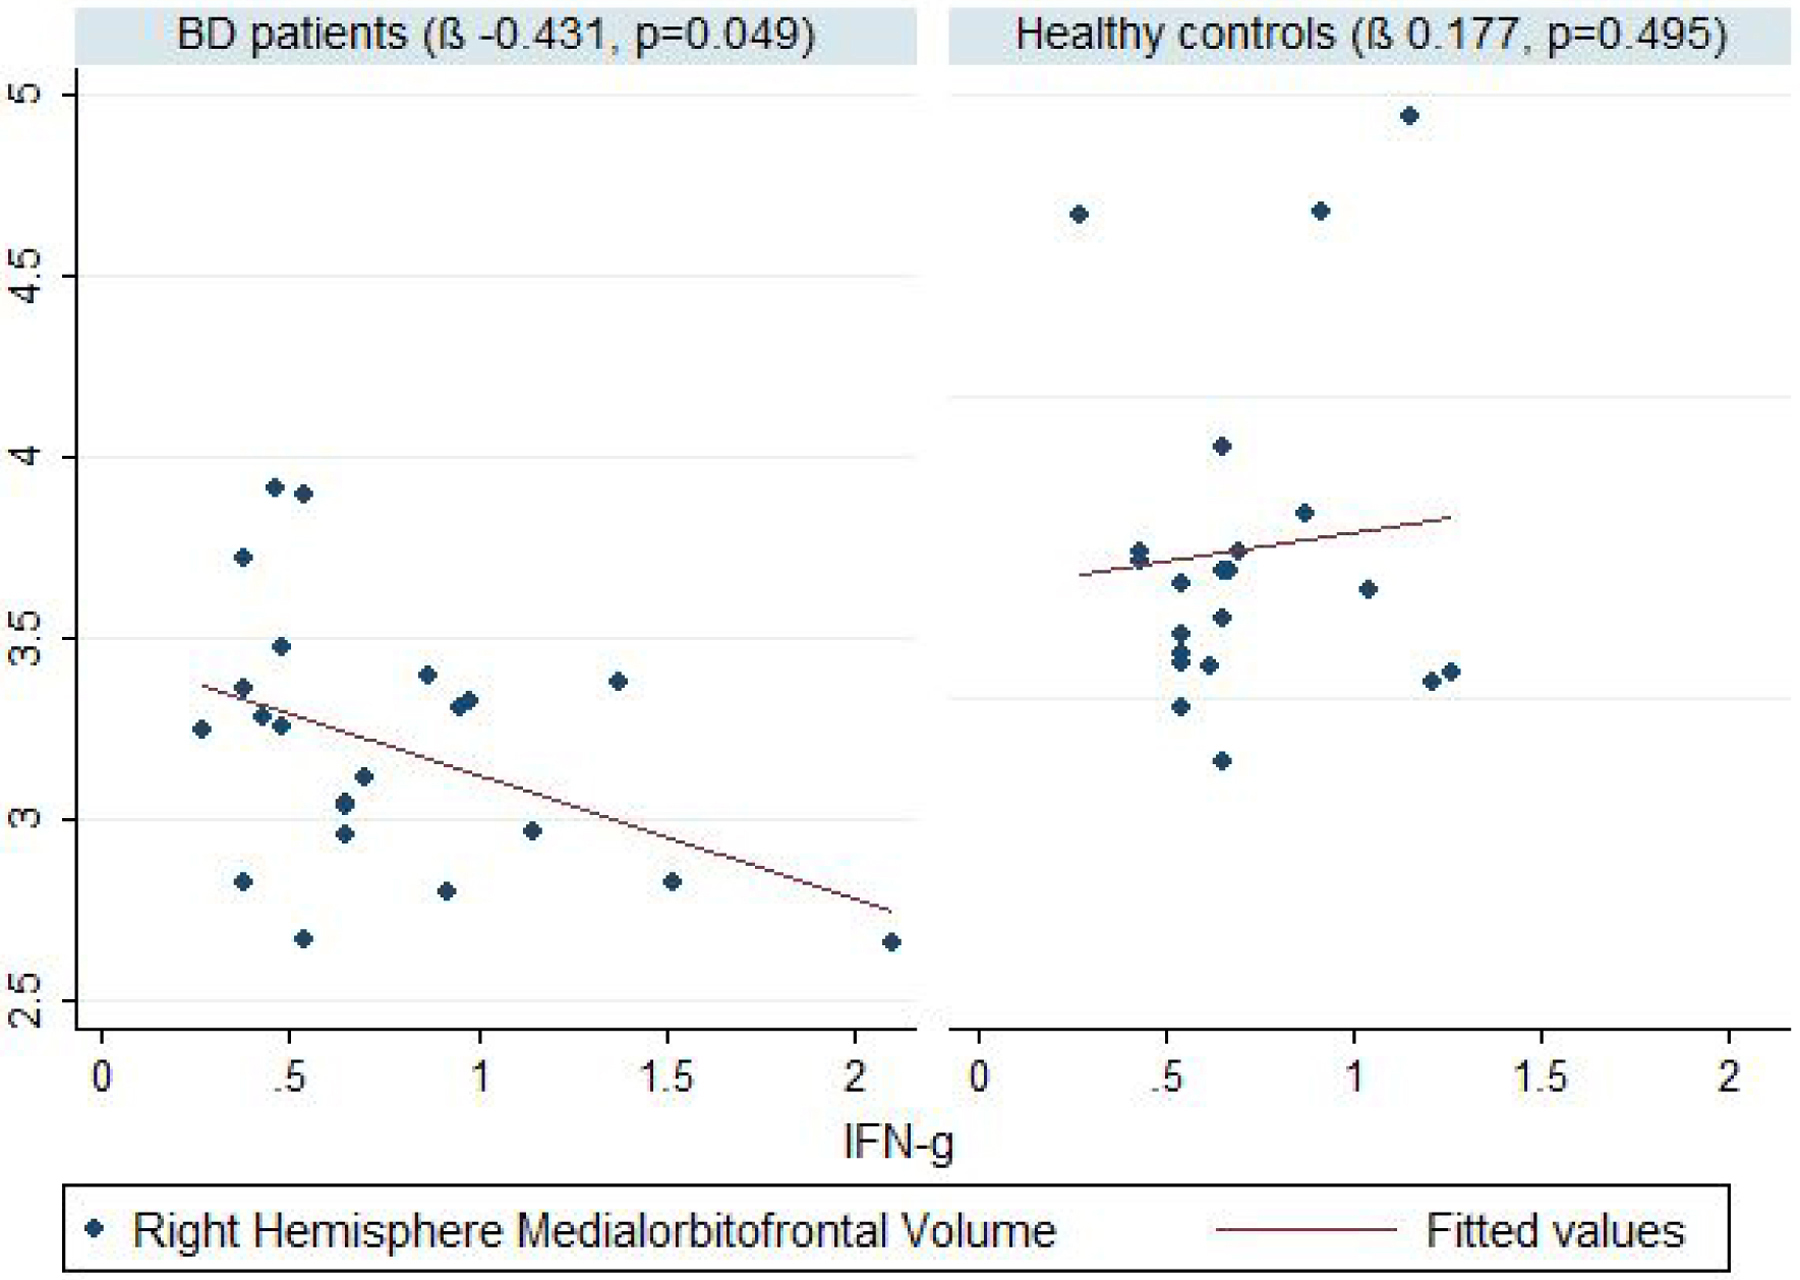
Footnotes:
Volumes in mm3, BD- bipolar disorder, IFN-γ - interferon-gamma
Linear regression was used for the statistical inference, with age as a covariate. A significance level of 0.05 was adopted
Figure 2: Correlation between IL-10 and medial posterior cingulate gray matter volume between patients with BD and controls.

Footnotes:
Volumes in mm3, BD- bipolar disorder, IL-10- Interleukin 10
Linear regression was used for the statistical inference, with age as a covariate. A significance level of 0.05 was adopted
Discussion
In our exploratory study, we found that peripheral immune mediators correlate with frontolimbic changes implicated in the pathophysiology of BD. Specifically, we identified negative correlation between medial-orbito-frontal volumes and levels of IFN-γ, a pro-inflammatory cytokine, while posterior cingulate volumes were positively correlated with the levels of the anti-inflammatory cytokine IL-10.
The relationship between immune–inflammatory pathways and mood disorders has been extensively investigated37–39. While previous studies have shown increased levels of pro-inflammatory cytokines in BD, this evidence has been more consistent in patients with active bipolar depression, mania/hypomania or mixed mood states9–12. For example, high levels of IL-6 have been reported during mania/hypomania, with IL-6 returning to baseline levels after treatment with mood stabilizers40–42. We did not find significant differences between patients and controls in the levels of citokynes. Actually, this lack of difference might reflect the fact that our sample comprised only clinically stable euthymic outpatients.
As expected, there were significant differences between patients and controls in volumes of frontolimbic regions implicated in emotion processing and BD pathophysiology43,44. Even with small sample size in this study, the effect size showed significant difference in BD patients. Chen et al. reported volumetric differences in regions like orbitofrontal cortex, lingual gyrus, inferior frontal cortex, middle frontal cortex, and planum polare, which seem to be significantly smaller in patients with BD compared to controls19. In the same study, the volume of certain structures (i.e. orbitofrontal cortex, middle frontal cortex, inferior frontal cortex, cingulate cortex, lingual gyrus, superior temporal cortex and Heschl’s gyrus) were negatively correlated with IL-6 receptor levels, suggesting that high levels of pro-inflammatory mediators might affect brain structure19. Bai et al. also reported that levels of pro-inflammatory mediators (IL-6 and sTNF-R1) are associated with greater reductions of 12 GM volumes (R. cerebellar lobule, R. putamen, L. putamen, R. superior frontal gyrus, L. lingual gyrus, L. precentral gyrus, R. fusiform gyrus, L. calcarine, R. precuneus, L. inferior temporal gyrus, L. hippocampus, L. superior frontal gyrus) in BD patients45. Our finding of a negative correlation between right medial-orbito-frontal volumes and the levels of IFN-γ is in line with these previous reports.
Our results also show positive correlation between left posterior cingulate cortex volumes and IL-10 levels in BD patients. IL-10 is an anti-inflammatory cytokine and has been found to be increased in the early stages of BD15,46. Actually, the increase of IL-10 follows a heightend inflammatory response as a compensatory mechanism47. While the involvement of cingulate cortex in emotional processing and pathophysiology of mood disorders has been well-described, there is no clear consensus about the function of posterior cingulate cortex (PCC) within system-level models of brain function48. One hypothesis is that PCC plays a central role in supporting internally directed cognition as it shows increased activity when individuals retrieve autobiographical memories or plan for the future49. PCC also plays a direct role in regulating the focus of attention and the balance between internally and externally focused thoughts50.
Altogether all results suggest that inflammation, as evidenced by pro- and anti-inflammatory cytokines, might be involved in progressive structural changes in brain areas implicated in emotion processing and pathophysiology of BD. Interestingly, an ‘allostatic load’ theory has been proposed to explain the progressive changes in BD, also called ‘neuroprogression’, based on the physiological ‘wear and tear’ in response to multiple stressors, and associated with increased peripheral inflammation among other biological processes51.
Our study had several limitations. First, all patients were medicated at the time of their participation in the study. The lack of significant differences in cytokine levels between patients and controls can also be attributed to different effects of medication on cytokines52–54.
Literature from studies in rodents and human cell lines have showed effect of psychotropic medications on brain volume changes in BD. While lithium and valproate have shown neurotrophic effects in vitro, antipsychotics; especially first-generation ones have been associated with brain volume loss55. Specifically, ACC region has been found with significantly lower volume in earlier phases of BD56. Given our sample size and euthymic status of our patients, it was not possible to assess impact of psychotropic medications in our patients.
Second, the small sample size is another limitation of our study, preventing us from carrying out stratified analyses. Third, the cross-sectional nature of study limited our ability to infer causal relationships between inflammatory biomarkers and GM volumes. Taking into consideration that the inflammatory cytokines per se could be influenced by many factors including body weight and other medical comorbidities, it will be important to follow the trajectory of both inflammatory biomarkers and GM volumes in drug-naïve and drug-free patients.
In summary, our findings corroborate the importance of the complex interactions between inflammation and structurcal brain changes in the pathophysiology of BD. Future studies including patients in different mood states and adopting longitudinal designs are of pivotal importance to further elucidate this complex relationship and its possible implications for a better understanding of BD, its pathophysiology, and ultimately its management.
Acknowledgments:
Partly supported by NIMH grant 1R01MH085667-01
Footnotes
Disclosure information: Satyajit Mohite, Haitham Salem, Thiago Cordeiro, Jonika Tannous, Benson Mwangi, Sudhakar Selvaraj, Jair Soares, Marsal Sanches, and Antonio Teixeira have no conflicts of interest to disclose
References
- 1.Mühleisen TW, Leber M, Schulze TG, et al. Genome-wide association study reveals two new risk loci for bipolar disorder. Nature communications. 2014;5(1):1–8. [DOI] [PubMed] [Google Scholar]
- 2.Lichtenstein P, Yip BH, Björk C, et al. Common genetic determinants of schizophrenia and bipolar disorder in Swedish families: a population-based study. The Lancet. 2009;373(9659):234–239. [DOI] [PMC free article] [PubMed] [Google Scholar]
- 3.Vieta E, Berk M, Schulze TG, et al. Bipolar disorders. Nature Reviews Disease Primers. 2018;4(1):1–16. [DOI] [PubMed] [Google Scholar]
- 4.Lima IM, Peckham AD, Johnson SL. Cognitive deficits in bipolar disorders: Implications for emotion. Clinical psychology review. 2018;59:126–136. [DOI] [PMC free article] [PubMed] [Google Scholar]
- 5.Chen M, Fitzgerald HM, Madera JJ, Tohen M. Functional outcome assessment in bipolar disorder: A systematic literature review. Bipolar disorders. 2019;21(3):194–214. [DOI] [PMC free article] [PubMed] [Google Scholar]
- 6.Fries GR, Walss-Bass C, Bauer ME, Teixeira AL. Revisiting inflammation in bipolar disorder. Pharmacology Biochemistry and Behavior. 2019;177:12–19. [DOI] [PubMed] [Google Scholar]
- 7.Rosenblat JD, Gregory JM, Flor-Henry S, McIntyre RS. Inflammation in Bipolar Disorder. Inflammation and Immunity in Depression: Elsevier; 2018:445–454. [Google Scholar]
- 8.Giridharan VV, Sayana P, Pinjari OF, et al. Postmortem evidence of brain inflammatory markers in bipolar disorder: a systematic review. Molecular psychiatry. 2019:1–20. [DOI] [PubMed] [Google Scholar]
- 9.Muneer A Bipolar disorder: role of inflammation and the development of disease biomarkers. Psychiatry investigation. 2016;13(1):18. [DOI] [PMC free article] [PubMed] [Google Scholar]
- 10.Munkholm K, Vinberg M, Kessing LV. Cytokines in bipolar disorder: a systematic review and meta-analysis. Journal of affective disorders. 2013;144(1–2):16–27. [DOI] [PubMed] [Google Scholar]
- 11.Hatch JK, Scola G, Olowoyeye O, et al. Inflammatory Markers and Brain-Derived Neurotrophic Factor as Potential Bridges Linking Bipolar Disorder and Cardiovascular Risk Among Adolescents. The Journal of clinical psychiatry. 2017;78(3):e286–e293. [DOI] [PubMed] [Google Scholar]
- 12.Barbosa IG, Vaz GN, Rocha NP, et al. Plasma levels of tumor necrosis factor superfamily molecules are increased in bipolar disorder. Clinical Psychopharmacology and Neuroscience. 2017;15(3):269. [DOI] [PMC free article] [PubMed] [Google Scholar]
- 13.Barbosa IG, de Almeida Ferreira R, Rocha NP, et al. Predictors of cognitive performance in bipolar disorder: the role of educational degree and inflammatory markers. Journal of psychiatric research. 2018;106:31–37. [DOI] [PubMed] [Google Scholar]
- 14.van den Ameele S, Coppens V, Schuermans J, et al. Neurotrophic and inflammatory markers in bipolar disorder: A prospective study. Psychoneuroendocrinology. 2017;84:143–150. [DOI] [PubMed] [Google Scholar]
- 15.Kunz M, Ceresér KM, Goi PD, et al. Serum levels of IL-6, IL-10 and TNF-α in patients with bipolar disorder and schizophrenia: differences in pro-and anti-inflammatory balance. Brazilian Journal of Psychiatry. 2011;33(3):268–274. [DOI] [PubMed] [Google Scholar]
- 16.Du M-Y, Wu Q-Z, Yue Q, et al. Voxelwise meta-analysis of gray matter reduction in major depressive disorder. Progress in Neuro-Psychopharmacology and Biological Psychiatry. 2012;36(1):11–16. [DOI] [PubMed] [Google Scholar]
- 17.Ganzola R, Duchesne S. Voxel-based morphometry meta-analysis of gray and white matter finds significant areas of differences in bipolar patients from healthy controls. Bipolar disorders. 2017;19(2):74–83. [DOI] [PubMed] [Google Scholar]
- 18.Hibar D, Westlye LT, Doan NT, et al. Cortical abnormalities in bipolar disorder: an MRI analysis of 6503 individuals from the ENIGMA Bipolar Disorder Working Group. Molecular psychiatry. 2018;23(4):932–942. [DOI] [PMC free article] [PubMed] [Google Scholar]
- 19.Chen M-H, Chang W-C, Hsu J-W, et al. Correlation of proinflammatory cytokines levels and reduced gray matter volumes between patients with bipolar disorder and unipolar depression. Journal of affective disorders. 2019;245:8–15. [DOI] [PubMed] [Google Scholar]
- 20.Selvaraj S, Arnone D, Job D, et al. Grey matter differences in bipolar disorder: a meta‐analysis of voxel-based morphometry studies. Bipolar disorders. 2012;14(2):135–145. [DOI] [PubMed] [Google Scholar]
- 21.Bora E, Fornito A, Yücel M, Pantelis C. Voxelwise meta-analysis of gray matter abnormalities in bipolar disorder. Biological psychiatry. 2010;67(11):1097–1105. [DOI] [PubMed] [Google Scholar]
- 22.Wise T, Radua J, Via E, et al. Common and distinct patterns of grey-matter volume alteration in major depression and bipolar disorder: evidence from voxel-based meta-analysis. Molecular psychiatry. 2017;22(10):1455–1463. [DOI] [PMC free article] [PubMed] [Google Scholar]
- 23.Sarıçiçek A, Yalın N, Hıdıroğlu C, et al. Neuroanatomical correlates of genetic risk for bipolar disorder: a voxel-based morphometry study in bipolar type I patients and healthy first degree relatives. Journal of affective disorders. 2015;186:110–118. [DOI] [PubMed] [Google Scholar]
- 24.Mathew I, Gardin TM, Tandon N, et al. Medial temporal lobe structures and hippocampal subfields in psychotic disorders: findings from the Bipolar-Schizophrenia Network on Intermediate Phenotypes (B-SNIP) study. JAMA psychiatry. 2014;71(7):769–777. [DOI] [PubMed] [Google Scholar]
- 25.Shi J, Guo H, Fan F, et al. Sex differences of hippocampal structure in bipolar disorder. Psychiatry Research: Neuroimaging. 2018;273:35–41. [DOI] [PubMed] [Google Scholar]
- 26.Hibar D, Westlye LT, van Erp TG, et al. Subcortical volumetric abnormalities in bipolar disorder. Molecular psychiatry. 2016;21(12):1710–1716. [DOI] [PMC free article] [PubMed] [Google Scholar]
- 27.Warren KN, Beason-Held LL, Carlson O, et al. Elevated markers of inflammation are associated with longitudinal changes in brain function in older adults. The Journals of Gerontology: Series A. 2018;73(6):770–778. [DOI] [PMC free article] [PubMed] [Google Scholar]
- 28.Benedetti F, Aggio V, Pratesi ML, Greco G, Furlan R. Neuroinflammation in Bipolar Depression. Frontiers in Psychiatry. 2020;11:71. [DOI] [PMC free article] [PubMed] [Google Scholar]
- 29.First MB. Structured clinical interview for the DSM (SCID). The encyclopedia of clinical psychology. 2014:1–6. [Google Scholar]
- 30.Carson N, Leach L, Murphy KJ. A re-examination of Montreal Cognitive Assessment (MoCA) cutoff scores. International Journal of Geriatric Psychiatry. 2018;33(2):379–388. [DOI] [PubMed] [Google Scholar]
- 31.Dale AM, Fischl B, Sereno MI. Cortical surface-based analysis: I. Segmentation and surface reconstruction. Neuroimage. 1999;9(2):179–194. [DOI] [PubMed] [Google Scholar]
- 32.Fischl B, Salat DH, Busa E, et al. Whole brain segmentation: automated labeling of neuroanatomical structures in the human brain. Neuron. 2002;33(3):341–355. [DOI] [PubMed] [Google Scholar]
- 33.Jovicich J, Czanner S, Greve D, et al. Reliability in multi-site structural MRI studies: effects of gradient non-linearity correction on phantom and human data. Neuroimage. 2006;30(2):436–443. [DOI] [PubMed] [Google Scholar]
- 34.Fischl B, Van Der Kouwe A, Destrieux C, et al. Automatically parcellating the human cerebral cortex. Cerebral cortex. 2004;14(1):11–22. [DOI] [PubMed] [Google Scholar]
- 35.StataCorp L. Stata statistical software: Release 13. 2013. [Google Scholar]
- 36.Spss I IBM SPSS statistics for Windows, version 20.0. New York: IBM Corp. 2011;440. [Google Scholar]
- 37.Goldsmith D, Rapaport M, Miller BJ. A meta-analysis of blood cytokine network alterations in psychiatric patients: comparisons between schizophrenia, bipolar disorder and depression. Molecular psychiatry. 2016;21(12):1696–1709. [DOI] [PMC free article] [PubMed] [Google Scholar]
- 38.Mechawar N, Savitz J. Neuropathology of mood disorders: do we see the stigmata of inflammation? Translational psychiatry. 2016;6(11):e946–e946. [DOI] [PMC free article] [PubMed] [Google Scholar]
- 39.Miller AH, Raison CL. The role of inflammation in depression: from evolutionary imperative to modern treatment target. Nature reviews immunology. 2016;16(1):22. [DOI] [PMC free article] [PubMed] [Google Scholar]
- 40.Brietzke E, Stertz L, Fernandes BS, et al. Comparison of cytokine levels in depressed, manic and euthymic patients with bipolar disorder. Journal of affective disorders. 2009;116(3):214–217. [DOI] [PubMed] [Google Scholar]
- 41.Munkholm K, Braüner JV, Kessing LV, Vinberg M. Cytokines in bipolar disorder vs. healthy control subjects: a systematic review and meta-analysis. Journal of psychiatric research. 2013;47(9):1119–1133. [DOI] [PubMed] [Google Scholar]
- 42.Hayes J, Khandaker G, Anderson J, et al. Childhood interleukin-6, C-reactive protein and atopic disorders as risk factors for hypomanic symptoms in young adulthood: a longitudinal birth cohort study. Psychological Medicine. 2017;47(1):23–33. [DOI] [PMC free article] [PubMed] [Google Scholar]
- 43.Sanches M, Soares JC. Brain imaging abnormalities in bipolar disorder. In: Young AH, Soares JC, eds. Bipolar Disorders: Basic Mechanisms and Therapeutic Implications. 3 ed. Cambridge: Cambridge University Press; 2016:102–110. [Google Scholar]
- 44.Teixeira AL, Colpo GD, Fries GR, Bauer IE, Selvaraj S. Biomarkers for bipolar disorder: current status and challenges ahead. Expert review of neurotherapeutics. 2019;19(1):67–81. [DOI] [PubMed] [Google Scholar]
- 45.Bai Y-M, Chen M-H, Hsu J-W, et al. A comparison study of metabolic profiles, immunity, and brain gray matter volumes between patients with bipolar disorder and depressive disorder. Journal of Neuroinflammation. 2020;17(1):42. [DOI] [PMC free article] [PubMed] [Google Scholar]
- 46.Kauer-Sant’Anna M, Kapczinski F, Andreazza AC, et al. Brain-derived neurotrophic factor and inflammatory markers in patients with early-vs. late-stage bipolar disorder. International Journal of Neuropsychopharmacology. 2009;12(4):447–458. [DOI] [PubMed] [Google Scholar]
- 47.Brunoni AR, Supasitthumrong T, Teixeira AL, et al. Differences in the immune-inflammatory profiles of unipolar and bipolar depression. Journal of affective disorders. 2020;262:8–15. [DOI] [PubMed] [Google Scholar]
- 48.Leech R, Braga R, Sharp DJ. Echoes of the brain within the posterior cingulate cortex. Journal of Neuroscience. 2012;32(1):215–222. [DOI] [PMC free article] [PubMed] [Google Scholar]
- 49.Buckner RL, Andrews-Hanna JR, Schacter DL. The brain’s default network: anatomy, function, and relevance to disease. 2008. [DOI] [PubMed] [Google Scholar]
- 50.Leech R, Sharp DJ. The role of the posterior cingulate cortex in cognition and disease. Brain. 2014;137(1):12–32. [DOI] [PMC free article] [PubMed] [Google Scholar]
- 51.Castaño-Ramírez OM, Sepúlveda-Arias JC, Duica K, Zuluaga AMD, Vargas C, López-Jaramillo C. Inflammatory markers in the staging of bipolar disorder: a systematic review of the literature. Revista Colombiana de Psiquiatría (English ed.). 2018;47(2):119–128. [DOI] [PubMed] [Google Scholar]
- 52.Altinay M, Karne H, Anand A. Lithium monotherapy associated clinical improvement effects on amygdala-ventromedial prefrontal cortex resting state connectivity in bipolar disorder. Journal of affective disorders. 2018;225:4–12. [DOI] [PMC free article] [PubMed] [Google Scholar]
- 53.Nassar A, Azab AN. Effects of lithium on inflammation. ACS chemical neuroscience. 2014;5(6):451–458. [DOI] [PMC free article] [PubMed] [Google Scholar]
- 54.Köhler C, Freitas T, Maes Md, et al. Peripheral cytokine and chemokine alterations in depression: a meta-analysis of 82 studies. Acta Psychiatrica Scandinavica. 2017;135(5):373–387. [DOI] [PubMed] [Google Scholar]
- 55.McDonald C Brain structural effects of psychopharmacological treatment in bipolar disorder. Current neuropharmacology. 2015;13(4):445–457. [DOI] [PMC free article] [PubMed] [Google Scholar]
- 56.Fountoulakis KN, Giannakopoulos P, Kövari E, Bouras C Assessing the role of cingulate cortex in bipolar disorder: neuropathological, structural and functional imaging data. Brain research reviews. 2008;59(1):9–21. [DOI] [PubMed] [Google Scholar]