

Summary
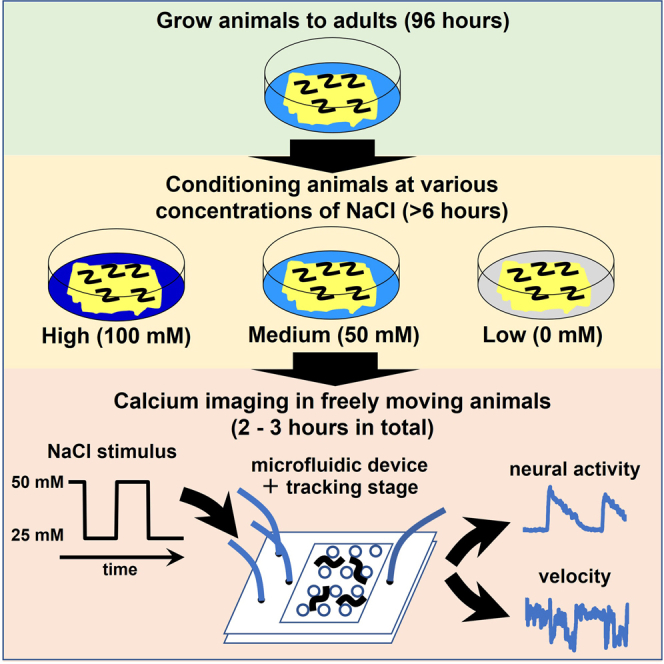
To reveal the neural mechanisms that control animal behavior, it is necessary to link the neural responses to behavioral changes and interpret them. We have developed a protocol to simultaneously record the behavior and neural activity of freely moving C. elegans by combining a microfluidic device and a tracking stage. Here we detail the protocol for the experiment, with an example of behavioral and neural responses of nematodes to salt concentration changes.
For complete details on the use and execution of this protocol, please refer to Sato et al. (2021).
Subject areas: Microscopy, Model Organisms, Neuroscience, Behavior
Graphical abstract
Highlights
-
•
Simultaneous recording of neural responses and behavior of freely moving C. elegans
-
•
A format for efficiently analyzing behavior and neural activity in salt chemotaxis
-
•
Using microfluidic devices to manipulate the magnitude and timing of stimulation
-
•
Applicable to behavioral analysis for various stimuli
To reveal the neural mechanisms that control animal behavior, it is necessary to link the neural responses to behavioral changes and interpret them. We have developed a protocol to simultaneously record the behavior and neural activity of freely moving C. elegans by combining a microfluidic device and a tracking stage. Here we detail the protocol for the experiment, with an example of behavioral and neural responses of nematodes to salt concentration changes.
Before you begin
In this experiment, C. elegans adults are to be used. For cultivating animals, we use the standard method, using Nematode Growth Medium (NGM) agar plates and E. coli OP50 strain (Brenner, 1974). It is known that C. elegans is attracted to a salt concentration at which the animal experiences food (or the animals were "conditioned" at the salt concentration; (Kunitomo et al., 2013; Sato et al., 2021). Animals conditioned with high salt concentrations show migration toward high salt concentrations, while those conditioned with low salt concentrations show migration toward low salt concentrations. We describe experiments aimed at observing the behavior and neural activity of nematodes depending on the conditioned salt concentration. Therefore, the nematodes are conditioned at various salt concentrations before the assay is performed. To condition the nematodes, it is necessary to prepare NGM plates with various salt concentrations. Therefore, in this section, we describe how to prepare the plates and reagents necessary for the experiment.
NGM condition plates preparation
Timing: 2 days
The animals used in the experiment should be conditioned the day before the observation. Standard NGM plates contain 50 mM NaCl. Therefore, here we prepare NGM plates containing 0 mM, 50 mM, and 100 mM NaCl. These NGM plates are osmotically adjusted by glycerol as in previous studies (Kunitomo et al., 2013).
-
1.
Put 2.5 g HIPOLYPEPTONE (or polypeptone from any supplier) and 17 g agar in a 2 L glass bottle and add 5.84 g (100 mM) or 2.92 g (50 mM) or 0 g (0 mM) NaCl.
-
2.
Add 4.02 mL (5.07 g), 7.68 mL (16.81 g) or 11.33 mL (28.55 g) of glycerol for 100 mM, 50 mM, or 0 mM NaCl plates, respectively, to adjust the osmolarity.
-
3.
Add 1 mL cholesterol solution (5 mg/mL diluted in ethanol) and then fill the bottle up to 1000 mL with milli-Q water.
-
4.
Sterilize by autoclaving for 20 min at 121°C. Also sterilize the KPO4 buffer (1 M stock solution, pH 6.0, see tables in materials and equipment), MgSO4 (1 M stock solution) and CaCl2 (1 M stock solution).
-
5.
After the autoclaved bottle cools to below 60°C, add 25 mL KPO4 buffer, 1 mL MgSO4 solution, and 1 mL CaCl2 solution.
-
6.
Dispense 10 mL of the NGM into each 60 mm Petri dish.
-
7.
Place the NGM at room temperature (20°C–25°C) overnight to solidify.
CRITICAL: The NGM plates should not be dried because it will change the salt concentration it contains. It is recommended to store the plates in airtight containers (4°C, up to 1 month).
0 mM NGM
| Reagent | Final concentration | Amount |
|---|---|---|
| Polypeptone | 2.5 mg/mL | 2.5 g |
| Agar | 17 mg/mL | 17 g |
| 5 mg/mL Cholesterol solution | 5 mg/L | 1 mL |
| 1 M MgSO4 solution | 1 mM | 1 mL |
| 1 M CaCl2 solution | 1 mM | 1 mL |
| 1 M KPO4 buffer | 25 mM | 25 mL |
| Glycerol | 310 mM | 22.66 mL |
| Milli Q water | N/A | Fill up to 1000 mL |
50 mM NGM
| Reagent | Final concentration | Amount |
|---|---|---|
| NaCl | 50 mM | 2.92 g |
| Polypeptone | 2.5 mg/mL | 2.5 g |
| Agar | 17 mg/mL | 17 g |
| 5 mg/mL Cholesterol solution | 5 mg/L | 1 mL |
| 1 M MgSO4 solution | 1 mM | 1 mL |
| 1 M CaCl2 solution | 1 mM | 1 mL |
| 1 M KPO4 buffer | 25 mM | 25 mL |
| Glycerol | 210 mM | 15.35 mL |
| Milli Q water | N/A | Fill up to 1000 mL |
100 mM NGM
| Reagent | Final concentration | Amount |
|---|---|---|
| NaCl | 100 mM | 5.84 g |
| Polypeptone | 2.5 mg/mL | 2.5 g |
| Agar | 17 mg/mL | 17 g |
| 5 mg/mL Cholesterol solution | 5 mg/L | 1 mL |
| 1 M MgSO4 solution | 1 mM | 1 mL |
| 1 M CaCl2 solution | 1 mM | 1 mL |
| 1 M KPO4 buffer | 25 mM | 25 mL |
| Glycerol | 110 mM | 8.04 mL |
| Milli Q water | N/A | Fill up to 1000 mL |
Bacterial food source
NGM conditioning plates are seeded with E. coli OP50 as a food source.
-
8.
Grow E. coli OP50 as single colonies on LB agar plates at 37C for 16 h.
-
9.
Pick a single colony of E. coli OP50 and culture it in LB medium without NaCl (see table in materials and equipment) at 37C for 16 h.
-
10.
Apply 50 μL of E. coli OP50 culture medium to each NGM plate in a 60 mm Petri dish, and spread the bacteria using a glass spreader. Then culture the bacteria at 37C for 16 h.
Preparation of NaCl solutions at various concentrations
In this experiment, NaCl solutions containing different concentrations of NaCl are used, and switching between them stimulates the animals. We usually mix a 0 mM NaCl solution with a 100 mM NaCl solution to make a solution with the required NaCl concentration. The osmolarity of these NaCl solutions is adjusted to about 350 mOSM by glycerol, as in previous studies (Kunitomo et al., 2013; Suzuki et al., 2008). As an example, since the osmolarity of a 100 mM NaCl solution is higher than that of a 0 mM NaCl solution due to the higher amount of 100 mM salt (= 200 mOSM), the osmolarity is adjusted by adding 200 mM more glycerol to the 0 mM NaCl solution.
-
11.
Add 2.92 g (100 mM) or 0 g (0 mM) NaCl. Then add 0.1 g gelatin to prevent nematodes from sticking to the PDMS device and pipette tips.
-
12.
Add 2.54 g (100 mM NaCl) or 14.28 g (0 mM NaCl) of glycerol to adjust the osmolarity and fill up the bottle to 500 mL with miliRO water.
-
13.
Sterilize by autoclaving for 20 min at 121°C. Also sterilize the KPO4 buffer (1 M stock solution, pH 6.0, see tables in materials and equipment) and MgSO4 (1 M stock solution) and CaCl2 (1 M stock solution)
-
14.
After the autoclaved bottle cools to below 60°C, add 12.5 mL KPO4 buffer, 0.5 mL MgSO4 solution, and 0.5 mL CaCl2 solution.
0 mM NaCl solutions
| Reagent | Final concentration | Amount |
|---|---|---|
| 1 M MgSO4 solution | 1 mM | 1 mL |
| 1 M CaCl2 solution | 1 mM | 1 mL |
| 1 M KPO4 buffer | 25 mM | 25 mL |
| Gelatin | 0.2 mg/mL | 0.2 g |
| Glycerol | 310 mM | 22.66 mL |
| Milli Q water | N/A | Fill up to 1000 mL |
100 mM NaCl solutions
| Reagent | Final concentration | Amount |
|---|---|---|
| NaCl | 100 mM | 5.84 g |
| 1 M MgSO4 solution | 1 mM | 1 mL |
| 1 M CaCl2 solution | 1 mM | 1 mL |
| 1 M KPO4 buffer | 25 mM | 25 mL |
| Gelatin | 0.2 mg/mL | 0.2 g |
| Glycerol | 110 mM | 8.04 mL |
| Milli Q water | N/A | Fill up to 1000 mL |
These solutions can be stored at 4°C for up to 1 month.
Preparation of nematodes
-
15.
Place four adult hermaphrodite nematodes on an NGM plate (60 mm petri dish) with food (E. coli).
-
16.
Incubate the nematodes at 20°C for 4 days.
Key resources table
| REAGENT or RESOURCE | SOURCE | IDENTIFIER |
|---|---|---|
| Bacterial and virus strains | ||
| Escherichia coli, OP50 | Caenorhabditis Genetics Center | OP50 |
| Chemicals, peptides, and recombinant proteins | ||
| Sodium Chloride | MANAC | 9317 |
| Hipolypeptone (or any polypeptone) | WAKO | 392-02115 |
| Agar | TAISHO TECHNOS | 17071902 |
| Magnesium sulfate (MgSO4) heptahydrate | Sigma-Aldrich | 19-0480-5 |
| Calcium chloride (CaCl2) | WAKO | 033-25035 |
| Cholesterol | WAKO | 034-03002 |
| Ethanol | Sigma-Aldrich | 64-17-5 |
| Monopotassium phosphate (KH2PO4) | Sigma-Aldrich | 24-5260-5 |
| Dipotassium phosphate (K2HPO4) | Sigma-Aldrich | 24-5240-5 |
| Glycerol | Sigma-Aldrich | 12-1120-5 |
| LB Broth | Sigma-Aldrich | L3522-250G |
| M9 buffer | N/A | N/A |
| Fluorescein | Sigma-Aldrich | 46955-1G-F |
| Gelatin | Nacalai Tesque | 16631-05 |
| Experimental models: Organisms/strains | ||
| C. elegans wild-type N2 | Caenorhabditis Genetics Center | N2 (Bristol) |
| C. elegans N2; Ex[gcy-5p::gcamp6s; gcy-5p::mCherry; lin-44p::gfp] | Sato et al. (2021) | JN3500 |
| C. elegans N2; Ex[npr-9p::gcamp6s; npr-9p::mCherry; lin-44p::gfp] | Sato et al. (2021) | JN3329 |
| Software and algorithms | ||
| MetaMorph | Molecular Devices | MetaMorph Version7.7.4.0 |
| Worm tracking software | Dr. Koichi Hashimoto/HAWKVISION | N/A |
| ImageJ | National Institutes of Health (NIH) | Java 1.8.0_172 |
| Deposited data | ||
| The code for image analysis | Sato et al. (2021) | Mendeley Data: https://doi.org/10.17632/xcxngcy982.1 |
| Other | ||
| Petri plates | IWAKI | 1010-060 |
| Terumo syringe, 50 mL | TERUMO | SS-50ESZ |
| Terumo syringe, 10 mL | TERUMO | SS-10SZ |
| Three-way stopcock | TERUMO | TS-TL2K |
| Polyethylene tube, inner diameter φ 0.58 mm | Imamura | 01630-05 |
| Stainless steel tube (cut 23G stainless steel tube into 1cm lengths) | N/A | N/A |
| Syringe pump | kd Scientific | 78-8110 |
| Peristaltic pump | ATTO corporation | SJ-1211 |
| Optical microscope | OLYMPUS | BX51 |
| Tracking stage (with control software) | HAWKVISION | HV-SAU02 |
| EM-CCD Camera | HAMAMATSU | C9743-13 or successor model |
| Digital camera for infrared light imaging. | Point Grey | GRAS-03K2M-C |
| Glass chip 34 × 45 × 1.1 | TOSHIN RIKO | N/A (Custom made, details to follow) |
| PDMS microfluidic chip (modified from Albrecht and Bargmann, 2011) | YODAKA | U944 (Custom made, details to follow) |
Materials and equipment
1 M KPO4 buffer
| Reagent | Final concentration | Amount |
|---|---|---|
| KH2PO4 | 0.87 M | 118.14 g |
| K2HPO4 | 0.13 M | 22.96 g |
| Milli Q water | N/A | Fill up to 1000 mL |
1 M MgSO4 stock solution
| Reagent | Final concentration | Amount |
|---|---|---|
| MgSO4·7H2O | 1 M | 246.47 g |
| Milli Q water | N/A | Fill up to 1000 mL |
1 M CaCl2 stock solution
| Reagent | Final concentration | Amount |
|---|---|---|
| CaCl2 | 1 M | 147.01 g |
| Milli Q water | N/A | Fill up to 1000 mL |
PDMS microfluidic device
The microfluidic device is made of polydimethylsiloxane (PDMS) and is a modified version of the one developed at previous studies (Albrecht and Bargmann, 2011; Figures 1A and 1B). The overall size is 40 mm × 25 mm, with a microfluidic chamber of 20 mm square. The microfluidic chamber is lined with pillars of 0.2 mm in diameter, and the distance between the pillars is 0.1 mm. There are also four holes with a diameter of 0.5 mm, each of which is connected to the microfluidic chamber.
Figure 1.

Components of microfluidic device
(A) Picture of PDMS microfluidic chip.
(B) Structural diagram of PDMS microfluidic chip. It consists of four holes for inserting tubes and a microfluidic chamber of 20 mm square. Inside the microfluidic chamber, pillars with 0.2 mm diameter are placed at 0.1 mm intervals. The comb-shaped parts in the enlarged image have been modified from the original version (Albrecht and Bargmann, 2011).
(C) Picture of two glass plates. One of the two plates has four holes in it.
(D) Schematic of a glass plate with holes. There are four holes with 1 mm diameter. The positions of the four holes are arranged so that they overlap with the holes in the PDMS microfluidic chip.
Glass plates
The glass plates are common microscope slides, and the size is 45 mm × 34 mm, and are used in a set of two (Figure 1C). One of the two plates has four holes (1 mm in diameter), the position of which overlaps with the holes in the PDMS microfluidic device (Figures 1B and 1D). The material of the glass plates is the same as that of common glass slides for microscopes.
Step-by-step method details
C. elegans is known to exhibit behavioral changes and neural responses to a variety of stimuli (Bargmann et al., 1993; Gray et al., 2004; Hilliard et al., 2005; Mori and Ohshima, 1995; Ward et al., 2008). This tracking imaging system using a PDMS microfluidic device allows us to simultaneously observe animal behavior and neural responses to stimuli. This protocol targets the experience-dependent salt chemotaxis of C. elegans. It can also be applied to other stimuli (e.g., water-soluble chemicals, odors, osmotic stimuli, etc.) if they can be channeled through the microfluidic system (Albrecht and Bargmann, 2011). The protocol is divided into four stages: 1: conditioning, 2: assembly of the microfluidic device and introduction of the nematodes, 3: administration of the stimuli and recording of movement and neural responses, and 4: quantification of behavior and neural responses.
Conditioning of animals
This assay aims to measure the behavior and neural activity of nematodes in response to salt concentration change stimuli, and to investigate whether these responses are altered by the salt concentration that the nematodes have previously experienced. Therefore, initially, the nematodes are conditioned with various salt concentrations.
-
1.
Wash nematodes from one 6 cm plate (make sure that there is still food left, and the nematodes are not starving, and more than 200 adult nematodes are present) into a 1.5 mL Eppendorf tube using 1 mL of M9 buffer.
-
2.
After the nematodes have settled to the bottom of the tube, remove the supernatant, and wash again with 1 mL of M9 buffer.
-
3.
After the nematodes settle to the bottom of the tube, remove the supernatant, and transfer the nematodes to an NGM condition plate (0, 50, or 100 mM NaCl) with a lawn of E. coli.
-
4.
Incubate at 20°C overnight (at least 6 h or more) for conditioning.
Alternatives: If you are using strains with extrachromosomal arrays which are not 100% heritable for your experiment, you can pick up about 100 nematodes carrying the arrays and transfer them to an NGM condition plate.
Assembly of the microfluidic device
In this experiment, nematodes were placed in a PDMS microfluidic chamber and stimulated by switching the solution flowing in the chamber. A chip made of PDMS is sandwiched between two glass plates, and the stimulating solution flows through holes in the glass plates and the chip (Figure 2).
-
5.
Wash a glass plate, a perforated glass plate, and a PDMS microfluidic chip with 100% ethanol and air-dry them.
-
6.
Place the PDMS chip between the glass plates (Figure 2B left). Align the holes in the perforated glass plate with the holes for inserting the polyethylene tube (φ 0.58 mm) in the PDMS chip. Then insert the stainless steel tubes into the four holes of the chip.
-
7.
Fix the glass plate with a binder clip (Figure 2B right top).
-
8.
Vacuum pump for 15 min to evaporate.
-
9.
Mix 0 mM NaCl solution and 100 mM NaCl solution to make 50 mL of 50 mM NaCl solution and 25 mM NaCl solution.
-
10.
Add 0.5 μL of 0.5 μM fluorescein solution to 25 mM NaCl solution (final concentration: 1 nM).
-
11.Put 40 mL each of 50 mM NaCl buffer and 25 mM NaCl buffer into respective 50 mL Terumo syringe set it on the feed pump, and connect polyethylene tube to the syringes (Figure 3A, NaCl solution 1 and 2).
-
a.Put 10 mL of 50 mM NaCl buffer into a 10 mL syringe and connect the tube (Figure 3A, nematode introduction syringe). This syringe is used for nematode introduction to the microfluidic chamber. Flow path from the nematode introduction syringe is opened and closed using a three-way stopcock.
-
b.Connect a syringe with the NaCl solution to one side of the flow path and a polyethylene tube to the other side that will be later connected to PDMS. Attach another syringe to the third flow path and use it to remove air from the tube.
-
a.
-
12.Connect the polyethylene tubes from each syringe and pump (①–④) to the steel tubes of the PDMS microfluidic device, and turn on all pumps and open all tubes to allow the solution to flow (Figures 2B and 3A).
- a.
-
b.When the chamber is filled with NaCl solution, close all the tubes. The flow rate of each pump should be set to 100 μL/min.
Figure 2.

Schematic diagram of how to assemble a microfluidic device
(A) Summary of each tube connecting to the microfluidic chip.
(B) Pictures from each stage of assembly. First, sandwich the microfluidic chip between two glass plates. At this time, the holes in the microfluidic chip and the holes in the glass plate are placed so that they overlap. Next, insert steel pins into each hole and hold the glass plates in place with binder clips. Then, connect polyethylene tubes to each pin.
Figure 3.

Overview diagram of the experimental setup
(A) Overview of the microfluidic device and each polyethylene tube connected to it. There are two syringes for NaCl solution (① and ②, 1 m length each), one syringe for nematodes introduction (③, 0.5 m length), and one peristaltic pump for waste fluid connected (④, 0.5 m length).
(B) Schematic diagram of the imaging system. An infrared camera is used to acquire bright field images and an EM-CCD camera is used to acquire fluorescence images. The bright field images are used to control the tracking stage so that the nematode is kept in the center of the field of view.
Introduction of nematodes into the microfluidic chamber
-
13.
Put 1 mL of 50 mM NaCl solution in a 1.5 mL Eppendorf tube and put 10–20 nematodes picked from the conditioning plate.
-
14.
Take nematodes with a P1000 micropipette and put it into the NaCl solution in a nematodes-introduction syringe (10 mL Terumo syringe) (Figure 3A ③).
-
15.
Open the tube from the nematode-introduction syringe (Figure 3A ③), turn on the peristaltic pump for waste fluid (Figure 3A ④), and introduce nematodes into the microfluidic chamber. After the nematode enters the chamber, close the tube from the nematode-introduction syringe and turn off the waste pump.
Stimulation of animals and measurement of behaviors and neural activities
An infrared camera and an EM-CCD camera are used to acquire bright field images and fluorescence images, respectively (Figure 3B). Based on the bright field images, the tracking stage is controlled according to the animal's movement, and the behavior and neural activity of the moving animal are acquired.
-
16.
Turn on the peristaltic pump for waste and open the tube of 50 mM NaCl solution.
-
17.
Launch the tracking stage, the nematode tracking software, and the fluorescence imaging software (MetaMorph). Then, select the head of the nematode and start tracking. At the same time, start capturing brightfield and fluorescence images.
Note: The nematode tracking software uses the pattern around the selected point as a template, and tracks the animal based on it. Therefore, if the template is set to include the pharynx and part of the intestine, which have a characteristic shape, the tracking will be successful (Methods video S1). In addition, it is better to select a worm that is not moving too fast or too slow (about 50–100 μm/s) to obtain good quality data.
-
18.
25 s after the start of imaging, close the tube of 50 mM NaCl solution and simultaneously open the tube of 25 mM NaCl solution.
-
19.75 s after the start of imaging, close the tube of 25 mM NaCl solution and open the tube of 50 mM NaCl solution at the same time.
-
a.At 125 s after the start of shooting, close the tube of 50 mM NaCl solution again and open the tube of 25 mM NaCl solution at the same time.
-
b.At 180 s after the start of imaging, end the measurement, close the tube of 25 mM NaCl solution and open the tube of 50 mM NaCl solution.
-
a.
Note: In this experiment, the nematodes are stimulated to change salt concentration from
Bright field image on the left and fluorescence image on the right. In the bright field image, the area surrounded by white squares (the pharynx and part of the intestine of the nematode) is used as a template for tracking. Since fluorescein is added to the 25 mM NaCl solution, it is possible to identify the timing of solution switching in the GCaMP channel.
50 mM → 25 mM → 50 mM → 25 mM (Figure 4A). The nematode's forward/backward state lasts for about several seconds to several tens of seconds. Therefore, in this experiment, the stimulus switching interval was set to 50 s. Since nematodes are attracted to the NaCl concentration at conditioning, changes away from and toward the NaCl concentration at conditioning are applied as stimuli. For example, for a nematode conditioned to 50 mM NaCl concentration, a change in NaCl concentration from 50 mM to 25 mM is a change away from the conditioned concentration, and a change from 25 mM to 50 mM is a change toward the conditioned concentration.
-
20.
Select another nematode in the chamber and measure again by steps 17–19. Up to about 5 animals should be measured in one experiment.
Note: In this experiment, no significant differences in neural responses or behavioral changes due to repeated stimulus exposure were detected (Figure 4B). If different stimuli or experimental conditions are to be used, it is necessary to estimate whether there is an effect of repeated stimulation. To avoid the effects of repeated stimulation, return to step 5 after measuring the first animal.
-
21.
After the experiment, dismantle the microfluidic device and clean it with ethanol. To continue the imaging again, start from step 5.
Figure 4.

The salt stimuli used in the experiment and the responses to them
(A) Time course for switching salt solutions during the experiment. Since it takes about 30 s from the entrance to the exit of the microfluidic chamber, the actual timing at which the stimulus is delivered to nematodes depends on their position in the microfluidic chamber.
(B) Comparison of the magnitude of the velocity change and neural response of ASER to salt concentration down-step (50 mM–25 mM) and up-step (25 mM–50 mM) between the first animal and the second and following animals. These animals were conditioned with 100 mM NaCl. Each graph represents the differences between mean value of 10 s windows before and after stimulus. Each dot represents the data of one animal. Mean ± S. E. M. (NS) not significant, Welch’s test.
Expected outcomes
Data on velocity and neural activity are collected for a single recording (Figures 5 and 6). The velocity of the nematode is expected to vary depending on whether the stimulus received is attractive or aversive. For example, nematodes conditioned with 100 mM NaCl showed backward movement in response to salt concentration decrease (Figure 5). In contrast, nematodes conditioned with 0 mM NaCl showed backward movement in response to salt concentration increase (Figure 6). In addition, each neuron is thought to exhibit its own characteristic activity pattern.
Figure 5.

Velocity and ASER activity in response to salt concentration changes
The data are from one animal, and this animal was conditioned with 100 mM NaCl. The animal is exposed to 50 mM NaCl solution in the white part of the graph and 25 mM in the gray part. The upper panel is a graph of velocity change, where negative values indicate backward movement. The lower panel shows the change in intracellular calcium concentration in the ASER neuron. This animal showed backward movement when the salt concentration decreased, and ASER was also activated for the decrease in salt concentration.
Figure 6.

Velocity and AIB activity in response to salt concentration changes
The data are from one animal, and this animal was conditioned with 0 mM NaCl. The animal is exposed to 50 mM NaCl solution in the white part of the graph and 25 mM in the gray part. The upper panel is a graph of velocity change, where negative values indicate backward movement. The lower panel shows the change in intracellular calcium concentration in the AIB neuron. This animal showed backward movement when the salt concentration increased, and AIB was activated at the same moment as the backward movement.
Quantification and statistical analysis
In order to quantify behavior and neural activity from the acquired images, it is necessary to analyze them ad hoc.
Quantification of the behavior of nematodes
-
1.
To quantify the behavior (movement speed) of nematodes, use bright field images. For each image, calculate the distance and direction of movement by comparing the deviation from the image in the previous frame.
-
2.
Next, divide the distance traveled by the time per frame (30 ms) to obtain the speed of the nematode's movement at that time.
-
3.
Furthermore, detect and compare the direction of the nematode's head in each image with the direction of movement to determine whether the nematode is moving forward or backward.
Note: It is recommended to take a moving average of about 1 s because the velocity data is noisy. The code used for these analyses are available in the following repository: Mendeley Data: https://doi.org/10.17632/xcxngcy982.1.
Quantification of neural activities
To quantify neural activity, we use fluorescent images: after subtracting the background of the image using ImageJ, we quantify the fluorescence of the target area using the Track Objects function of MetaMorph or Analyze particles function of ImageJ. The fluorescence of fluorescein is used to determine the timing of the stimulus (solution exchange) to the nematode.
Limitations
The width of the microchamber is adjusted to the body of an adult nematode (5 days post hatching, raised at 20°C). Therefore, it may be difficult to track the movement of larvae or mutants with thin bodies. If you want imaging of thin-bodied nematodes, you need to design a narrower chamber (Ordinarily, the spacing between pillars in a microfluidic chamber is 100 μm, and this space is to be narrower.).
It is possible to record from nematodes on an agar plate instead of in a microchamber, but in this case it is necessary to be cautious about the shift in the z-plane, because agar plates may not always be flat.
Since there is no food in the microchamber, prolonged imaging may have starvation effects on the nematodes. Therefore, it is not recommended to take images for more than 30 min after introducing nematodes into the microchamber.
Troubleshooting
Problem 1
Air bubbles are formed in the microfluidic chamber during imaging (step 16–20).
Potential solution
This problem may arise at step 16–20. This may be because the speed of the waste pump (Figure 3A ④) is faster than that of the feed pumps (Figure 3A, ① and ②). Therefore, the problem can be solved by reducing the speed of the waste pump or increasing the speed of the feed pumps. However, if the pumping speed is too fast, the movement of the nematode will be affected, so it is recommended to reduce the speed of the liquid waste pump if possible.
Problem 2
Nematodes do not enter the microfluidic chamber (step 15).
Potential solution
This problem may arise at step 15. Push the nematode-introduction syringe slowly with the piston to make it easier for the nematode to enter the microfluidic chamber. Be careful not to push too hard or the liquid will leak from the side of the chamber.
Problem 3
The nematode does not move in the microfluidic chamber/ moves too fast (step 17–19).
Potential solution
This problem may arise at step 17–19. If the strain you are using is not a mutant with abnormal movement, the cause may be that the body width of the nematode is larger/smaller than the microfluidic chamber. If the nematodes do not move in the chamber, it is recommended to use younger nematodes, and if they move too fast, it is recommended to use older nematodes. A standard size is about the same as a wild-type (N2) at 5 days after hatching. If it is necessary to use animals for a certain number of days post hatching, it is recommended to design a thicker or narrower chamber (See also the “limitations” section.).
Problem 4
Solution switching does not occur/is slow (step 17–19).
Potential solution
This problem may arise at step 17–19. First, make sure that the flow path is not clogged. Also, the microfluidic channel has a distance from the entrance of the solution to the outlet for the waste solution. Therefore, if the nematodes are close to the outlet, it will take about 30 s for the solution to reach the nematodes after switching the solution. If it takes much longer, it may be improved by increasing the speed of the pump for feeding the solution.
Problem 5
Solution leaks from the microfluidic chamber (step 12–20).
Potential solution
This problem may arise at step 12–20. This is mainly due to the speed of the feed pumps (Figure 3A, ① and ②) being too much faster than the waste pump (Figure 3A ④). First, make sure that the flow path for the waste fluid is not clogged. Next, the speed of the feed pumps is reduced or the speed of the waste pump is increased, which can be a solution. In addition, using stronger binder clips to fix the microfluidic chip and the glass plates may be a solution.
Resource availability
Lead contact
Further information and requests for resources and reagents should be directed to and will be fulfilled by the lead contact, Yuichi Iino (iino@bs.s.u-tokyo.ac.jp).
Materials availability
All unique/stable reagents generated in this study are available from the lead contact without restriction.
Acknowledgments
We thank the Caenorhabditis Genetics Center and the laboratory of Cornelia I. Bargmann for providing strains and the design of microfluidic devices. We also thank members of the Y.I. laboratory for helpful comments and advice with the experiments. This work was supported by the Core Research for Evolutional Science and Technology program (CREST) “Creation of Fundamental Technologies for Understanding and Control of Biosystem Dynamics,” Grant JPMJCR12W1, of the Japan Science and Technology Agency; Japan Society for the Promotion of Science KAKENHI Grant-in-Aid for Scientific Research (S) Grant JP17H06113; Grants-in-Aid for Innovative Area "Artificial Intelligence and Brain Science" (19H04980) and Japan Society for the Promotion of Science KAKENHI Grant-in-Aid for Early-Career Scientists Grant 19K16286, The salt Science Foundation No. 2043, and Center for Integrative Science of Human Behavior (CiSHuB).
Author contributions
H.S., H.K., and Y.I. designed experiments; H.S. performed experiments; H.K., X.F., and K.H. contributed new reagents/analytic tools; H.S. analyzed data; and H.S., H.K., and Y.I. wrote the paper.
Declaration of interests
The authors declare no competing interests.
Footnotes
Supplemental information can be found online at https://doi.org/10.1016/j.xpro.2021.101011.
Contributor Information
Hirofumi Sato, Email: hisato@bs.s.u-tokyo.ac.jp.
Yuichi Iino, Email: iino@bs.s.u-tokyo.ac.jp.
Data and code availability
Tracking-imaging software is commercially available along with the tracking-stage (HAWKVISION). The code for image analysis is available from the following repository: Mendeley Data: https://doi.org/10.17632/xcxngcy982.1. For more information about the code, please contact the author. All relevant data are available from the authors upon request.
References
- Albrecht D.R., Bargmann C.I. High-content behavioral analysis of Caenorhabditis elegans in precise spatiotemporal chemical environments. Nat. Methods. 2011;8:599–606. doi: 10.1038/nmeth.1630. [DOI] [PMC free article] [PubMed] [Google Scholar]
- Bargmann C.I., Hartwieg E., Horvitz H.R. Odorant-selective genes and neurons mediate olfaction in C. elegans. Cell. 1993;74:515–527. doi: 10.1016/0092-8674(93)80053-h. [DOI] [PubMed] [Google Scholar]
- Brenner S. The genetics of Caenorhabditis elegans. Genetics. 1974;77:71–94. doi: 10.1093/genetics/77.1.71. [DOI] [PMC free article] [PubMed] [Google Scholar]
- Gray J.M., Karow D.S., Lu H., Chang A.J., Chang J.S., Ellis R.E., Marietta M.A., Bargmann C.I. Oxygen sensation and social feeding mediated by a C. elegans guanylate cyclase homologue. Nature. 2004;430:317–322. doi: 10.1038/nature02714. [DOI] [PubMed] [Google Scholar]
- Hilliard M.A., Apicella A.J., Kerr R., Suzuki H., Bazzicalupo P., Schafer W.R. In vivo imaging of C. elegans ASH neurons: cellular response and adaptation to chemical repellents. EMBO J. 2005;24:63–72. doi: 10.1038/sj.emboj.7600493. [DOI] [PMC free article] [PubMed] [Google Scholar]
- Kunitomo H., Sato H., Iwata R., Satoh Y., Ohno H., Yamada K., Iino Y. Concentration memory-dependent synaptic plasticity of a taste circuit regulates salt concentration chemotaxis in Caenorhabditis elegans. Nat. Commun. 2013;4:2210. doi: 10.1038/ncomms3210. [DOI] [PubMed] [Google Scholar]
- Mori I., Ohshima Y. Neural regulation of thermotaxis in C. elegans. Nature. 1995;376:344–348. doi: 10.1038/376344a0. [DOI] [PubMed] [Google Scholar]
- Sato H., Kunitomo H., Fei X., Hashimoto K., Iino Y. Glutamate signaling from a single sensory neuron mediates experience-dependent bidirectional behavior in Caenorhabditis elegans. Cell Rep. 2021;35:109177. doi: 10.1016/j.celrep.2021.109177. [DOI] [PubMed] [Google Scholar]
- Suzuki H., Thiele T.R., Faumont S., Ezcurra M., Lockery S.R., Schafer W.R. Functional asymmetry in Caenorhabditis elegans taste neurons and its computational role in chemotaxis. Nature. 2008;454:114–117. doi: 10.1038/nature06927. [DOI] [PMC free article] [PubMed] [Google Scholar]
- Ward A., Liu J., Feng Z., Xu X.Z.S. Light-sensitive neurons and channels mediate phototaxis in C. elegans. Nat. Neurosci. 2008;11:916–922. doi: 10.1038/nn.2215. [DOI] [PMC free article] [PubMed] [Google Scholar]
Associated Data
This section collects any data citations, data availability statements, or supplementary materials included in this article.
Supplementary Materials
Bright field image on the left and fluorescence image on the right. In the bright field image, the area surrounded by white squares (the pharynx and part of the intestine of the nematode) is used as a template for tracking. Since fluorescein is added to the 25 mM NaCl solution, it is possible to identify the timing of solution switching in the GCaMP channel.
Data Availability Statement
Tracking-imaging software is commercially available along with the tracking-stage (HAWKVISION). The code for image analysis is available from the following repository: Mendeley Data: https://doi.org/10.17632/xcxngcy982.1. For more information about the code, please contact the author. All relevant data are available from the authors upon request.