

Highlights
-
•
Saliva from periodontitis patients and healthy controls was analyzed with SESI-MS.
-
•
Headspace saliva profiles were compared before and after periodontitis therapy.
-
•
Metabolites correlating with periodontitis related bacteria were explored.
-
•
SESI-MS enables rapid analysis of periodontitis related compounds.
Abbreviations: A.a., Aggregatibacter actinomycetemcomitans; BL, baseline; BOP, bleeding on probing; GC-MC, gas chromatography mass spectrometry; P.g., Porphyromonas gingivalis; PPD, pocket probing depth; PSI, periodental screening index; SESI-HRMS, secondary electrospray ionization – high-resolution mass spectrometry; T.d., Treponema denticola; T.f., Tannarella forsythia; UHPLC, ultra high pressure/performance liquid chromatography; VSC, volatile sulfur compounds
Abstract
It has been shown that bacteria in periodontally diseased patients can be recognized by the detection of volatile metabolites in the headspace of saliva by real-time ambient mass spectrometry. The aim of this study was to use this detection method to analyze the oral metabolome in diseased periodontitis patients before and after therapy to monitor disease evolution and healing events.
Twelve patients with advanced chronic periodontal disease and 12 periodontally healthy controls served as test and control groups, respectively. Clinical data, subgingival plaque samples and saliva samples were collected at baseline (BL) and 3 months after treatment. The test group received non-surgical scaling and root planing using systemic antibiotics and the control group received one session of supragingival cleaning. Saliva samples from all subjects were analyzed with ambient mass spectrometry.
Significant metabolic alterations were found in the headspace of saliva of periodontitis patients 3 months after the non-surgical periodontal treatment. Furthermore, the diseased group showed metabolic features after the treatment that were similar to the healthy control group. In addition, 29 metabolic features correlated with A. actinomycetemcomitans, 17 features correlated with P. gingivalis and one feature correlated with T. denticola.
It was shown that headspace secondary electrospray ionization – mass spectrometry allows the detection of different volatile metabolites in healthy and diseased patients. It can be concluded that this rapid and minimally invasive method could have the potential to routinely diagnose and monitor periodontal diseases in the headspace of saliva samples and, eventually, in exhaled breath.
1. Introduction
Periodontitis is an infectious disease of the tooth supporting tissues (i.e., gums) [1]. The collateral periodontal tissue damage is the result of an incipient dysbiosis in susceptible individuals that leads to an exaggerated host immune response to oral microorganisms [2]. Healthy connective tissue and alveolar bone are replaced by an apically migrating defense wall of inflammatory gingival tissue, thus forming a periodontal pocket [3], [4]. In this subgingival environment, complex biofilms, consisting of about 700 taxa [5], benefit from ideal growth conditions for undisturbed formation on the adjacent tooth surface [6]. Three gram-negative, anaerobic microorganisms, Porphyromonas gingivalis (P.g.), Treponema denticola (T.d.) and Tannarella forsythia (T.f.), have been found, among others, with increased prevalence and in elevated numbers, in diseased periodontal sites and have historically been described as “red complex” [7].
Diagnosing a patient as periodontally diseased is mainly based on a clinical and radiological examination that defines the amount of tissue destruction [8]. In addition, targeted microbiological testing can be performed to reveal the quantity of the microbial colonization with the keystone pathogens of the red complex, as well as one facultative anaerobic, non-motile rod, Aggregatibacter actinomycetemcomitans (A.a.) [9]. The main goal in therapy is pocket probing depth (PPD) reduction to PPD ≤ 4 mm and, thus, a reduction of the bacterial load.
A question of interest remains whether periodontitis can be diagnosed non-invasively by detecting volatile compounds responsible for the characteristic bad breath [10]. Different volatile sulfur compounds (VSCs), like methyl mercaptan, dimethyl sulfide and hydrogen sulfide have been significantly associated with periodontally diseased patients [11]. VSCs can be identified in exhaled air by gas chromatography (GC), organoleptic scoring or via easy-to-handle, portable devices like the Halimeter (Interscan corporation, Chatsworth, CA, USA) [12], [13]. VSCs can be well detected, but the challenge is to analyze the other contributing components of oral malodor in periodontitis patients.
Recent research has focused on a more holistic approach of metabolomic profiling for the assessment of the complex host-bacterial interactions and, thus, a more precise disease characterization [14], [15], [16], [17]. Barnes et al. demonstrated differences in the purin degradation pathway in periodontally healthy and diseased patients by analyzing the gingival crevicular fluid with liquid and gas chromatography mass spectrometry (LC-MS, GC-MS) [14]. By analyzing saliva with the same technique, Barnes et al. found different concentrations for 72 metabolites in periodontally healthy and diseased subjects [15]. Marchesan et al. used LC-MS and GC-MS for metabolite identification in saliva as well, and showed a correlation between the individual salivary metabolome composition, the patients’ periodontal status and plaque microbiome [16]. Secondary electrospray ionization - mass spectrometry (SESI-MS) has recently been introduced as an alternative to GC-MS or LC-MS, as it can perform the same analyses in a shorter time [18], [19]. The technique, first described by Fenn and colleagues [20], uses proton transfer reactions between species in the electrospray plume and the volatile analyte molecules, and is also suitable for the analysis of organic volatiles in aerosols [21]. It proved to be a highly sensitive method for untargeted analysis of the metabolic fingerprints of bacteria and bacterial induced inflammatory diseases [17], [18], [19]. One recent study has described the molecular formulae of 18 volatile chemicals in the headspace of saliva of one patient with advanced periodontitis that correlate with the presence of the “red-complex” pathogens [17].
However, no study has examined if changes in metabolome composition can be detected following periodontal treatment. Thus, we aimed to identify metabolic alterations in chronic periodontitis patients before and after treatment by correlating volatile metabolites in the headspace of saliva with microbiological parameters by using SESI-MS. Our hypothesis was that there is a metabolic shift from periodontally diseased to treated subjects. Furthermore, the metabolome composition of the treated subjects should be comparable to that of healthy controls. In addition, volatile metabolites of bacteria within the headspace of saliva should be specific to relevant phyla.
2. Methods
2.1. Design and subjects
Twenty-four systemically healthy subjects were enrolled in this controlled clinical trial. The test group comprised 12 periodontally diseased patients and the control group consisted of 12 periodontally healthy patients. All patients received one professional oral hygiene session consisting of supragingival cleaning and polishing. The patients with periodontal disease received, in addition, non-surgical periodontal therapy with adjunctive antibiotics. At baseline (BL) and 3 months after the intervention, subgingival samples for microbiological analysis and saliva samples for SESI-MS analysis were collected from each patient.
Written informed consent was obtained from all participants. The ethical committee of the Kanton Zurich approved the research project (KEK-ZH-Nr. 2013-0353). The entire study was carried out in accordance with the Helsinki protocol.
The primary outcome of the study was to identify and compare the metabolic compounds measured in the saliva samples at BL and at 3 months in order to identify changes within and between the two patient groups. The secondary outcome was to find specific metabolites that correlate with the presence and abundance of A.a., P.g., T.d. and T.f. in the saliva of the subjects.
2.2. Patients
Subjects enrolled in this study had to fulfill the following criteria: 1) aged ≥ 18 years; 2) systemically healthy; 3) no antimicrobial agents for the 3 months preceding the study; 4) smoking status: ≤ 10 cigarettes/day; 5) no pregnancy or lactation.
For the test group, 12 patients with advanced periodontal disease were identified using the periodontal screening index (PSI) with a code of 4 (i.e., PPD ≥ 6 mm) on at least four sites in a dentition divided into sextants. In contrast, the 12 healthy patients had to display a PSI code of 0, 1 or 2 in all sextants (i.e., PPD ≤ 3 mm).
2.3. Clinical protocol
At baseline the patients in the test and control groups underwent saliva and subgingival biofilm sampling. The patients in the test group underwent, in addition, periodontal examination with clinical parameters (i.e. PPD; bleeding on probing BOP) recorded on six sites per tooth.
Afterwards, patients from the test and the control groups received individual oral hygiene instructions and removal of supragingival hard and soft bacterial deposits. The patients of the test group were scheduled for a non-surgical periodontal treatment by one trained dentist. Subgingival scaling and root planing (SRP) was completed within 7 days on two appointments, each for one side (left / right) of the mouth, under local anesthesia using curettes (Gracey, Hu-Friedy Co., Chicago, USA) and ultrasonic scalers (PiezoLED, Kavo, Biberach, Germany). Adjunctive antibiotics were prescribed for 7 days (500 mg metronidazole + 500 mg amoxicillin; 3 times a day) starting in the morning of the second treatment visit. Patients were instructed to rinse their mouth twice daily during the following month with 0.2% chlorhexidine (GlaxoSmithKline, Brentford, Middlesex, United Kingdom). Control visits were performed at 1 and 4 weeks and reevaluation of clinical parameters was performed at the final visit at 3 months.
The patients in the control group were scheduled for one final visit 3 months after the supragingival cleaning and the PSI code was determined. Saliva sampling and subgingival biofilm sampling were performed on the final visit in both patient groups. Fig. 1 presents the study flow chart.
Fig. 1.

Scheme a) and images (b and c) showing the SESI-MS set-up for analyzing saliva headspace. A pure air flow is regulated with a flow controller (1) and directed into the inlet line of the sample vial holder (2) and into the exchangeable sample vial containing 200 µL of saliva. The air flow combined with the saliva headspace is pushed back through the outlet line of the sample holder (2) and transferred into the heated sampling line (4). Afterwards, the vapor flow is ionized inside the SESI ion source (5), which is supplied and controlled with an additional box (6 / gas and heating control). The analyte ions enter the high-resolution quadrupole time-of-flight mass spectrometer (7) and are analyzed. The partially open view of the mass spectrometer was reproduced with permission, courtesy of AB Sciex Pte. Ltd.
2.4. Analytical procedures
2.4.1. Saliva sampling and microbial sampling
At the Baseline visit, three unstimulated whole saliva samples were collected in three vials from each of the 24 patients. Subjects were instructed not to eat, drink, smoke or brush their teeth at least three hours prior to saliva collection. The saliva samples were stored at −80 °C. For subgingival biofilm sampling in the test group, the deepest periodontal pocket of each quadrant was selected. In the control group, subgingival samples were obtained from the mesio-buccal area of the first molar in each quadrant. At the selected sites, supragingival plaque was removed carefully with cotton balls and subgingival bacterial samples were collected using one sterile paper point per site. After 15 s, each paper point was removed and the resulting four paper points per patient were pooled together in one vial containing an RNA stabilizing buffer (i.e., 4 M guanidinium thiocyanate 2-mercaptoethanol). The commercially available IAI Pado-Test 4.5 (IAI AG, Zuchwil, Switzerland) was used to identify and quantify the following pathogenic microorganisms: T.f., P.g., T.d. and A.a.. Bacterial counts were expressed as counts ×106 [22].
2.4.2. Real-time mass spectrometric head-space analysis of saliva
For high-resolution SESI-MS analysis (Fig. 1), all saliva samples were thawed and brought to room temperature without auxiliary heating. A 200 µL droplet of saliva was transferred from each sample vial to a 5-mL glass flask. A “flow-through” sampling system made from glassware was prepared. A pressurized air flow of medical air (Pangas, Dagmersellen, Switzerland) was introduced into the inlet of the sampling device and adjusted to 0.2 L min−1 with a manual flow controller. The outlet port of the device was connected to the inlet tube of the ion source. The analysis was performed with a commercial low flow SESI source (SEADM, Boecillo, Valladolid, Spain) connected to a quadrupole time-of-flight mass spectrometer. The SESI source was coupled to a high-resolution mass spectrometer with tandem MS capabilities (TripleTOF 5600+, Sciex, Toronto, ON, Canada). The inlet tube and the core of the ion source were heated to 80 °C and 130 °C, respectively. The SESI ion source was supplied with an electrospray solution of LC-MS grade water and 0.1% formic acid. An overpressure of 0.05 mbar of air was applied to the ES solution vial. Uncoated, fused silica capillaries (50 μm, TaperTip Emitters, Nev Objectives Woburn, MA, USA) were used to generate the nano-electrospray. For the analysis, a sample glass flask was connected to the sampling device. The air flow from the inlet flushed the flask, thereby transferring the headspace over the saliva sample to the ion source inlet. Compounds present in the headspace were ionized in the SESI source and analyzed in the mass spectrometer. All 144 samples (3 technical replicates, 24 subjects and 2 treatment conditions) were measured twice, once in positive and once in negative ionization mode. Ions were analyzed in the range of m/z 40–650 (positive mode) and m/z 40–300 (negative mode).
2.4.3. Compound identification with liquid chromatography – Tandem mass spectrometry
A tentative sum formula for the significant m/z features was explored using the exact mass and isotopic pattern distribution from the real-time headspace saliva analysis. Where possible, further compound identification was performed using liquid chromatography - tandem mass spectrometry (LC-MS/MS) to compare retention time and fragmentation patterns of the substance and potential reference standards. Where no standard was available, fragmentation patterns were compared against databases. These annotations are tentative. For this, saliva samples from patients and controls (1000 µL each) were mixed with 1000 µL of MS grade methanol (Merck, Zug, Switzerland) in 2 mL Eppendorf tubes for 10 min. The samples were then centrifuged for 15 min at 15000g and 4 °C (Heraeus Fresco 21, Thermo Scientific, Bremen, Germany). 600 µL of each supernatant was transferred into a new Eppendorf tube. The solvent was removed by using a vacuum centrifuge for 4 h at 40 °C and 200 mbar vacuum (RVC 2–18 vacuum centrifuge, Christ, Osterode, Germany). Afterwards, the samples were reconstituted in 300 µL (UHPLC) of eluent at starting conditions (95% A and 5% B as described below) and mixed. Ultra high performance/pressure chromatography - tandem mass spectrometry (UHPLC-MS/MS) analysis was performed on an ACQUITY I-Class UPLC system (Waters, MA, USA) using a C18 ACQUITY column (1.8 µm, 2.5 × 50 mm, Waters, MA, USA) coupled with a high-resolution mass spectrometer with tandem MS capability (TripleTOF 5600+, Sciex, Toronto, ON, Canada). The samples were stored at 5 °C during the analysis, the column temperature was maintained at 30 °C and the chromatographic flow was set to 500 µL/min. The following mobile phases were used: mobile phase A (MS-grade water with 0.1% formic acid) and mobile phase B (MS-grade methanol with 0.1% formic acid). The gradient conditions were as follows: 1 min (5% B), 3 min (5–95% B), 1 min (100% B), 1 min (100–5% B) and 1 min (5% B) with a pressure up to 1100 bar. Phase A accepts all gradient conditions that complement the values of phase B to 100%. The eluent from the column was directly transferred to the DuoSpray ion source (+5.5 kV/−4.5 kV) of the mass spectrometer and analyzed. Mass spectra were recorded in MS and tandem MS mode at a range of m/z 40–600 in positive and negative ion mode. A test mixture with a set of reference compounds and blank samples was injected throughout the batch every 40–50 min to check for possible LC retention time variation (<1s for the entire batch) and carry-over effects. More detailed information about the compound identification is in the Supplementary Material (Table E3). All laboratory analyses were masked.
2.5. Data analysis
Patient characteristics were pooled in each of the two groups and depicted as mean values with standard deviations. All 288 data files of the SESI-MS were visually checked, mass calibrated with PeakView 2.2 (Sciex, Toronto, ON, Canada), and converted into *.mzXML files (msConvert, REF). The *.mzXML data were imported into Matlab (R2017a, MathWorks, Natick, MA, USA) and further processed, as previously described [23]. All mass spectra files were resampled, centroided and smoothed. A peak picking procedure was applied to extract all m/z features and the corresponding intensity values that were enhanced during the sample introduction. The mean of the three technical replicates from each subject and therapy condition was calculated, resulting in a final data matrix (number of measurements × m/z features) with 48 × 6114 features. The entire data matrix was assessed by unsupervised methods, such as PCA and PCA with t-distributed stochastic neighbor embedding (distance metrics used: euclidean, chebychev, cosine & spearman). In a second round the data was tested using a supervised, one-way multivariate analysis of variance (MANOVA). In a last attempt, for the within group comparison of the saliva compounds in the test and control group, t-tests on the log2 of the 3 months/BL ratios were calculated. Related p-values were corrected for false discovery rate. A linear fit model with robust bisquare weighting was used to calculate Pearson’s correlation coefficients to identify correlations between saliva headspace metabolites and the presence of periodontal pathogens. Features were considered relevant if they had a correlation coefficient r2 > 0.5 and a false discovery rate corrected p-value < 0.01.
3. Results
3.1. Trial profile and patient characteristics
Table 1 displays the patient characteristics and the clinical and microbiological data at baseline (BL) and 3 months post-treatment of the test and the control groups. Initially, patients in the test group showed a mean PSI value of 3.94 and had an overall mean PPD of 4.6 ± 2.4 mm and BOP of 62.0% ± 49.1%. At 3 months after the therapy, the mean PSI value was 3.19 and the overall mean PPD was 2.8 ± 1.1 mm while 11.6% ±13.3% of all sites showed BOP. In the diseased test group, 10 of 12 patients tested positive for A.a., whereas in the healthy control group 1 person was positive for A.a.. Regarding the “red complex” bacteria, i.e. B.f., P.g. and T.d., all 12 patients in the test group were found to be positive. In the control group, 4 subjects tested positive for P.g., 3 for B.f. and 5 for T.d.. The counts for the total bacterial load, as well as the microbiological biomarkers were higher in the diseased than in the healthy group. More detailed information on the microbial status of each subject before and after treatment is in the Supplementary Material (Tables E1 and E2).
Table 1.
Patient characteristics. PSI: Periodontal Screening Index; BL: baseline; n.a.: not applicable in the control group; PPD: pocket probing depth; BOP: bleeding on probing. * relative bacterial counts (x106) estimated by the IAI PadoTest 4.5 as mean values.
| Periodontitis Patients (n = 12) | Healthy Controls (n = 12) | |
|---|---|---|
| Age (years) | 45.6 ± 8.4 | 37.6 ± 10.1 |
| Female (N, %) | 7 (58) | 9 (75) |
| Smoker (N, %) | 6 (50) | 0 (0) |
| PSI BL | 3.94 | < 2 |
| PSI 3 months | 3.19 | < 2 |
| PPD BL (mm) | 4.6 ± 2.4 | n.a. |
| PPD 3 months (mm) | 2.8 ± 1.1 | |
| BOP BL (%) | 62.0 ± 49.1 | n.a. |
| BOP 3 months (%) | 11.6 ± 13.3 | |
| Aa (BL/3 months)* | 0.59/0.08 | 0/0 |
| Bf (BL/3 months)* | 7.46/1.25 | 0.76/0.20 |
| Pg (BL/3 months)* | 6.45/0.25 | 0.10/0.03 |
| Td (BL/3 months)* | 3.80/0.66 | 0.54/0.18 |
3.2. Saliva analysis
3.2.1. Periodontitis-specific metabolic profile in saliva
The analysis of a saliva sample with the SESI-MS, including sample uptake, introduction and measurement, took approximately 2 min. Therefore, it was possible to measure all 144 samples within 5 h (an extracted ion chromatogram for pyridine in all samples is presented in Figure E1). The real-time headspace analysis revealed 6114 m/z features in the headspace present in all 144 saliva samples. The present study was able to identify 31 volatile metabolites in the headspace of saliva that were altered in diseased patients before the treatment and 3 months after the treatment. The selection of the metabolites based on t-tests applied for the within-groups comparison. This means metabolites were selected that changed in concentration (between base-line and 3 months) in the patient group, but not in the healthy control group. These 31 metabolites are depicted in Table 2. Among them, five compounds could be tentatively annotated (tentative compound name) and 26 tentatively characterized (tentative sum formula). The majority (29 of 31) of the significant compounds, based on the evaluated q-vales, showed reduced intensity in the diseased patients after therapy. For the same compounds in the healthy controls, no difference was found between baseline and 3 months.
Table 3.
Table 3 shows correlations between the periodontal pathogens and the saliva headspace compounds.
| Characteristics | Aa | Pg | Td | Tf & TBL |
|---|---|---|---|---|
| # significant compounds (q < 0.01 & r2 > 0.5) | 29 | 17 | 1 | – |
| correlation coefficient r | 0.71–0.81 | 0.72–0.86 | 0.65 | – |
| Overlap with previous study(17) | 1 | 2 | – | – |
Table 2.
The within-group comparison shows 31 features that are significantly altered in the test group at baseline and at 3 months. The features were not significantly altered in healthy controls (t-test / p < 0.05 / q > 0.2). 13C isotopomers were removed.
| Saliva headspace signal features |
Signal comparison in periodontitis patients and healthy controls at BL and 3 months |
Saliva signal change in the periodontitis group | |||||
|---|---|---|---|---|---|---|---|
| m/z | Sum formula | Tentative ID | Within test group changes (n = 12) |
Within control group changes (n = 12) |
3 months / BL ratio | ||
| p | q | p | q | ||||
| 79.8013 | – | – | 0.00091 | 0.19 | 0.55 | 0.29 | 1.51 |
| 80.0491 | C5H5N | Pyridine | 0.00087 | 0.19 | 0.49 | 0.27 | 0.71 |
| 81.0513 | – | – | 0.00026 | 0.19 | 0.54 | 0.29 | 1.46 |
| 115.0169 | – | – | 0.00081 | 0.19 | 0.69 | 0.33 | 0.20 |
| 156.1023 | C8H23NO2 | Arecoline | 0.00136 | 0.19 | 0.29 | 0.23 | 0.76 |
| 161.1176 | C8H16O3 | Hydroxyoctanoic acid | 0.00125 | 0.19 | 0.84 | 0.37 | 0.78 |
| 173.0724 | C10H8N2O | – | 0.00049 | 0.19 | 0.96 | 0.40 | 0.85 |
| 175.0745 | C11H10O2 | – | 0.00096 | 0.19 | 0.26 | 0.23 | 0.86 |
| 175.1336 | C9H18O3 | Hydroxynonaoic acid | 0.00126 | 0.19 | 0.14 | 0.23 | 0.79 |
| 176.0811 | C9H9N3O | – | 0.00065 | 0.19 | 0.11 | 0.23 | 0.85 |
| 185.0728 | – | – | 0.00116 | 0.19 | 0.24 | 0.23 | 0.82 |
| 191.0825 | C10H10N2O | – | 0.00117 | 0.19 | 0.11 | 0.23 | 0.87 |
| 198.0520 | C7H7N3O4 | – | 0.00124 | 0.19 | 0.89 | 0.39 | 0.86 |
| 203.0841 | – | – | 0.00117 | 0.19 | 0.91 | 0.39 | 0.86 |
| 203.1075 | C13H14O2 | – | 0.00141 | 0.19 | 0.24 | 0.23 | 0.88 |
| 205.0851 | C12H12O3 | – | 0.00122 | 0.19 | 0.74 | 0.35 | 0.82 |
| 207.1017 | C12H14O3 | Hydroxydodecapentaenoic acid | 0.00052 | 0.19 | 0.58 | 0.30 | 0.89 |
| 212.0679 | C8H10N3O4 | – | 0.00113 | 0.19 | 0.52 | 0.28 | 0.80 |
| 219.1020 | C13H14O3 | – | 0.00023 | 0.19 | 0.54 | 0.29 | 0.85 |
| 226.0614 | C12H7N3O2 | – | 0.00010 | 0.19 | 0.57 | 0.30 | 0.71 |
| 231.1002 | – | – | 0.00002 | 0.07 | 0.95 | 0.40 | 0.82 |
| 238.1812 | C14H23NO2 | – | 0.00076 | 0.19 | 0.64 | 0.32 | 0.68 |
| 239.1833 | – | – | 0.00108 | 0.19 | 0.48 | 0.27 | 0.75 |
| 244.9486 | – | – | 0.00060 | 0.19 | 0.74 | 0.34 | 0.06 |
| 245.0323 | – | – | 0.00054 | 0.19 | 0.40 | 0.25 | 0.91 |
| 247.0120 | – | – | 0.00115 | 0.19 | 0.73 | 0.34 | 0.89 |
| 283.0263 | C12H10O6S | volatile sulfure compound | 0.00062 | 0.19 | 0.51 | 0.28 | 0.90 |
| 314.1133 | – | – | 0.00094 | 0.19 | 0.49 | 0.27 | 0.75 |
| 363.0228 | – | – | 0.00058 | 0.19 | 0.57 | 0.30 | 0.39 |
| 396.0820 | – | – | 0.00134 | 0.19 | 0.96 | 0.40 | 0.08 |
| 446.8758 | – | – | 0.00137 | 0.19 | 0.64 | 0.32 | 0.37 |
Fig. 2 presents the difference between the test and the control group using a principal component analysis of the related 3 months/BL ratios from the three most differentiating (based on q-values) m/z features from the salivary analysis.
Fig. 2.
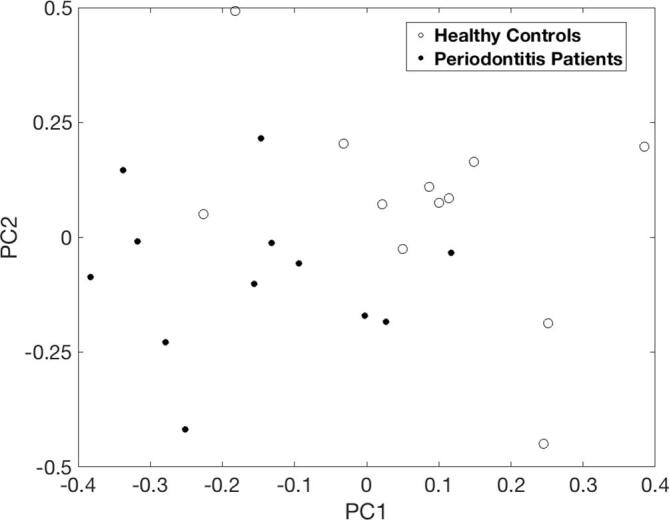
Projection of the three most differentiating saliva features (m/z 219.0102, 226.0614 and 231.1002) from the 3 months/BL therapy ratios onto a two-dimensional PCA subspace for visualization purposes. Both groups cluster with one outlier in each group.
Fig. 3a visualizes the results from a selected ion chromatogram of pyridine, which plots the injection peaks of the saliva of one healthy control and one patient before and after treatment. In addition, the saliva signal of pyridine, a significantly altered compound in the diseased group, is depicted in Fig. 3b for each of the 12 patients per group. In periodontitis patients, the pyridine concentration was clearly reduced after therapy. In healthy controls, no strict trend was observable between baseline and final examination. Supplementary Figure E2 shows mass spectra in positive ion mode of individual subjects (healthy control and patient) before and after treatment.
Fig. 3.

a) An ion chromatogram of pyridine, presenting the analysis of saliva headspace (three technical replicates each) from a healthy control and a periodontitis patient before and after treatment. Each peak on the time axis corresponds to the selected ion current at m/z = 80.0491. b) Boxplots of the pyridine signal levels in the saliva headspace from all subjects. Only the signals in periodontitis patients show a significant (p < 0.05 / q < 0.2) trend, the pyridine concentration being reduced after therapy. No statistical difference is evident for the healthy controls before and after treatment.
3.2.2. Correlation between bacterial colonization and saliva headspace m/z features
For the secondary outcome, the saliva headspace was analyzed for compounds that correlated with the abundance of the four pathogens, i.e., A.a., P.g., T.d., T.f., and with the total bacteria load. We detected 29 metabolites that correlated with A.a., 17 with P.g. and one with T.d.. The correlations for both A.a. and P.g. showed 8 common metabolites, the correlations for A.a. and T.d. showed one common metabolite. No m/z features correlated with T.f. or the total bacteria load. Two m/z features were also in the group that changed after therapy in periodontitis patients: A.a.: m/z 79.8013 and 80.0491. All correlating compounds are listed in Table 4. The correlation coefficient, r, for A.a. with the altered metabolites varied from 0.71 to 0.81 and for P.g. from 0.72 to 0.86. For T.d. r was 0.65. The scatter plots are shown in the Supplementary Material (Fig. E3). Therein, it can be recognized that for all samples with zero abundance (bacteria 106) of the specified bacterial strain, the feature intensities are grouped around the calculated regression line and are not equal to zero.
Table 4.
Table 4 shows m/z found to significantly correlate with abundance changes of A.a. (29), P.g. (17) or T.d. (1).
|
m/z from saliva that correlate with a change in abundance of A.a. |
m/z from saliva that correlate with a change in abundance of P.g. |
||||||
|---|---|---|---|---|---|---|---|
| m/z | Correlation coefficient r | p-value | q-value | m/z | Correlation coefficient r | p-value | q-value |
| 42.0093 | 0.81 | 9.64E-06 | 9.06E-04 | 42.0093 | 0.82 | 6.23E-11 | 7.04E-08 |
| 42.0205 | 0.77 | 2.27E-04 | 9.48E-03 | 53.0126 | 0.86 | 2.08E-14 | 5.87E-11 |
| 53.0126 | 0.80 | 4.53E-06 | 5.36E-04 | 71.0124 | 0.72 | 5.49E-08 | 2.22E-05 |
| 79.8013 | 0.77 | 1.46E-10 | 3.85E-07 | 79.0748 | 0.80 | 1.36E-11 | 2.57E-08 |
| 80.0491 | 0.76 | 4.43E-10 | 7.77E-07 | 107.0328 | 0.79 | 2.05E-11 | 2.89E-08 |
| 81.0513 | 0.77 | 1.12E-10 | 3.85E-07 | 217.2160 | 0.73 | 1.14E-05 | 1.83E-03 |
| 98.0587 | 0.74 | 2.51E-09 | 2.64E-06 | 220.0518 | 0.72 | 9.54E-09 | 5.99E-06 |
| 225.2579 | 0.74 | 1.17E-07 | 4.74E-05 | 223.1330 | 0.72 | 5.62E-05 | 6.89E-03 |
| 226.9799 | 0.72 | 2.34E-06 | 3.52E-04 | 231.2318 | 0.74 | 1.45E-08 | 8.18E-06 |
| 227.2377 | 0.71 | 1.36E-04 | 7.07E-03 | 246.9875 | 0.75 | 7.92E-09 | 5.94E-06 |
| 231.2318 | 0.79 | 6.86E-07 | 1.53E-04 | 257.0448 | 0.76 | 1.95E-09 | 1.83E-06 |
| 245.2477 | 0.74 | 1.55E-06 | 2.64E-04 | 281.1012 | 0.86 | 1.13E-14 | 5.87E-11 |
| 246.9875 | 0.74 | 6.90E-06 | 7.12E-04 | 297.3154 | 0.77 | 1.10E-07 | 3.27E-05 |
| 247.2274 | 0.72 | 7.92E-05 | 4.48E-03 | 301.2750 | 0.73 | 8.42E-09 | 5.94E-06 |
| 253.2895 | 0.75 | 2.65E-07 | 7.75E-05 | 323.2946 | 0.73 | 6.71E-08 | 2.53E-05 |
| 254.2928 | 0.77 | 2.33E-08 | 1.36E-05 | 325.3469 | 0.74 | 7.32E-08 | 2.58E-05 |
| 255.2693 | 0.73 | 6.30E-07 | 1.53E-04 | 327.3267 | 0.73 | 4.52E-08 | 2.13E-05 |
| 266.2842 | 0.72 | 5.36E-07 | 1.48E-04 | ||||
| 275.2579 | 0.77 | 1.42E-07 | 5.33E-05 | m/z from saliva that correlate with a change in abundance of Td | |||
| 283.2997 | 0.73 | 2.14E-06 | 3.40E-04 | m/z | Corr. Coeff. r | p-value | q-value |
| 297.3154 | 0.78 | 2.60E-07 | 7.75E-05 | 362.3063 | 0.65 | 6.30E-07 | 3.70E-03 |
| 298.0866 | 0.75 | 6.97E-10 | 9.17E-07 | ||||
| 299.2952 | 0.72 | 7.38E-07 | 1.53E-04 | ||||
| 311.3312 | 0.75 | 6.29E-07 | 1.53E-04 | ||||
| 323.2946 | 0.73 | 1.66E-05 | 1.39E-03 | ||||
| 325.3469 | 0.78 | 1.89E-08 | 1.24E-05 | ||||
| 327.3267 | 0.78 | 3.64E-08 | 1.92E-05 | ||||
| 362.3063 | 0.72 | 9.69E-09 | 7.29E-06 | ||||
| 212.0802 | 0.72 | 7.54E-09 | 6.61E-06 | ||||
Three significantly correlating saliva metabolites of this study were found in the metabolic profile of a peridontally diseased group in a previous study performed by our group: A.a.: m/z 53.0126 and P.g.:m/z 53.0126 and 107.0328 [17].
4. Discussion and conclusions
The primary goal of the present study was to compare oral metabolomic profiles, within a periodontally diseased patient cohort, before and after non-surgical treatment. The volatile compounds of saliva served as the subject matter of our SESI-MS analysis. This study is intended to further pave the way for non-invasive, low-cost diagnostic tests on exhaled air to identify the presence of periodontal diseases.
Secondary electrospray ionization – mass spectrometry proved to be a valuable tool for analyzing the headspace of saliva samples from periodontitis patients and healthy controls for identifying disease-related metabolites. This untargeted approach allowed the measurement of volatile and semi-volatile compounds in positive and negative polarity MS and MS/MS mode. SESI-MS further allowed for real-time analysis, which resulted in a much higher sample throughput (i.e., 144 samples within 5 h) than traditional GC-MS analysis. The use of high-resolution mass specinctrometry partially compensated for absence of chromatography as a separation dimension. The use of a SESI ion source enables any ambient mass spectrometer to be used for analyzing saliva headspace samples. With no need for a fixed instrumental architecture (e.g., ion source – mass spectrometer), like in GC-MS, the cost for such measurements is reduced dramatically.
Among 6114 measured features, as represented by m/z values, our study revealed 31 metabolites that had differing abundance in patients after therapy, but not in healthy controls, and 38 metabolites that correlated with the abundance of varying periodontal bacteria based on t-testing of within-group changes. PCA, variations of PCA with t-distributed stochastic neighbor embedding, and one-way multivariate analysis of the variance methods did not show a significant grouping of the data. This could be explained by the fact that within-group variation was not sufficiently less than the between-group variation [39]. It should be mentioned that Barnes et al. [15] identified 40 named and 32 unnamed metabolites that were increased in periodontitis patients compared to healthy controls; metabolites of triglycerids, polysaccharides, polynucleotides and proteins were described. In our analysis, we were able to identify one VSC in the headspace of saliva by SESI-MS. VSCs have been used for decades as a diagnostic indicator for oral malodor associated with periodontal disease [24]. They are the result of the putrefaction of food debris, cells, saliva and blood components by gram negative bacteria residing in periodontal pockets and on the tongue dorsum [13]. The compound with the sum formula C12H10O6S identified in our study was elevated in periodontitis patients before the treatment and significantly reduced at 3 months. While this reduction might be associated with the improvement in clinical and microbial parameters during healing in the diseased group, it could also be associated with improvement in oral hygiene habits, including tongue cleansing. In addition, the heterocyclic compound, pyridine, was elevated in the saliva headspace in diseased patients at BL. Pyridine has previously been reported to be elevated in periodontally diseased patients analyzed by GC-MS [25]. It has been suggested to be involved in metabolic disease processes [26] and is known to be responsible for the periodontitis-associated oral malodor [27].
Furthermore, the hydroxy acids, 2-hydroxyoctanoic and hydroxynonaoic acid, were detected. Periodontitis patients at BL showed significantly higher counts of these two fatty acids compared to the counts 3 months after the treatment, as well as compared to the healthy group at BL. This compound class is known to be produced in bacteria as a storage product if carbon and energy are abundant [28]. Hydroxydodecapentaenoic acid, another class of long chain fatty acids, was found to be significantly elevated in the test group at BL compared to 3 months after treatment. Barnes et al. also detected several fatty acid derivatives, like arachidonate, docosanpentaenoate anddocosahexaenoate, that are known to represent inflammation molecule precursors [15]. The significantly higher level of fatty acids could be attributed to the up-regulation of enzyme activity in the diseased group, in particular the lipase activity and, consequently, the metabolism of triglycerides. In fact, there is no evidence in the literature about a direct link between the metabolites detected in our study and periodontal disease. Nevertheless, our untargeted analysis revealed the presence of unexpected members of the same chemical compound class. An exogenous compound, arecoline, was also tentatively identified to be enhanced in the test group at BL. This alkaloid is produced in areca nuts and is present in chewing gum and tobacco. Six patients in the diseased group had a positive anamnesis for the latter, which might explain its presence. Arecoline has previously been identified as a strong promoter of periodontitis [29]. It can inhibit cell growth [30] and upregulate genes responsible for oxidative stress responses [31]. Surprisingly, it was reduced after 3 months, even though the smokers did not change their smoking habits.
The clinical parameters reflect the successful pocket elimination to PPD ≤ 4 mm in most of the sites in the diseased patient cohort with a mean PPD reduction of 1.8 mm to the 3 months mean PPD of 2.8 ± 1.1. In the periodontally diseased group, scaling and root planing has been combined with Amoxicillin and Metronidazole in order to achieve the best possible clinical improvement. There is abundant evidence for the benefits of the adjunctive antimicrobial treatment protocol in patients with severe periodontitis [40], which has been proven for smokers as well [41]. In addition, the combined mechanical and antimicrobial treatment regimen seems to suppress A.a. and to significantly reduce the pathogenic microbiome composition up to at least 3 months [42]. The higher mean PSI of 3.19 in the test group after treatment compared to that of the control group (PSI < 2) can be explained by the presence of residual pockets of ≥6 mm in the test group. Yet one residual pocket per sextant is sufficient to permute a PSI into code 4. Concerning the microbial status, the test group initially presented with a nearly ubiquitous colonization of the red complex bacteria, which is in accordance with other studies [32], [33]. Also, nine subjects from the healthy control group showed a colonization with at least one key marker of the red complex, but with lower marker loads. Also in non-diseased patients periopathogens can be present [34], [35], but with lower counts, as the bacterial count is positively correlated with the pocket probing depth [36]. Thus, the reduction of PPD after 3 months in our test group correlates with a reduction of the bacterial counts to values comparable to healthy controls. For microbiological testing, the IAI PadoTest 4.5 was used in this study. This test is known to have a low sensitivity due to the use of oligonucleotide probes against 16rRNA, compared, for example, to the more laborious and expensive checkerboard analysis, a standard method in molecular biology, that uses whole genomic DNA/DNA hybridization methods. Therefore, the number of positive individuals found in our study might be underestimated, especially in the healthy control group, because the number of bacteria might be below the detection limit of 104 for the red complex and 5 × 10³ for A.a.. As we measured the healthy control group twice (i.e., at BL and at 3 months), and the measurements remained in the range of 0.1 × 10⁶, we considered these measurements consistent. This amount was 10-fold lower compared to the diseased group before treatment for all pathogens, which is in accordance with data reported by Belibasakis et al. 2014 [32]. Therefore, we concluded that the difference between healthy and diseased patients was not random.
For the secondary outcome, saliva metabolites that correlated with bacterial colonization by the four pathogens, A.a., P.g., T.d., T.f. and the total bacterial load, were determined. Reduction of the abundance of the four periopathogens due to treatment could be reflected in reduction of saliva metabolites, as detected by SESI-MS. Thus, this technique might allow identification of metabolites related to inflammatory periodontal disease, since it is associated with inflammation, oxidative stress, tissue degradation, and bacterial metabolism. Human saliva has been shown to present an ideal diagnostic medium for analysis with SESI-MS to monitor bacterial colonization in a sensitive and specific way [18]. The associations of A.a., P.g. and T.d. with selected metabolites were strong (r > 0.6). We found two compounds (window of 50 mDa) that were identical to metabolites in a previous preliminary study by our group [17]. One was characteristic for P.g. and A.a., and one for A.a.. This overlap can be seen as preliminary proof of the reliability of the SESI-MS used for the analysis in both studies. In that study [17], we focused only on metabolites produced by the four periodontal markers A.a., P.g., T.d. and T.f. and, thus, determined 18 metabolic compounds that were significantly increased in the saliva of diseased periodontitis patients. The present work enlarges the range of saliva metabolites, as we performed an untargeted SESI-MS analysis of metabolites in periodontitis patients. These metabolites have, in general, higher m/z values than the compounds in our previous work [17]. This could be partially explained by the improved heating and enhanced ionization efficiency of the new SESI source used in the current study.
Based on our results, using PCA we were able to separate the periodontitis patients from healthy controls, with one exception for each group, using three metabolites from the 31 found to be changed. This provides evidence that, with further development and validation using larger independant datasets, periodontitis could be realistically diagnosed based on SESI-MS analysis of saliva headspace.
The present clinical study was limited by the number of subjects. To compensate for this deficiency, we structured the study to focus on the BL and 3-month follow-up ratio from the patient samples. Thus, in contrast to only comparing the metabolite concentrations between a diseased and a healthy group, our approach allowed us to specifically detect metabolites that changed in patients after therapy. Furthermore, the full complement of the oral microbiome, consisting of presumably >700 bacterial species, was not analyzed, reflecting the explorative nature of this study, as we focused on only four key pathogens [7]. Other newly described pathogenic taxa, such as Synergistetes or Filifactor [6], [16], [37], could also exhibit an important influence on the saliva metabolites. In addition, the complex interactions and changes inside the microbiome during periodontal healing, such as the increase and decrease of different groups of genera [42], could impact the salivary metabolome. These two aspects should be examined in the future.
In conclusion, it was possible to identify significant metabolic changes in saliva related to periodontal healing. From a clinical perspective, the continuous survey of target microorganisms to prevent disease onset or recurrence is useful especially in susceptible patients who are at greater risk for disease progression [38]. We were able to demonstrate the suitability of SESI-MS for performing rapid and high-throughput measurement of volatile metabolites that correlate to these microorganisms, and that the headspace of saliva is a reasonable analytical medium. Consequently, SESI-MS has the potential to become a valuable tool for cost-efficient and rapid diagnosis, as well as monitoring therapy for periodontal diseases. However, it should be emphasized that once metabolic changes are detected, site-specific identification of the diseased areas in the periodontium by traditional clinical measurement methods is still required.
5. Summary of the “take home” message
Periodontitis is a bacterial infection that can be characterized by specific metabolomic biomarkers derived from bacteria and the host. Recent research has demonstrated that various products of the metabolome in periodontitis patients can be discovered by the analysis of the saliva headspace with ambient mass spectrometry. Our aim is to gain more insight into the fingerprinting of volatile metabolites and the changes during the healing period of periodontal disease, by comparing the metabolome of healthy and diseased patients. In the future, the mass spectra might be used to identify and monitor healthy and diseased patients. Clinicians and patients could benefit from the minimal invasiveness and short detection time if secondary electrospray ionization - mass spectrometry is applied.
Acknowledgments
Acknowledgments
We are indebted to Prof. Dr. Malcolm Kohler (University Hospital Zurich, Zurich, Switzerland) for the use of the AB Sciex TripleTOF 5600+ mass spectrometer. We thank Pablo Martinez-Lozano Sinues for helpful discussions.
Contributors
Conception and design: PS, LB, CM, RZ. Data acquisition: LB, CM, SG and TB. Analysis and interpretation of data: LB, CM, and TB. Drafting the article: LB, CM, RS and RZ. Revising the article for important intellectual content and final approval: All authors.
Competing interests
Conflict of Interest: None of the authors has any conflicts of interest to disclose.
Funding
This study was supported - in part - by a grant of the Swiss National Science Foundation (LB / CR23I2_149617).
Ethics approval
Cantonal Ethics Committee of Zurich
Footnotes
Supplementary data to this article can be found online at https://doi.org/10.1016/j.clinms.2019.01.001.
Appendix A. Supplementary data
The following are the Supplementary data to this article:
References
- 1.Van Dyke T.E., Serhan C.N. Resolution of inflammation: a new paradigm for the pathogenesis of periodontal diseases. J. Dent. Res. 2003;82(2):82–90. doi: 10.1177/154405910308200202. [DOI] [PubMed] [Google Scholar]
- 2.Cochran D.L. Inflammation and Bone Loss in Periodontal Disease. J. Periodontol. 2008;79(8s):1569–2157. doi: 10.1902/jop.2008.080233. [DOI] [PubMed] [Google Scholar]
- 3.Kornman K.S. Mapping the pathogenesis of periodontitis: a new look. J. Periodontol. 2008;79:1560–1568. doi: 10.1902/jop.2008.080213. [DOI] [PubMed] [Google Scholar]
- 4.Dewhirst T., Chen J., Izard B.J., Paster A.C., Tanner W.H. The human oral microbiome. J. Bacteriol. 2010:5002–5017. doi: 10.1128/JB.00542-10. [DOI] [PMC free article] [PubMed] [Google Scholar]
- 5.Zijnge V., Van Leeuwen M.B., Degener J.E., Abbas F., Thurnheer T., Gmur R., Harmsen H.J. Oral biofilm architecture on natural teeth. PLoS ONE. 2010;5(2) doi: 10.1371/journal.pone.0009321. [DOI] [PMC free article] [PubMed] [Google Scholar]
- 6.Socransky S.S., Haffaje A.D., Cugini M.A., Smith C., Kent R.L. Microbial complexes in subgingival plaque. J. Clin. Periodontl. 1998;25:134–144. doi: 10.1111/j.1600-051x.1998.tb02419.x. [DOI] [PubMed] [Google Scholar]
- 7.Preshaw P.M. Detection and diagnosis of periodontal conditions amenable to prevention. BMC Oral Health. 2015 doi: 10.1186/1472-6831-15-S1-S5. 2015;15:PMC4580822. [DOI] [PMC free article] [PubMed] [Google Scholar]
- 8.Herrera D., Alonso B., Leon R., Roldan S., Sanz M. Antimicrobial therapy in periodontitis:the use of systemic antimicrobials against the subgingival biofilm. J. Clin. Periodontol. 2008;35:45–66. doi: 10.1111/j.1600-051X.2008.01260.x. [DOI] [PubMed] [Google Scholar]
- 9.Rosenberg M. Bad breath and periodontal disease: how related are they? J. Clin. Periodontol. 2006;33:29–30. doi: 10.1111/j.1600-051X.2005.00874.x. [DOI] [PubMed] [Google Scholar]
- 10.Morita M., Wang M.L. (2001a) Relationship of sulcular sulfide level of severity of periodontal disease and BANA test. J. Periodontol. 2001;72:74–78. doi: 10.1902/jop.2001.72.1.74. [DOI] [PubMed] [Google Scholar]
- 11.Rosenberg M., McCulloch C.A. Measurement of oral malodour: current methods and future prospects. J. Periodontol. 1992;63:776–782. doi: 10.1902/jop.1992.63.9.776. [DOI] [PubMed] [Google Scholar]
- 12.Tonzetich J. Direct gas chromatographic analysis of sulphur compounds in mouth air in man. Arch. Oral Biol. 1971;16:587–597. doi: 10.1016/0003-9969(71)90062-8. [DOI] [PubMed] [Google Scholar]
- 13.Barnes V.M., Teles R., Trivedi H.M., Devizio W., Xu T., Mitchell M.W., Milburn M.V., Guo L. Acceleration of purine degradation by periodontal diseases. J. Dent. Res. 2009;88(9):851–855. doi: 10.1177/0022034509341967. [DOI] [PubMed] [Google Scholar]
- 14.Barnes V.M., Ciancio S.G., Shibly O., Xu T., Devizio W., Trivedi H.M., Guo L., Jönsson T.J. Metabolomics reveals elevated macromolecular degradation in periodontal disease. J. Dent. Res. 2011;90(11):1293–1297. doi: 10.1177/0022034511416240. [DOI] [PubMed] [Google Scholar]
- 15.Marchesan J.T., Morelli T., Moss K., Barros S.P., Ward M., Jenkins W., Aspiras M.B., Offenbacher S. Association of Synergistetes and Cyclodipeptides with Periodontitis. J. Dent. Res. 2015;94(10):1425–1431. doi: 10.1177/0022034515594779. [DOI] [PubMed] [Google Scholar]
- 16.Bregy L., Müggler A.R., Martinez-Lozano Sinues P., Garcia-Gomez D., Suter Y., Belibasakis G.N., Kohler M., Schmidlin P.R., Zenobi R. Differentiation of oral bacteria in in vitro cultures and human saliva by secondary electrospray ionization - mass spectrometry. Scientific Rep. 2015;5:15163. doi: 10.1038/srep15163. [DOI] [PMC free article] [PubMed] [Google Scholar]
- 17.Bean H.D., Zhu J., Hill J.E. Characterizing bacterial volatiles using secondary electrospray ionization mass spectrometry (SESI-MS. J. Visual Exper. 2011;52:2664. doi: 10.3791/2664. [DOI] [PMC free article] [PubMed] [Google Scholar]
- 18.Zhu J., Hill J.E. Detection of Escherichia coli via VOC profiling using secondary electrospray ionization-mass spectrometry (SESI-MS) Food Microbiol. 2013;34:412–417. doi: 10.1016/j.fm.2012.12.008. [DOI] [PMC free article] [PubMed] [Google Scholar]
- 19.S. Fuerstenau, P. Kiselev, J.B. Fenn, ESI-MS in the analysis of trace species in gases, in: Proceedings of the 47th ASMS Conference on Mass Spectrometry Allied Topics; Dallas, TX, 1999.
- 20.Martinez-Lozano Sinues P., de la Mora J.F.F.J. Direct analysis of fatty acid vapors in breath by electrospray ionization and atmospheric pressure ionization-mass spectrometry. Anal. Chem. 2008;80:8210–8215. doi: 10.1021/ac801185e. [DOI] [PubMed] [Google Scholar]
- 21.Wolf H., Bolivar I. Mikrobiologische Diagnostik in der Parodontologie. Eine therapie-unterstützende Massnahme. Swiss Dent. 2002;23:11–18. [Google Scholar]
- 22.Gaisl T., Bregy L., Stebler N., Gaugg M.T., Bruderer T., García-Gómez D., Moeller A., Singer F., Schwarz E.I., Benden C., Sinues P.M., Zenobi R., Kohler M. Real-time exhaled breath analysis in patients with cystic fibrosis and controls. J. Breath Res. 2018;12:3. doi: 10.1088/1752-7163/aab7fd. [DOI] [PubMed] [Google Scholar]
- 23.Morita M., Wang H.L. Association between oral malodor and adult periodontitis: a review. J. Clin. Periodontol. 2001;28(9):813–819. doi: 10.1034/j.1600-051x.2001.028009813.x. [DOI] [PubMed] [Google Scholar]
- 24.Kostelc J.G., Zelson P.R., Preti G., Tonzetich J. Quantitative differences in volatiles from healthy mouths and mouths with periodontitis. Clin. Chem. 1981;27:842–845. [PubMed] [Google Scholar]
- 25.Kostelc J.G., Preti G., Zelson P.R., Stoller N.H., Tonzetich J. Salivary volatiles as indicators of periodontitis. J. Periodont. Res. 1998;15:185–192. doi: 10.1111/j.1600-0765.1980.tb00273.x. [DOI] [PubMed] [Google Scholar]
- 26.Bollen C., Beikler T. Halitosis: the multidisciplinary approach. Int. J. Oral Sci. 2012;4(2):55–63. doi: 10.1038/ijos.2012.39. [DOI] [PMC free article] [PubMed] [Google Scholar]
- 27.Anderson A.J., Dawes E.A. Occurrence, metabolism, metabolic role, and industrial uses of bacterial polyhydroxyalkanoates. Microbiol. Rev. 1990;54. doi: 10.1128/mr.54.4.450-472.1990. [DOI] [PMC free article] [PubMed] [Google Scholar]
- 28.Giri D.K., Kundapur P., Bhat K.M., Maharjan I.K. Betel nut chewing associated with severe periodontitis. Health Ren. 2015;12:57–60. [Google Scholar]
- 29.Chen Y.J., Lee S.S., Huang F.M., Yu H.C., Tsai C.C., Chang Y.C. Effects of arecoline on cell growth, migration, and differentiation in cementoblasts. J. Dent. Sci. 2015;10:388–393. [Google Scholar]
- 30.Thangjam G.S., Kondaiah P. Regulation of oxidative-stress responsive genes by arecoline in human keratinocytes. J. Periodont. Res. 2009;44:673–682. doi: 10.1111/j.1600-0765.2008.01176.x. [DOI] [PubMed] [Google Scholar]
- 31.Belibasakis G.N., Schmidlin P.R., Sahrmann P. Molecular microbiological evaluation of subgingival biofilm sampling by paper point and curette. Acta Pathologica, Microbiologica et Immunologica. 2014;122:347–352. doi: 10.1111/apm.12151. [DOI] [PubMed] [Google Scholar]
- 32.Feres M.M.A.C., Bernal F., Matarazzo M., Faveri P.M., Duarte L.C. Figueiredo Subgingival bacterial recolonization after scaling and rootplaning in smokers with chronic periodontitis. Austral. Dent. J. 2015;60:225–232. doi: 10.1111/adj.12225. [DOI] [PubMed] [Google Scholar]
- 33.Riep B., Edesi-Neuß L., Claessen F., Skarabis H., Ehmke B., Flemmig T.F., Bernimoulin J.P., Gobel U.B., Moter A. Are Putative Periodontal Pathogens Reliable Diagnostic Markers? J. Clin. Microbiol. 2009;47:1705–1711. doi: 10.1128/JCM.01387-08. [DOI] [PMC free article] [PubMed] [Google Scholar]
- 34.Albandar J.M., Brown L.J., Löe H. Putative Periodontal Pathogens in Subgingival Plaque of Young Adults With and Without Early-Onset Periodontitis. J. Periodontol. 2012;68:973–98136. doi: 10.1902/jop.1997.68.10.973. [DOI] [PubMed] [Google Scholar]
- 35.Hajishengallis G., Lamont R.J. Beyond the red complex and into more complexity: the polymicrobial synergy and dysbiosis (PSD) model or periodontal disease etiology. Molec. Oral. Microbiol. 2012;27:409–419. doi: 10.1111/j.2041-1014.2012.00663.x. [DOI] [PMC free article] [PubMed] [Google Scholar]
- 36.Belibasakis G.N., Oztürk V.Ö., Emingil G., Bostanci N. Synergistetes cluster A in saliva is associated with periodontitis. J. Periodontal Res. 2013;48(6):727–732. doi: 10.1111/jre.12061. [DOI] [PubMed] [Google Scholar]
- 37.Worely B., Powers R. Multivariate analysis in metabolomics. Curr. Metabolom. 2013;1(1):92–107. doi: 10.2174/2213235X11301010092. [DOI] [PMC free article] [PubMed] [Google Scholar]
- 38.Mombelli A. Microbial colonization of the periodontal pocket and its significance for periodontal therapy. Periodontol. 2000;2018(76):85–96. doi: 10.1111/prd.12147. [DOI] [PubMed] [Google Scholar]
- 39.Matarazzo F., Figueiredo L.C., Cruz S.E., Faveri M., Feres M. Clinical and microbiological benefits of systemic metronidazole and amoxicillin in the treatment of smokers with chronic periodontitis: a randomized placebo-controlled study. J. Clin. Periodontol. 2008;35:885–896. doi: 10.1111/j.1600-051X.2008.01304.x. [DOI] [PubMed] [Google Scholar]
- 40.Bizzarro S., Laine M.L., Buijs M.J., Brandt B.W., Crielaard W., Loos B.G., Zaura E. Microbial profiles at baseline and not the use of antibiotics determine the clinical outcome of the treatment of chronic periodontitis. Sci. Rep. 2016;6:20205. doi: 10.1038/srep20205. [DOI] [PMC free article] [PubMed] [Google Scholar]
- 41.Kawada M., Yoshida A., Suzuki N., Nakano Y., Saito T., Oho T., Koga T. Prevalence of Porphyromonas gingivalis in relation to periodontal status assessed by real-time PCR. Molec. Oral. Microbiol. 2004;19:289–292. doi: 10.1111/j.1399-302X.2004.00154.x. [DOI] [PubMed] [Google Scholar]
- 42.Winkel E.G., Van Winkelhoff A.J., Timmerman M.F., Van der Velden U., Van der Weijden G.A. Amoxicillin plus metronidazole in the treatment of adult periodontitis patients. J. Clin. Periodontol. 2001;28:296–305. doi: 10.1034/j.1600-051x.2001.028004296.x. [DOI] [PubMed] [Google Scholar]
Associated Data
This section collects any data citations, data availability statements, or supplementary materials included in this article.