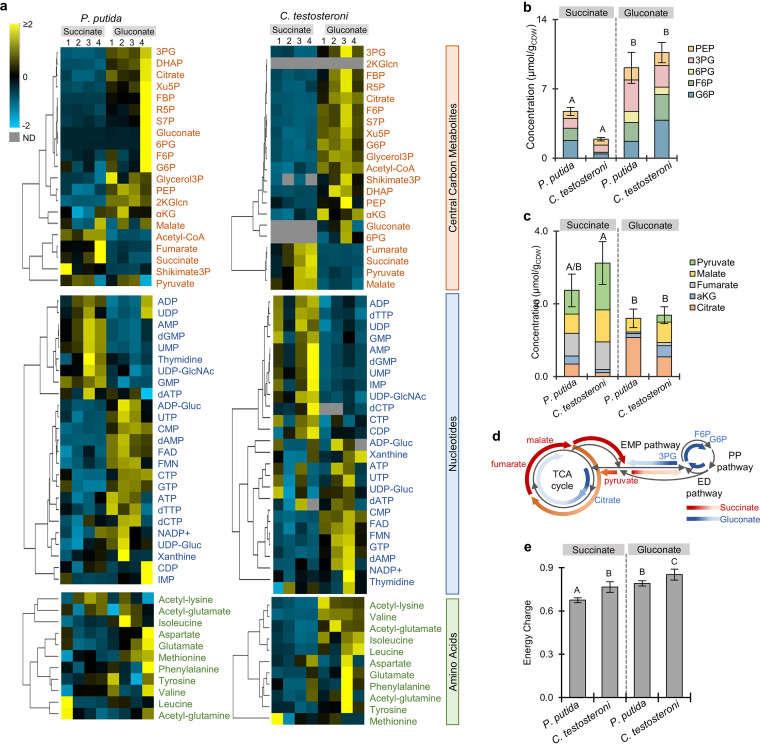
FIG 2.
Global metabolome remodeling during growth on a gluconeogenic substrate (succinate) versus a glycolytic substrate (gluconate). (a) Unsupervised hierarchical clustering for each species (P. putida KT2440 or C. testosteroni KF-1, four biological replicates denoted as 1 through 4) conducted across intracellular metabolite pools divided into central carbon metabolites, nucleotides, and amino acids. Relative metabolite concentrations are normalized to have a mean equal to 0 and a standard deviation equal to 1. (b) Intracellular pool (μmol/g) of phosphorylated intermediate pools of PEP, 3PG, 6PG, F6P, and G6P. Data are expressed as the mean ± the cumulative standard deviation of four biological replicates. (c) Intracellular pool (μmol/g) of organic acids—pyruvate, malate, fumarate, αKG, and citrate. Data are expressed as the mean ± the cumulative standard deviation of four biological replicates. (d) Schematic summary of proposed metabolic routing of substrate carbons based on relative metabolite pools in in succinate-grown cells (red) versus gluconate-grown cells (blue). (e) Energy charge calculated from the pools of ATP, ADP, and AMP. Data are expressed as the mean ± the cumulative standard deviation of four biological replicates. For panels b, c, and e, statistically significant differences (P value less than 0.05) are denoted by a change in letter. The significance was determined using one-way ANOVA followed by Tukey HSD post hoc tests. Abbreviations for central carbon the metabolites are as described in Fig. 1.

