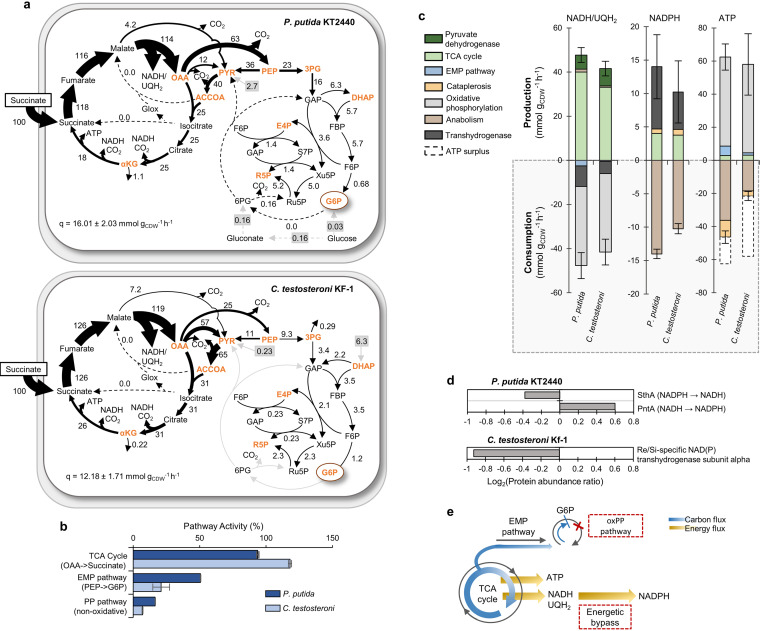
FIG 4.
13C-metabolic flux analysis of carbon and energy flux partitioning in the gluconeogenic metabolic regime. (a) Metabolic fluxes (expressed in percentage relative to succinate uptake rate [q]) in succinate-grown P. putida (top) and C. testosteroni (bottom). Metabolites highlighted in orange represent biomass precursors. Gray boxes and arrows represent unlabeled carbon influx from the extracellular matrix. Abbreviations for the metabolites in panel a are described in Fig. 1. (b) Key metabolic pathway activities, shown as percentage (%) of succinate uptake, in P. putida KT2440 (dark blue) and C. testosteroni KF-1 (light blue). (c) Absolute production and consumption rates (mmol gCDW−1 h−1) of NADH/UQH2, NADPH, and ATP determined from the cellular fluxes and species-specific biomass stoichiometry. Transhydrogenase reactions of NADH to NADPH were invoked to supply the additional NADPH needed for anabolism. ATP production from NADH/UQH2 was calculated using a phosphate to oxygen (P/O) ratio of 1.5. Error bars represent the cumulative standard deviation across all pathways contributing to either the production or consumption rate. A breakdown of individual reactions error can be found in Data Set S1. (d) Protein abundances of transhydrogenase enzymes as a log2 ratio of succinate-grown cells to gluconate-grown cells. (e) Schematic overview of gluconeogenic carbon fluxes (in blue), including the shutdown of the oxidative pentose phosphate (oxPP) pathway in both species, and the resulting energy fluxes (in dark yellow), including the energetic bypass such as through transhydrogenase reactions, to favor the fast-growth gluconeogenic growth phenotype.

