Abstract
The recent outbreak of novel coronavirus disease (COVID-19) has resulted in healthcare crises across the globe. Moreover, the persistent and prolonged complications of post-COVID-19 or long COVID are also putting extreme pressure on hospital authorities due to the constrained healthcare resources. Out of many long-lasting post-COVID-19 complications, heart disease has been realized as the most common among COVID-19 survivors. The motivation behind this research is the limited availability of the post-COVID-19 dataset. In the current research, data related to post-COVID complications are collected by personally contacting the previously infected COVID-19 patients. The dataset is preprocessed to deal with missing values followed by oversampling to generate numerous instances, and model training. A binary classifier based on a stacking ensemble is modeled with deep neural networks for the prediction of heart diseases, post-COVID-19 infection. The proposed model is validated against other baseline techniques, such as decision trees, random forest, support vector machines, and artificial neural networks. Results show that the proposed technique outperforms other baseline techniques and achieves the highest accuracy of 93.23%. Moreover, the results of specificity (95.74%), precision (95.24%), and recall (92.05%) also prove the utility of the adopted approach in comparison to other techniques for the prediction of heart diseases.
Keywords: Post-COVID-19, Stacking ensemble, K-fold cross-validation, Machine learning
Introduction
Coronavirus (COVID-19) is a contagious disease that predominantly affects the human respiratory system. COVID-19 was first originated in the Wuhan city of China at the end of 2019 and is triggered by Severe Acute Respiratory Syndrome (SARS-CoV) [1]. The virus primarily transmits by direct person-to-person contact through the secretion of respiratory droplets. Research reports claim that it spreads much faster than its detection [2]. COVID-19 infects people of almost all age groups. However, unvaccinated people and people with weakened immune systems are more susceptible to this virus. People infected with COVID-19 experience various symptoms, such as shortness of breath, fever, cough, fatigue, dizziness, loss of taste and smell. However, in some cases, COVID-19 is asymptomatic.
COVID-19 has been rapidly spreading across all the countries. According to the World Health Organization (WHO), as of August 28, 2021, there are 214,468,601 confirmed COVID-19 cases, with 4,470,969 mortalities globally [3]. Every country opts for different mechanisms to deal with this pandemic era starting from home isolation, partial or complete lockdown, restriction on the social gathering, temporary shutdown of transportation, encouraging the use of masks, and sanitization. India has also faced the worse effects of coronavirus outbreaks. Initially, in early 2020, cases are reported from those who are travelling back from overseas. However, at the end of August 2021, India has already witnessed two tremendous COVID-19 waves with 32,603,188 cases have been reported, including 436,861 deaths [4]. The Jammu and Kashmir (J&K), a Union Territory (UT) of India, has contributed 0.35% of total active cases with 4405 deaths. These statistics show how COVID-19 is alarmingly rising in J&K. Moreover, the mortality rate and the number of COVID-19 active cases are expected to rise with the inception of the 3rd wave and lesser number of the fully vaccinated population.
Most of the patients who suffer from COVID-19 recover within an incubation period of 10–15 days after the virus attack. However, some patients with severe COVID-19 infection take even up to 45 days to completely recover from this fatal disease. Such patients have a high probability of developing post-COVID syndrome or long COVID [5]. Such syndrome may affect the lungs, brain, blood vessels, skin, nerves, kidneys, and heart, which increases the risk of long-term health complications [6]. Some of the leading causes of developing long-covid include lack of response from the immune system, reinfection, post-traumatic stress, and prolonged hospitalization.
Challenges posed by COVID-19 result in the growth of artificial intelligence (AI)-based solutions on large scale. It has changed the current role of AI and opened new opportunities for the future to explore more. Consequently, a large number of academic research is dedicated to the use of AI to handle COVID-19 issues. In [7], Adadi et al. provide a systemic study on all the research contributions made within the first year of pandemic and found that deep neural network (DNN) is a majorly used AI solution. Another study [8], presents the contributions of AI in several areas related to the contribution of AI in several areas related to COVID-19 and conclude that lack of verified data is a prominent drawback that hampered the efficient utilization of AI. Flexibility to collect and analysis of public health data is a major challenge as data play a key role to decide AI tool will work efficiently or not. Authors in [8] divided the AI application into corona case tracking, prediction, diagnosis and vaccine control. In [9], Karthik et al. developed an image-based COVID-19 detection technique using classification and segmentation with a review of past work in the current literature.
The unforeseeable COVID-19 outbreak has raised several unsolved questions that need to be addressed. Machine learning (ML), a subset of AI, is a key enabler that can be used to recognize the correlated or hidden patterns from training data [10]. In the pre-COVID era, the use of ML has been found in several areas, such as medical diagnosis, image processing, traffic prediction, speech recognition, stock market analysis, fraud detection, and so on. Currently, several works are underway to design COVID-19 diagnosis and complication monitoring systems using ML approaches [11]. Machine learning-based chest X-ray and CT image analysis have been promoted for early screening of COVID-19 [12]. Although these results are formed based on clinical information which does not reflect pure accuracy on global evaluation. A highly sensitive and fast deep learning-based system is developed to utilize thoracic CT images for early detection, quantification, and tracking of COVID-19 in [13]. This study includes 157 patients’ information from the US and China. Similar work is found in [14] where a neural network-based abnormal respiratory pattern classifier is designed for infected people screening. In [15], the author collects 1427 X-ray images and uses transfer learning with the CNN model for automatic diagnosis of COVID-19 using image analysis. MobileNet architecture is used over the ImageNet dataset and achieves 96.97% accuracy. Another work on chest X-ray images using orthogonal moment feature-selection technique with KNN classifier is found in [16]. Authors in [17–20] proposed similar image-based COVID-19 detection approaches using AI and ML.
However, these works are majorly related to early disease detection using patient health information. But the challenges with the pandemic are not limited to early diagnosis of the virus [21]. Patients recovered from coronavirus are also facing several complications. Defeating COVID-19 is just the first step in the path of the recovery journey. Although very little is known about the post-COVID-19 effects which make post-recovery study more challenging. Studies found the long- and short-term effects on recovered patients where the patients who are on ventilation possess a high risk of long-term adverse effects [22]. Associated risk varies from cardiac issues, kidney injury, lung disease to stroke. However, COVID-19 survivors are likely to have a high risk of heart disease due to high blood pressure, diabetes, and cardiovascular diseases. The early results coming from China show that 1 out of 5 patients is suffering from heart-related issues after COVID-19 recovery, even in the patients who do not have any severe breathing problems.
In this study, we gathered data on recovered patients with long-COVID symptoms and used a machine learning approach based on stacking ensemble to predict the risk of heart disease, specifically cardiovascular diseases, which refers to narrowed or blocked blood vessels, resulting in heart attacks, chest pain, or stroke, as well as the long-term negative effects of the coronavirus outbreak on recovered patients. To our knowledge, this is the first study that uses a machine learning algorithm to predict post-COVID-19 illness.
Contribution
The key contributions of this paper are as follows:
Assessment of post-COVID-19 symptoms to predict the risk of long-lasting complications.
A stacking ensemble of deep neural networks is presented for the early prediction of heart diseases in COVID-19 survivors.
Training of the proposed model using tenfold cross-validation along with hyper-parameter tuning.
Performance comparison of the proposed approach with other baseline algorithms in terms of various classification metrics.
Article Organization
The rest of the article is organized into different sections: Section 2 gives the details of the study area and collected data. Section 3 describes various post-COVID-19 complications and their assessment. Next, Sect. 4 describes the proposed method for the evaluation of risk associated with post-COVID diseases. In Sect. 4, the data collection source centered on COVID-19 is described. Section 5 provides details of the simulation environment and discusses various performance evaluation metrics. In Sect. 6, results are discussed along with the analysis. Finally, the proposed work is summarized in Sect. 7 with some directions for future work.
Materials
Study Area
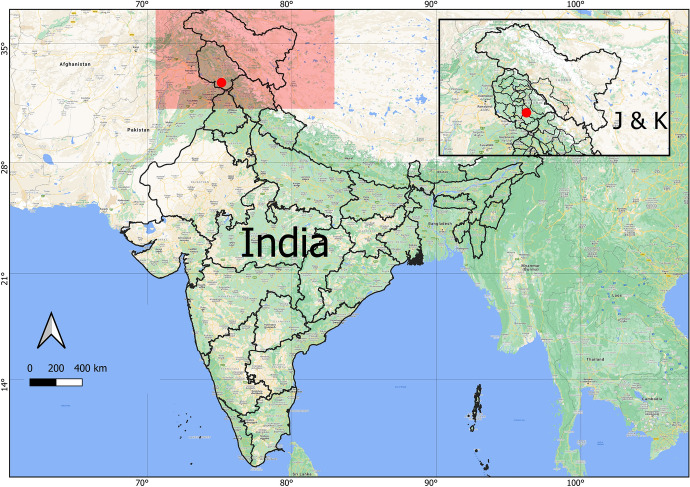
Jammu is one of the most popular districts in the Jammu division of Union Territory of Jammu and Kashmir. The district covers a total geographical area of 222,236 Sq. Kms. comprising 7 sub-divisions, 21 tehsils, and 20 rural development blocks with a total population of more than 15 Lacs as per the census of the year 2011. The area is situated in the Shivalik Hills and geographically located at 32.7266N 74.8570E and has an average elevation of 980 feet as shown in Fig. 1.
Fig. 1.
Study area
Data Collection
To collect our post-COVID-19 manifestation data, we contact recovered patients of the Jammu district. In total, we collect the information from 180 patients which include both males and females ranging from young to old. Patient’s medical records and test results are collected; however, the demographic and symptoms-related information is gathered by conducting a smartphone questionnaire where patients are contacted through phone and asked to answer the related questions. These questions are divided into several following parts. The first part collects patient information which includes age, gender, weight, height, smoking status, pregnancy status, diabetes or other diseases, and vaccination. The second part of the questionnaire includes information regarding COVID-19 which consists of the severity of disease that can be mild = 1, moderate = 2 or severe = 3 other than that this part includes information regarding days in recovery, symptoms during disease, such as cough, fever, cold, tiredness, chest pain, throat pain, and status of hospitalization. The last part elaborates different manifestations after COVID-19 recovery. Collected data are in form of quantitative and categorical where parameters, such as age, weight, and height, can have continuous value. Few categorical data are under the nominal category where responses are recorded in form of “yes” and “no” or “male” and “female” whereas the severity of COVID-19 and post-COVID-19 symptoms are labelled as mild, moderate and severe with, respective, weightage as 1, 2 and 3. In this study, we omitted those patients who have any type of communication impairments or severe baseline memory loss problems. The younger subject considers for data collection is 18 years old at the time of illness.
Post-COVID-19 Symptoms and Assessment
For each survivor, defeating the COVID-19 virus is just the first step towards gaining better health. Recovering severe COVID-19 followed by the possibility of several other diseases which may lead to attacks or organ failure. Most of the patients who are successfully recovered from COVID-19 have reported different symptoms that are non-identical from COVID-19 symptoms noted earlier. Many long-term adverse effects were found in patients after recovering from Severe Acute Respiratory Syndrome (SARS) which is first found in South East Asia in early 2003 [23]. Those manifestations include musculoskeletal pain, weakness, fatigue, depression, and sleep problem. Studies found that the outlined symptoms found in recovered patients are similar to chronic fatigue fibromyalgia [23]. Similarly, in the case of COVID-19, the same post-recovery symptoms have been found which include fatigue, dementia, dyspnea, myalgia, cough, chest pain, continuous headache, hair loss, memory loss, and sleep disorder. In addition, several mental health-related issues, such as anxiety, depression, and mood swings, are very commonly reported by recovered patients. However, these manifestations vary from one person to another which can be due to immune dysregulation. Due to the similarity with past viral diseases, such as SARS, previous findings can help in the development of the various approach to treating the COVID-19 in a better way as several long-term effects of the current pandemic are still uncovered.
In the current study, we aim to analyze post-COVID-19 manifestations to evaluate different trivial and critical conditions, also see how these symptoms have long-term adverse effects in form of origination of some deadly diseases found in COVID-19 recovered patients.
Collected data of involved subjects are illustrated in tabular form with several parameters where Table 1 enlists the personal and demographic data of patients, Table 2 shows the impact and statistics of COVID-19 and at last Table 3 expressed the post-COVID-19 manifestations. On analyzing the post-COVID symptoms, this study found that patients who have mild-to-moderate acute syndrome and were not require hospital or nurse monitoring, are also reporting long-term post-recovery symptoms.
Table 1.
Personal details of COVID-19 patients
| Personal details | |
|---|---|
| Parameters | Percentage |
| Age | |
| 15–25 y | 29 ( 16.11%) |
| 25–45 y | 108(60%) |
| > 45 y | 43 (23.88%) |
| Gender | |
| Male | 78 (43.34%) |
| Female | 102 ( 56.67%) |
| Body mass index (BMI) | |
| < 18.5 (underweight) | 23 ( 12. 78%) |
| 18.5–25 (normal) | 89 ( 49.44%) |
| 25–30 (overweight) | 47 (26.11%) |
| > 30 (obese) | 21 (11.67%) |
| Pregnancy | |
| Pregnant | 2.30% |
| Non-pregnant | 97.70% |
| Smoking | |
| Ex-smoker | 146 (81.11%) |
| Smoker | 10 ( 5.55%) |
| Non-smoker | 22 ( 12.22%) |
| Diabetes | |
| Diabetic | 14 (7.78%) |
| Non-diabetic | 164 (91.11%) |
| Other disease | |
| Hypertension | 5.30% |
| Asthma | 4.80% |
| Arthritis | 2.15% |
| Cardiac disease | 1.58% |
| None | 75.85% |
| Vaccination | |
| Yes | 1.11% |
| No | 99.98% |
Table 2.
Details of COVID-19 statistics
| COVID-19 statistics | |
|---|---|
| Parameters | Percentage |
| Severity of disease | |
| Mild | 78.33% |
| Moderate | 13.33% |
| Severe | 8.34% |
| Recovery days | |
| < 7 days | 22 (12.22%) |
| 7–15 days | 97(53.89%) |
| > 15 days | 61 (33.89%) |
| Hospital admission | |
| Yes | 32.22% |
| No | 61.67% |
| Symptoms during disease | |
| Fever | 79.44% |
| Cough | 64.44% |
| Anorexia | 46.11% |
| Dyspnea | 32.78% |
| Tiredness | 11.11% |
| Chest pain | 5.55% |
| Headache | 7.22% |
| Vomiting | 2.22% |
Table 3.
Details of post COVID-19 symptoms
| Post COVID-19 symptoms | |
|---|---|
| Parameters | Percentage |
| Symptoms | |
| Fatigue | 72.77% |
| Cough | 25.55% |
| Dyspnea | 41.77% |
| Myalgia | 53.88% |
| Anxiety | 4.60% |
| Chest pain | 2.33% |
| Depression | 27.45% |
| Dementia | 28.60% |
| Headache | 29.45% |
| Hair loss | 20% |
| Sleep disorder | 34.44% |
| Blurred vision | 19.45% |
| Hospital admission after COVID-19 recovery | |
| Yes | 11.67% |
| No | 88.33% |
| Medication for post COVID-19 symptoms | |
| Yes | 65.55% |
| No | 34.45% |
The conducted study involves 180 COVID-19 recovered patients, where 29 subjects are from age group 15–25 years, 108 (60%) belongs to range 25–45 years that include maximum patients, and 43 rest patients are older than 45 years. Out of all the involved patients, 78 of them are males where 102 are females. Body Mass Index (BMI) is calculated by evaluating the patient’s weight and height which is categorised into four category: underweight (< 18.5), normal (18.5–25), overweight (25–30) and obese (> 30). Then several health conditions are considered, such as diabetes, pregnancy status, and other diseases. Out of all, only 5.55% of males are found smokers, whereas all the female participants are non-smokers. 75.85% of patients do not have any known history of other diseases but 7.78 % are suffering from diabetes.
The study divides COVID-19 severity into three categories where mild cover the cases who were not admitted to hospitals and recovered from the disease by isolating themselves in the home. The second category considers cases those were in hospitals and received any type of oxygen therapy whereas the last category severe includes cases that needed intensive care units for treatment. By analyzing the post-COVID-19 manifestation, it has been found that a large number of the recovered patients are suffering from fatigue. Other major symptoms found in long-COVID patients are myalgia, dyspnea, depression, headache, sleep disorder, and dementia.
Disease Risk Prediction
Patients recovering from COVID-19 are still facing adverse health issues and are vulnerable to long-lasting diseases. However, understanding the detailed long-term effects is not possible at this stage due to the lack of data and several unexplored behaviors of coronavirus. Some common symptoms are found persistently in recovered patients which can make them suffer from severe diseases in the future, such as heart disease, lungs-related diseases, mental problems, organ failure, and so on. The severity of these diseases is directly connected to the severity of post-COVID complications such as a recovered patient with high-intensity post-COVID manifestation is in more danger as compared to the patients with mild symptoms.
The study found that heart disease is one of the most commonly found diseases in COVID-19-recovered patients [24]. Several health parameters affect the severity of heart complications which include high blood pressure, diabetes, cholesterol fluctuation, abnormal pulse rate, and so on. Timely detection of heart disease can help a patient by providing a proper counter measurement for recovery. In this paper, we have utilized several ML approaches for the early prediction of heart disease risk. Therefore, a dataset is prepared by summarizing several related parameters as given in Table 4 from the collected information.
Table 4.
Heart disease dataset parameters
| Parameter | Value |
|---|---|
| Age | In years |
| Gender | Male/female |
| Chest pain | Typical angina/atypical angina/non-anginal pain/asymptotic |
| Resting blood pressure | in mm Hg |
| Serum cholesterol | In mg/dl |
| Fasting blood sugar | > 120 mg/dl |
| Resting electrocardiographic | Normal/having ST-T wave abnormality/left ventricular hypertrophy |
| Maximum heart achieved | In bpm |
| Exercise induced angina | Yes/no |
| ST depression | Depression |
| Peak exercise ST segment slope | Upsloping/flat/downsloping |
| Number of major vessels fluoroscopy | 0–3 |
| Thalassemia | Normal/fixed defect/reversible defect |
Data Preprocessing
Data preprocessing is one of the most imperative tasks before performing any data analytics operations. The dataset used for training the model may contain noisy or inconsistent data. Moreover, the dataset may also contain missing data values. Therefore, data preprocessing is performed as an essential measure to deal with such anomalies. The missing values in the dataset are handled using a well-known simple linear regression imputation approach [25]. The technique takes advantage of the correlation matrix to determine the correlation among attribute values and then uses the existing attribute values in a dataset to make predictions about missing values. Furthermore, the data are also normalized in the range between 0 and 1 using the min–max approach using Eq. 1. The goal of normalization is to change the values of numeric attributes in the dataset to use a common scale, without distorting differences in the ranges of values or losing information. Moreover, this also reduces the complexity and computational cost of machine learning algorithms.
| 1 |
where, D is the original dataset.
is normalized dataset, containing data values in the range [0-1].
and represents the minimum and maximum data values in the dataset.
and represents the value 0 and 1 respectively.
The data obtained after applying data preprocessing techniques are clean, consistent, free from noise and are suitable for further analysis.
Methods
Decision Tree
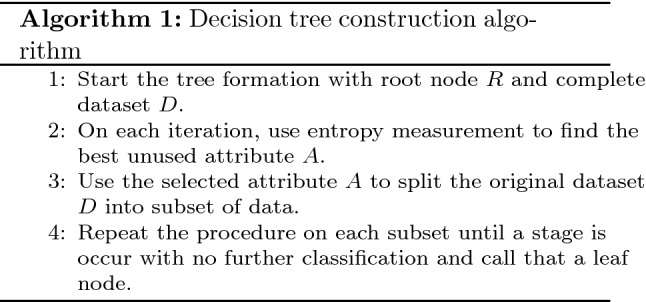
The decision tree comes under the category of supervised learning which is used for both classification and regression. A decision tree is viewed as a hierarchical structure that involves nodes and directed edges [26]. In the decision tree, classification starts from the root node, where each level constitutes a series of questions. Each time when a record of the dataset answers a question, it will be sent to the next level for follow-up questions. Each leaf node in the tree structure is associated with a class label. Though a decision tree is easy and can deal with high dimensional data efficiently; however, it possesses great instability. A small change in data can cause a major change in the entire structure. One another drawback with the decision tree is the high training time [27]. The decision tree is constructed using the concept of entropy and information gain as attribute selection measures. At each level, the attribute with the lowest entropy is selected for data splitting. Whenever a branch reaches a zero entropy, then it is marked as a leaf node otherwise that branches split further. The complete procedure for decision tree construction is given in Algorithm 1. Mathematically, entropy for different attributes is calculated as follows:
| 2 |
Random Forest
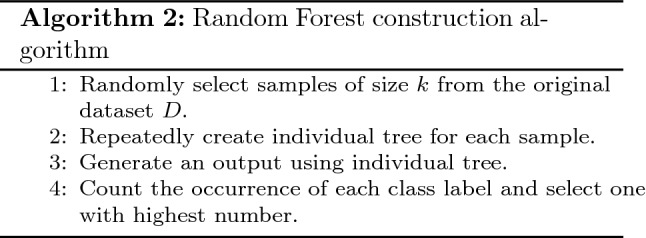
Random forest is also a supervised machine learning algorithm where the decision tree works as the building block in the formation of the forest. Random forest is designed by an ensemble collection of individual decision trees [28]. It works on the majority vote concept where each decision tree individually predicts the class for observation and the class with the highest number of votes becomes the final classified label. To overcome the disadvantage of instability and data sensitivity of decision tree, random forest uses this as an advantage and train each tree on the random sample with replacement. This process is also known as bagging. Another difference between decision trees and the random forest is feature randomness. The decision tree considers each feature while constructing the hierarchical structure, in contrast, an individual tree in the random forest is trained over a subset of random features. Workflow of random forest is given in Algorithm 2.
Support Vector Machine
Support Vector Machine (SVM) is a powerful supervised machine learning algorithm that is used for both classification and regression problems. SVM was first introduced as a binary classifier that separates the data into two classes by obtaining an optimal hyperplane that maximizes the support vector margin [29]. The hyperplane is drawn to define the decision boundary. The optimal hyperplane is obtained by designing a quadratic optimization problem as follows:
| 3 |
Here w represents the weight vector, b is bias and x represents the support vectors. Support vectors define the data points that are nearer to the hyperplane.
Artificial Neural Networks
The procedure of information processing in the human nervous system inspires the construction of an Artificial Neural Network (ANN) or multilayer perceptron (MLP). A neural network is defined as layers of interconnected neurons where neurons can be any mathematical function that collects and analyzes information [30]. These layers are classified into three categories: input layer, hidden layers, and output layer. The input layer defines the input pattern whereas the output layer map the input information into one of the classifications. Weights are assigned to hidden layers to fine-tune the network and minimize the error [31].
For the proposed study, an ANN is designed with 14 nodes at an input layer and 2 at the output layer to check the presence of heart disease risk. A neural network is constructed with 3 hidden layers with a ReLU activation function.
Stacking Ensemble Technique
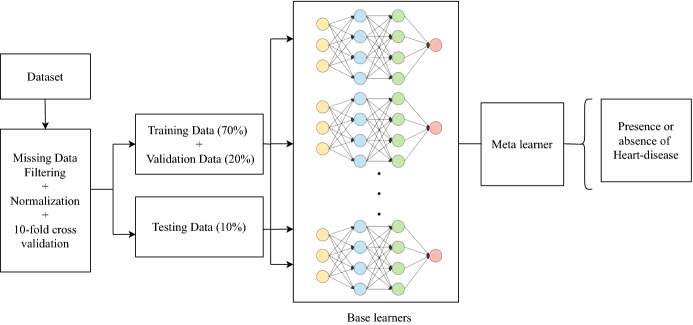
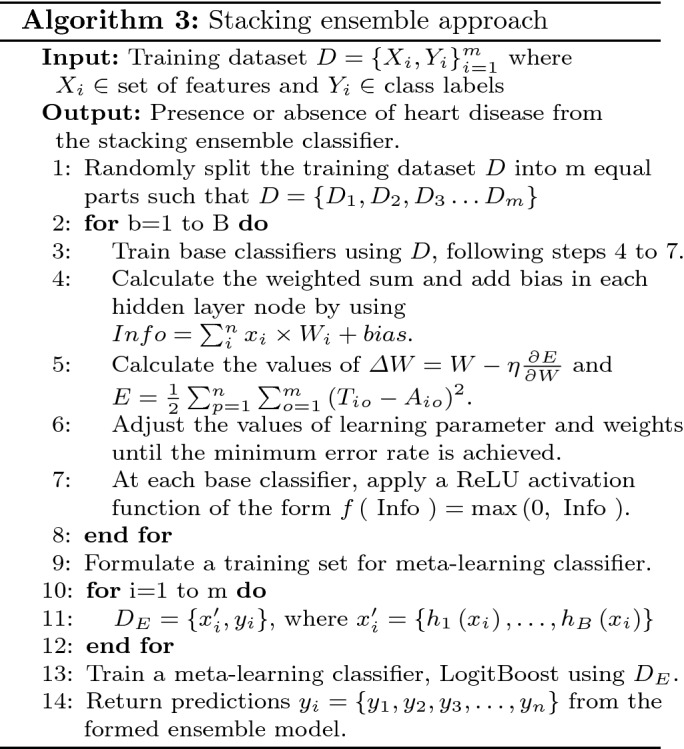
Ensemble learning is a hybrid machine learning technique that takes into consideration the prediction of multiple base models to provide better predictive performance [32]. The base model may use any of the machine learning algorithms. If a homogeneous collection of base learners are employed to create an ensemble, then it is said to be a homogeneous ensemble learning model otherwise, the generated ensemble is said to be heterogeneous. Ensemble learning includes three types of algorithms, namely bagging, boosting, and stacking. Bagging involves independently learning weak learners and results in the average of all the predictions from different machine learning models. In boosting, the base learners are added one after another and outputs the weighted average of the predictions made by the base models. Stacking is another ensemble technique wherein the base classifiers are trained on the same dataset and uses an additional classifier, meta-learner to improve model performance. In the current study, a single-level stacking scheme is used where multiple deep learning models are used in the initial stage. Finally, a LogitBoost is fitted using the predictions of the individual classification models and returns final predictions of the presence or absence of heart disease as given in algorithm 3. Figure 2 depicts the stacking ensemble based on deep neural networks.
Fig. 2.
Stacking ensemble-based deep learning model
Simulation Setup and Performance Analysis
This section deals with the experimental implementation and performance analysis of the proposed model. The proposed model is implemented using different APIs available in the latest version of Python 3.9, and experiments are performed on a system with the following specifications: Intel(R) Core(TM) i7-9050H processor, a primary memory capacity of 8 GB, clock frequency of 2.60 GHz, NVIDIA GeForce GTX 1050 GPU, and 64 bit Windows-10 Operating system.
Training and Testing
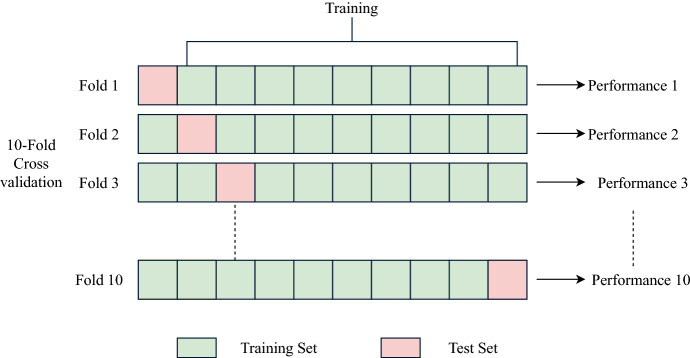
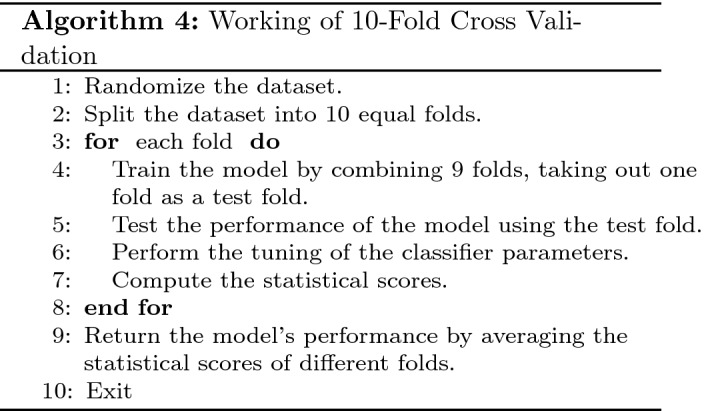
To avoid the overfitting problem, and to validate the model’s performance on a new set of data, K-fold cross-validation scheme is used for model training. K-fold cross-validation is one of the most popular and widely used schemes. It is suitable for small datasets and leads to an unbiased model. In addition, compared with other technologies, this also requires less calculation time. The K-fold cross-validation method randomly splits the dataset into K independent equal size parts and the model is trained and tested K times, keeping 1 out of K as a testing set.
In our current study, the data obtained from the COVID-19 survivors are very small. Therefore, a strategy for oversampling the data is employed. Bootstrapping is known to be one of the most popular among resampling methods that use the replacement policy to generate new samples or resamples out of the already existing samples. Using the bootstrapping technique [33, 34], the data instances of 180 patients are bootstrapped to 4700 records. The bootstrapped dataset is then split into three parts: training set (70%), validation set (20%), and test set (10%), and a tenfold cross-validation scheme is used. In addition, various parameters as given in Table 5 are also adjusted in each iteration to optimize the model performance using the grid search technique [35]. After successful model training, the accuracy obtained in each fold is mathematically calculated using Eq. 4.
| 4 |
where, denotes the accuracy observed for each fold. Algorithm 4 gives the description of model training using tenfold cross-validation with parameters tuning (Fig. 3).
Table 5.
Parameters considered for proposed model
| Parameter | Value |
|---|---|
| Size of input layer | 14 |
| Size of output layer | 2 |
| Number of hidden layers | 3 |
| Learning rate | 0.01 |
| Activation function | ReLU |
| Optimizer | Adam |
| Number of epochs | 100 |
Fig. 3.
Tenfold cross-validation
Performance Evaluation Metrics
The effectiveness of any machine learning model is determined by its ability to give accurate results. To assess the performance of the proposed model, various performance evaluation metrics are used as follows.
- Accuracy: Accuracy measures how often the proposed machine learning model classifies an unseen data instance correctly.
5 - Specificity: Specificity measure the model’s capability to determine the true negatives of each available class.
6 - Recall: Recall measure the model’s capability to determine true positives of each available class.
7 - Precision: Precision defines how close measurements are to each other.
8 - RMSE: Root means square error evaluates the difference between actual and predicted values.
9 - MAE: Mean absolute error measures the absolute variation between actual and predicted values.
10
where, and denotes the predicted and actual values, respectively, and N specifies the number of instances.
In the equation given above, TP, TN, FP, and FN represent True Positives, True negatives, False positives, and False negatives, respectively. True positives and true negatives represent the correct prediction of whether a patient with COVID-19 has heart disease. However, false positives and false negatives determine the number of false predictions made by the machine learning model (Fig. 4).
Fig. 4.
Training results of stacking ensemble using tenfold cross-validation
Results and Discussion
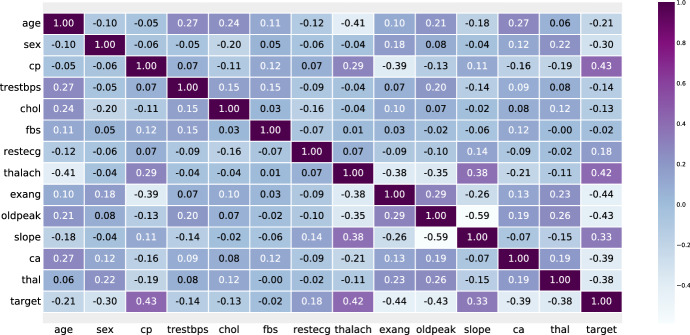
In this section, the results of various experiments conducted in Sect. 5 are discussed. First, the dataset is preprocessed to deal with missing values, and then the min–max method is used to normalize the dataset in the range between 0 and 1. To determine the influence of different data set features on the target variable, a feature selection technique based on correlation is used. A value close to 1 reveals a relatively stronger positive correlation. However, the negative values determine a stronger negative correlation between different attributes. The heat map of the correlation between the attributes of the dataset is shown in the Fig. 5.
Fig. 5.
A heatmap of correlation between different features
The preprocessed dataset is used to train the proposed model under the tenfold cross-validation framework. Moreover, various parameters are tuned using the grid search approach, considering different parameter values to achieve optimized performance. The validation and test results of the tenfold cross-validation approach are given in Table 6. The statistical results are calculated considering various performance evaluation metrics, such as accuracy, specificity, precision, and recall as shown in Fig. 4. From Fig. 4, it is evident that the average training results of accuracy, specificity, precision, and recall within the frame of tenfold cross-validation are 93.11%, 94.81%, 95.14%, and 91.38%, respectively.
Table 6.
Validation and testing results of stacking ensemble with tenfold cross validation
| Training | Testing | |||||||
|---|---|---|---|---|---|---|---|---|
| Fold no. | Accuracy | Specificity | Precision | Recall | Accuracy | Specificity | Precision | Recall |
| 1 | 0.9245 | 0.9318 | 0.9499 | 0.9188 | 0.9566 | 0.9454 | 0.9527 | 0.9227 |
| 2 | 0.9329 | 0.9615 | 0.9556 | 0.9187 | 0.9445 | 0.9834 | 0.9781 | 0.9166 |
| 3 | 0.9147 | 0.9236 | 0.9475 | 0.9085 | 0.9366 | 0.9258 | 0.9471 | 0.9255 |
| 4 | 0.9289 | 0.9456 | 0.9464 | 0.9087 | 0.9482 | 0.9643 | 0.9515 | 0.9128 |
| 5 | 0.9319 | 0.9381 | 0.9545 | 0.9149 | 0.8468 | 0.9509 | 0.9668 | 0.9249 |
| 6 | 0.9347 | 0.9599 | 0.9499 | 0.9187 | 0.9588 | 0.9591 | 0.9454 | 0.9135 |
| 7 | 0.9429 | 0.9583 | 0.9479 | 0.9083 | 0.9399 | 0.9847 | 0.9465 | 0.9109 |
| 8 | 0.9268 | 0.9263 | 0.9599 | 0.9047 | 0.9311 | 0.9457 | 0.9217 | 0.9287 |
| 9 | 0.9289 | 0.9597 | 0.9425 | 0.9176 | 0.9155 | 0.9593 | 0.9484 | 0.9147 |
| 10 | 0.945 | 0.9766 | 0.9597 | 0.9192 | 0.9446 | 0.9557 | 0.9666 | 0.9348 |
| Mean | 0.9311 | 0.9481 | 0.9514 | 0.9138 | 0.9323 | 0.9574 | 0.95248 | 0.9205 |
Comparative Analysis
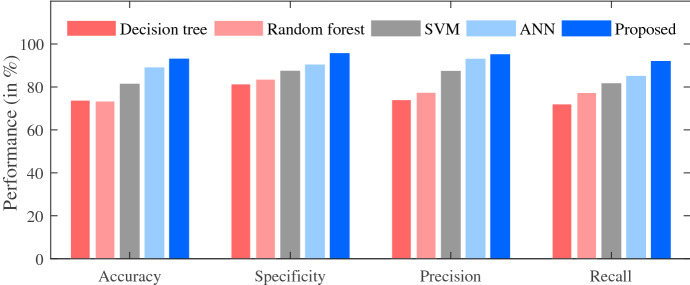
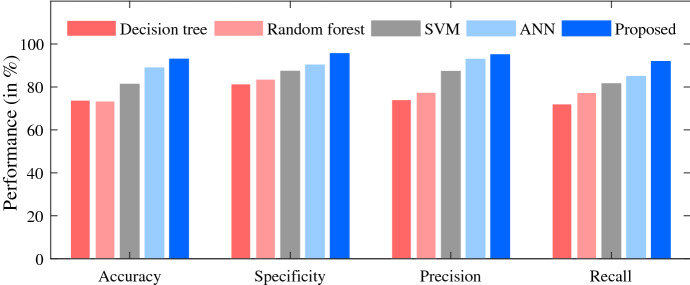
In this section, the performance of the proposed model is compared with the baseline machine learning algorithms to validate our contributions in this literature. First, all baseline machine learning algorithms, namely Decision Tree (DT), Random Forest (RF), Support Vector Machine (SVM), and Artificial Neural Network (ANN) are trained and validated using a tenfold cross-validation approach. The testing results of these techniques are compared with our proposed approach based on different performance evaluation metrics as given in Sect. 5 and the computed results are reported in Table 7. The comparison results of different performance measures obtained by the considered techniques are also presented in the form of a bar plot as depicted in Fig. 6.
Table 7.
Performance comparison of different machine learning algorithms
| Algorithm | Accuracy | Specificity | Precision | Recall | RMSE | MAE |
|---|---|---|---|---|---|---|
| Decision tree | 0.7391 | 0.8149 | 0.7481 | 0.7236 | 0.41 | 0.31 |
| Random forest | 0.7366 | 0.8367 | 0.7761 | 0.7748 | 0.43 | 0.39 |
| SVM | 0.8149 | 0.8755 | 0.8754 | 0.8112 | 0.51 | 0.25 |
| ANN | 0.8988 | 0.9041 | 0.9355 | 0.8565 | 0.4 | 0.27 |
| Proposed | 0.9323 | 0.9574 | 0.9524 | 0.9205 | 0.32 | 0.23 |
Fig. 6.
Comparative analysis
It is evident from the results that the proposed stacking ensemble approach performs significantly well and achieves the highest predictive accuracy of 93.23% in comparison to other baseline algorithms. Moreover, the results of specificity (95.74%), precision (95.24%), and recall (92.05%) prove the utility of the proposed approach compared to DT, RF, SVM, ANN. In addition, the results are also compared based on two statistical techniques namely, Root Mean square error (RMSE) and Mean Absolute Error (MAE). The proposed approach records the lowest value of RMSE (0.32) and MAE (0.23) amongst all the baseline algorithms. Based on this comparative analysis, it can be concluded that the stacking ensemble presented in the current study performs significantly better than the baseline techniques in all aspects.
Conclusion and Future Scope
In this article, a stacking ensemble learning technique based on deep neural networks is proposed for the early prediction of heart disease in COVID-19 survivors. The proposed model is trained using heart-related data collected from COVID-19 survivors under a tenfold cross-validation framework. The proposed model is tested and the performance is compared with different baseline machine learning algorithms. Various performance evaluation metrics, namely accuracy, specificity, precision, and recall, are used for performance measurement. In addition, two statistical measures are evaluated, namely, the root mean square error (RMSE) and the mean absolute error (MAE). The proposed stacking ensemble strategy achieves an accuracy of 93.23% while predicting heart disease. Moreover, the results of specificity (95.74%), precision (95.24%), and recall (92.05%) show the improved performance of the proposed approach in comparison to baseline learning algorithms. Furthermore, minimum values of RMSE (0.32) and MAE (0.23) also prove the robustness of the proposed model. Hence, this framework can be utilized to predict heart diseases from a range of post-COVID-19 symptoms. In the future, various feature selection techniques can be implemented to deal with high-dimensional data. In addition, we plan to implement the proposed strategy in the fog environment to propose novel frameworks for predicting a wide range of post-COVID-19 complications in our future works.
Footnotes
Publisher's Note
Springer Nature remains neutral with regard to jurisdictional claims in published maps and institutional affiliations.
Contributor Information
Aditya Gupta, Email: adityag.cs.19@nitj.ac.in.
Vibha Jain, Email: vibha.jain.cs19@nsut.ac.in.
Amritpal Singh, Email: amritpal.singh203@gmail.com.
References
- 1.Fauci, A.S., Lane, H.C., Redfield, R.R.: COVID-19–navigating the uncharted (2020) [DOI] [PMC free article] [PubMed]
- 2.Velavan TP, Meyer CG. The COVID-19 epidemic. Trop. Med. Int. Health. 2020;25(3):278. doi: 10.1111/tmi.13383. [DOI] [PMC free article] [PubMed] [Google Scholar]
- 3.WHO Coronavirus (COVID-19) Dashboard | WHO Coronavirus (COVID-19) Dashboard With Vaccination Data. https://covid19.who.int/. Accessed:2021-09-04
- 4.#IndiaFightsCorona COVID-19 in India, Vaccination, Dashboard, Corona Virus Tracker | mygov.in. https://www.mygov.in/covid-19. Accessed: 2021-09-04
- 5.Weerahandi H, Hochman KA, Simon E, Blaum C, Chodosh J, Duan E, Garry K, Kahan T, Karmen-Tuohy SL, Karpel HC, et al. Post-discharge health status and symptoms in patients with severe COVID-19. J. Gen. Intern. Med. 2021;36(3):738–745. doi: 10.1007/s11606-020-06338-4. [DOI] [PMC free article] [PubMed] [Google Scholar]
- 6.Kamal M, Abo Omirah M, Hussein A, Saeed H. Assessment and characterisation of post-COVID-19 manifestations. Int. J. Clin. Pract. 2021 doi: 10.1111/IJCP.13746. [DOI] [PMC free article] [PubMed] [Google Scholar]
- 7.Adadi, A., Lahmer, M., Nasiri, S.: Artificial intelligence and covid-19: A systematic umbrella review and roads ahead. J. King Saud Univ. Comput. Inf. Sci. (2021) [DOI] [PMC free article] [PubMed]
- 8.Naudé W. Artificial intelligence vs COVID-19: limitations, constraints and pitfalls. AI Soc. 2020;35(3):761–765. doi: 10.1007/s00146-020-00978-0. [DOI] [PMC free article] [PubMed] [Google Scholar]
- 9.Karthik, R., Menaka, R., Hariharan, M., Kathiresan, G.: Ai for COVID-19 detection from radiographs: Incisive analysis of state of the art techniques, key challenges and future directions. IRBM (2021) [DOI] [PMC free article] [PubMed]
- 10.Surianarayanan, C., Chelliah, P.R.: Leveraging artificial intelligence (ai) capabilities for COVID-19 containment. New Generation Computing pp. 1–25 (2021) [DOI] [PMC free article] [PubMed]
- 11.Punn, N.S., Sonbhadra, S.K., Agarwal, S.: COVID-19 epidemic analysis using machine learning and deep learning algorithms. MedRxiv (2020)
- 12.Bachtiger P, Peters NS, Walsh SL. Machine learning for COVID-19-asking the right questions. Lancet Digital Health. 2020;2(8):e391–e392. doi: 10.1016/S2589-7500(20)30162-X. [DOI] [PMC free article] [PubMed] [Google Scholar]
- 13.Gozes, O., Frid-Adar, M., Greenspan, H., Browning, P.D., Zhang, H., Ji, W., Bernheim, A., Siegel, E.: Rapid ai development cycle for the coronavirus (COVID-19) pandemic: Initial results for automated detection & patient monitoring using deep learning ct image analysis. arXiv preprint arXiv:2003.05037 (2020)
- 14.Wang, Y., Hu, M., Li, Q., Zhang, X.P., Zhai, G., Yao, N.: Abnormal respiratory patterns classifier may contribute to large-scale screening of people infected with COVID-19 in an accurate and unobtrusive manner. arXiv preprint arXiv:2002.05534 (2020)
- 15.Apostolopoulos ID, Mpesiana TA. COVID-19: automatic detection from X-ray images utilizing transfer learning with convolutional neural networks. Phys. Eng. Sci. Med. 2020;43(2):635–640. doi: 10.1007/s13246-020-00865-4. [DOI] [PMC free article] [PubMed] [Google Scholar]
- 16.Elaziz MA, Hosny KM, Salah A, Darwish MM, Lu S, Sahlol AT. New machine learning method for image-based diagnosis of COVID-19. PLoS ONE. 2020;15(6):e0235187. doi: 10.1371/journal.pone.0235187. [DOI] [PMC free article] [PubMed] [Google Scholar]
- 17.Jamshidi M, Lalbakhsh A, Talla J, Peroutka Z, Hadjilooei F, Lalbakhsh P, Jamshidi M, La Spada L, Mirmozafari M, Dehghani M, et al. Artificial intelligence and COVID-19: deep learning approaches for diagnosis and treatment. IEEE Access. 2020;8:109581–109595. doi: 10.1109/ACCESS.2020.3001973. [DOI] [PMC free article] [PubMed] [Google Scholar]
- 18.Kassania SH, Kassanib PH, Wesolowskic MJ, Schneidera KA, Detersa R. Automatic detection of coronavirus disease (COVID-19) in X-ray and ct images: a machine learning based approach. Biocybern. Biomed. Eng. 2021;41(3):867–879. doi: 10.1016/j.bbe.2021.05.013. [DOI] [PMC free article] [PubMed] [Google Scholar]
- 19.Alimadadi, A., Aryal, S., Manandhar, I., Munroe, P.B., Joe, B., Cheng, X.: Artificial intelligence and machine learning to fight COVID-19 (2020) [DOI] [PMC free article] [PubMed]
- 20.Shahid O, Nasajpour M, Pouriyeh S, Parizi RM, Han M, Valero M, Li F, Aledhari M, Sheng QZ. Machine learning research towards combating COVID-19: Virus detection, spread prevention, and medical assistance. J. Biomed. Inform. 2021;117:103751. doi: 10.1016/j.jbi.2021.103751. [DOI] [PMC free article] [PubMed] [Google Scholar]
- 21.Dash, S., Chakravarty, S., Mohanty, S.N., Pattanaik, C.R., Jain, S.: A deep learning method to forecast COVID-19 outbreak. New Generation Computing pp. 1–25 (2021) [DOI] [PMC free article] [PubMed]
- 22.Bhatraju PK, Ghassemieh BJ, Nichols M, Kim R, Jerome KR, Nalla AK, Greninger AL, Pipavath S, Wurfel MM, Evans L, et al. COVID-19 in critically ill patients in the Seattle region-case series. N. Engl. J. Med. 2020;382(21):2012–2022. doi: 10.1056/NEJMoa2004500. [DOI] [PMC free article] [PubMed] [Google Scholar]
- 23.Moldofsky H, Patcai J. Chronic widespread musculoskeletal pain, fatigue, depression and disordered sleep in chronic post-sars syndrome; a case–controlled study. BMC Neurol. 2011;11(1):1–7. doi: 10.1186/1471-2377-11-37. [DOI] [PMC free article] [PubMed] [Google Scholar]
- 24.Jiang DH, McCoy RG. Planning for the post-COVID syndrome: how payers can mitigate long-term complications of the pandemic. J. Gen. Intern. Med. 2020;35(10):3036–3039. doi: 10.1007/s11606-020-06042-3. [DOI] [PMC free article] [PubMed] [Google Scholar]
- 25.Kang H. The prevention and handling of the missing data. Korean J. Anesthesiol. 2013;64(5):402. doi: 10.4097/kjae.2013.64.5.402. [DOI] [PMC free article] [PubMed] [Google Scholar]
- 26.Myles AJ, Feudale RN, Liu Y, Woody NA, Brown SD. An introduction to decision tree modeling. J. Chemometr. 2004;18(6):275–285. doi: 10.1002/cem.873. [DOI] [Google Scholar]
- 27.Song YY, Ying L. Decision tree methods: applications for classification and prediction. Shanghai Arch. Psychiatry. 2015;27(2):130. doi: 10.11919/j.issn.1002-0829.215044. [DOI] [PMC free article] [PubMed] [Google Scholar]
- 28.Liaw A, Wiener M, et al. Classification and regression by randomforest. R news. 2002;2(3):18–22. [Google Scholar]
- 29.Suthaharan S. Machine learning models and algorithms for big data classification. Berlin: Springer; 2016. Support vector machine; pp. 207–235. [Google Scholar]
- 30.Zhang, Z.: A gentle introduction to artificial neural networks. Ann. Transl. Med. 4(19) (2016) [DOI] [PMC free article] [PubMed]
- 31.Karadeniz, T., Tokdemir, G., Maraş, H.H.: Ensemble methods for heart disease prediction. New Generation Computing pp. 1–13 (2021)
- 32.Sharma, N., Dev, J., Mangla, M., Wadhwa, V.M., Mohanty, S.N., Kakkar, D.: A heterogeneous ensemble forecasting model for disease prediction. New Generation Computing pp. 1–15 (2021) [DOI] [PMC free article] [PubMed]
- 33.Bao, X., Bahl, P., Kansal, A., Chu, D., Choudhury, R.R., Wolman, A.: Helping mobile apps bootstrap with fewer users. In: proceedings of the 2012 ACM Conference on Ubiquitous Computing, pp. 491–500 (2012)
- 34.Jain AK, Moreau J. Bootstrap technique in cluster analysis. Pattern Recogn. 1987;20(5):547–568. doi: 10.1016/0031-3203(87)90081-1. [DOI] [Google Scholar]
- 35.Sun, Y., Xue, B., Zhang, M., Yen, G.G.: An experimental study on hyper-parameter optimization for stacked auto-encoders. In: 2018 IEEE Congress on Evolutionary Computation (CEC), pp. 1–8. IEEE (2018)


