Abstract
Background:
The Hospital Readmissions Reduction Program (HRRP) has been associated with reduced 30-day readmissions for acute myocardial infarction (AMI) and heart failure (HF).
Objective:
To test whether this 30-day readmission reduction is a manifestation of practices that defer or avoid hospitalizations beyond the 30-day period.
Methods:
At all U.S. hospitals under HRRP, we calculated daily readmission rates for elderly Medicare fee-for-service beneficiaries through day-60 post-discharge following a hospitalization for AMI and HF—the 2 target cardiovascular conditions - as well as pneumonia in July 2008-June 2016. We applied a robust bias-corrected non-parametric regression approach to evaluate for discontinuities in rates around day 30.
Results:
We identified 3256 eligible hospitals, with median readmission rates in the days 1-30 and 31-60 post-discharge of 19.6% (IQR: 16.7%, 22.9%) and 7.8% (IQR: 6.5%, 9.4%) for AMI, 23.0% (IQR: 20.6%, 25.3%) and 11.4% (IQR: 10.2%, 12.6%) for HF, and 17.5% (IQR: 15.4%, 19.8%) and 8.3% (IQR: 7.3%, 9.3%) for pneumonia, respectively. Daily readmission rates decreased across most of the 60 post-discharge days, with no discontinuities in the local polynomial regression for readmission at the 30-day mark, with a >95% power to detect 0.1% difference for each outcome across 30 days. Similarly, there was no discontinuity in mortality at 30 days post-discharge, or for either outcome at hospitals that incurred readmission penalties.
Conclusion:
There was no evidence that clinicians adopted strategies that specifically deferred admissions or affected mortality in the 30-day period after discharge. The findings are consistent with the institution of strategies that generally affected readmission risk after discharge.
Keywords: Health Policy, Outcomes Research, Hospital Readmissions Reduction Program, Quality of care
Condensed abstract:
The Hospital Readmissions Reduction Program (HRRP) has been associated with reduced 30-day readmissions for acute myocardial infarction (AMI) and heart failure (HF)—the 2 cardiovascular condition it targets—as well as pneumonia. In a national assessment of US hospitals between July 2008 and June 2016, we found that post-discharge readmission and mortality rates decreased consistently beyond post-discharge day 30. In a robust non-parametric discontinuity regression analysis, there were no discontinuities in readmission or mortality rates at day 30, arguing against a systematic gaming of the 30-day readmission measures based on pushing readmissions past the measure period.
The Hospital Readmissions Reduction Program (HRRP) has been associated with reduced readmissions for acute myocardial infarction (AMI) and heart failure (HF)—the 2 cardiovascular conditions that have been targeted in the program since its outset, as well as for pneumonia (1,2). The policy has focused on promoting improvement in the quality of care for patients as well as the transitional care services they receive (3). Therefore, while the policy uses the 30-day threshold to evaluate hospital performance on readmissions, the effects of the policy, if implemented appropriately, should not be limited to this 30-day post-discharge period. Patients are more vulnerable to readmissions in the early post-discharge period, however, they continue to have a lower but continued risk of readmissions beyond the 30-day period (4–6). Therefore, if HRRP was associated with reduction in readmissions largely through improvement in quality of care, the association of the policy with reduction in readmissions would not be expected to be limited to the 30-day post-discharge period. Conversely, if hospitals have pursued lower 30-day readmission rates through strategies of either avoiding or deferring readmissions that would have occurred in the 30-day post-discharge period (7,8), readmission risk would expected to vary around the 30-day post-discharge threshold.
Specifically, if hospitals had policies, processes or culture that treated recently hospitalized patients differently during the 30-day window, we might expect a change in the threshold for readmitting patients at the 30-day mark or a purposeful delay in readmitting someone close to the end of the measure period. Such an attempt to reduce access to hospitalization specifically in that time window would be against the spirit of the program, which was intended to improve the quality of care and reduce readmission risk broadly over time. Moreover, if required hospitalizations have been delayed beyond the measure period, there may be unexpected increase in mortality within the 30-day post-discharge period. This is an important mechanism to evaluate given a recent increase in post-discharge mortality in HF (2,9), particularly if a selective deferral of care in the 30-day post-discharge period relative to the period beyond 30 days of discharge was associated with an elevated mortality risk that improved at the 30-day threshold when readmissions are not scrutinized. Overall, a critical appraisal of the policy requires an assessment whether hospitals are playing to the measure or changing admission thresholds based on when the measure assessment period ends.
Accordingly, we conducted data experiments to test whether there was a change in admission threshold at the time boundary of the measure. At hospitals that were under the purview of the HRRP, we used a quasi-experimental design—the regression discontinuity approach—to test for changes in the trajectory of hospital readmission rates at the 30-day mark in an 8-year period spanning the announcement of the HRRP for AMI and HF. Moreover, given similarity in temporal trends in outcomes in HF and pneumonia—the non-cardiovascular condition targeted in HRRP, we evaluated for these patterns of care in pneumonia as well. We also evaluated how the pattern varies across hospitals based on whether they reduced their readmission rates from the start of the study, if they were penalized for excess readmissions, and if they cared for a disproportionate share of low-income individuals.
Methods
Data Sources
To assess for discontinuities in post-discharge readmission and mortality for conditions targeted in the HRRP, we used data from the Medicare standard analytic files for July 2008 through June 2016 to calculate rates of readmissions and mortality following hospitalization for each of the three conditions – AMI, HF and pneumonia – in elderly, fee-for-service Medicare beneficiaries, for every post-discharge day through post-discharge day-60 at US hospitals under the purview of the program. Patient demographics were identified using the denominator file, and comorbidities using a year of Medicare claims across inpatient and outpatient care settings over the 1-year period preceding the hospitalization. Hospital characteristics were collected from 2 sources. We used the American Hospital Association data for 2015 to identify structural characteristics (teaching status, urban/rural location, bed size, and safety-net status). We used the CMS data to identify whether a hospital incurred a financial penalty for above average readmission rates in the HRRP for the year 2013. Further, we identified hospitals that served a disproportionately high proportion of individuals with social disadvantageousness (DSH hospitals), defined by the CMS based on the share of all hospitalizations that were for individuals with dual Medicaid and Medicare enrollment (10).
Study Population
At all US hospitals, we identified fee-for-service Medicare beneficiaries, 65 years of age or older, discharged alive following a hospitalization during July 2008 through June 2016 for one of the three targeted conditions – AMI, HF and pneumonia. Hospitalization for target conditions were defined using primary discharge diagnoses for the respective conditions using diagnoses codes used in the CMS readmission measures (11,12). We excluded hospitalization records for patients transferred to another hospital and for those who left the hospital against medical advice. Hospitalizations within 60-days of discharge for the same condition were not considered index events. Finally, we selected hospitals that contributed hospitalizations over the 8-year period, were HRRP eligible in 2013, and had at least 25 hospitalizations for one or more of the three conditions over the study period. In analyses using individual years of data, hospitals with at least 10 hospitalizations over the year were included.
Study Outcomes
We examined 2 primary outcomes—readmission and mortality, assessed for AMI, HF and pneumonia individually. At each hospital, readmission was defined as a hospitalization for any cause in the post-discharge period, calculated as a daily rate of readmission for post-discharge day 1 through 60 across all index hospitalizations at that hospital for a given condition over a period. Mortality was similarly assessed at each hospital for each of the three HRRP target conditions for each post-discharge day, from day 1 through day 60 and was defined as death from any cause. We also examined the primary diagnosis of the readmission to define additional outcomes: (a) cardiovascular readmissions, defined as readmissions with a primary diagnosis for a cardiovascular condition (Online Table 1), (b) non-cardiovascular readmissions as those without a cardiovascular primary diagnosis, and (c) index-condition readmissions, which were defined as readmissions for the same condition as the index hospitalization.
Statistical Analysis
At each US hospital, for each of three 3 HRRP conditions, we first calculated daily readmission and mortality rates for 2 1-year intervals representing the start and end of the study period (July 2008-June 2009 and July 2015-June 2016). We also assessed cause-specific readmissions, including readmissions for cardiovascular conditions, non-cardiovascular conditions as well as those of the same condition as the index hospitalization. We then assessed how daily readmission and mortality rates changed across all US hospitals over the study period. We used generalized additive models with a fourth order polynomial distribution to assess how readmission and mortality rates changed over the years (13). Further, using an interaction term for study-period (start vs end year) and post-discharge period (0-30 vs 31-60), we evaluated for relative changes in readmission and mortality rates before and after the post-discharge day-30 mark. Next, we examined the distribution of readmission and mortality across all hospitals based on whether they were subject to penalties under the HRRP in 2013. Similar to the approach above, we used generalized additive modeling to assess readmission and mortality rates through post-discharge day-60 with interaction terms for penalty-status and post-discharge day (0-30 vs 31-60) to assess whether penalty hospitals had a differential pattern of readmissions before and after the 30-day threshold in the three-year period from July 2013 through 2016 based on their penalty status in 2013.
Next, using hospitalizations over the entire 8-year study period at hospitals with at least 25 hospitalizations for a given target condition, we used a regression-discontinuity approach to address whether there was any evidence of discontinuities in readmission or mortality rates at hospitals at the 30-day mark. In the absence of a systematic gaming of measures, readmission as well mortality rates would be expected to have a continuous distribution across the post-discharge days, without a change around the 30-day mark. The regression-discontinuity approach has been described previously (14,15). Briefly, it is a quasi-experimental approach that assesses whether continuously distributed data are distributed uniformly across an artificial threshold or interruption in the data, such as post-discharge day 30, and whether they experience inflections that would not be expected by chance alone. We visually assessed the distribution of the readmission and mortality rates across post-discharge days and noted low rates of both events on post-discharge day 1 followed by a continuous decline in both outcomes across post-discharge days. Therefore, in our discontinuity regression assessment, daily readmission and mortality rates (from post-discharge day 2 through 60) across the pre-defined cutoff of day 30 at all hospitals and addressed if the regression slopes showed significant discontinuities at the 30-day mark.
Given their non-linear distribution of post-discharge readmission and mortality rates across the 60 post-discharge days, we fit a non-parametric local polynomial regression model using a fourth order polynomial distribution of data before and after the cut point (16). In the discontinuity regression approach, we assessed whether 2 regression slopes drawn at points adjacent to the cut point but allowed to have their own slope and intercept showed significant changes at the cut-point. Further, we included discharge volume at each hospital throughout the study period as a covariate in the model. To account for hospital-level differences, we accounted for their case-mix represented by their expected readmission rates, their penalty status, and the DSH status in the year 2014.
Given statistical issues that may arise with the use of higher order polynomials in the regression discontinuity framework (17), we addressed simpler distributions of data, including linear and quadratic distribution, in sensitivity analyses. The bin size for all analyses were set at 1-day increments and the bandwidth around the cut point were chosen to maximize the assessment distribution of the outcome around the cut-point at day 30. In sensitivity analyses, we varied the bandwidth to half and one-fourth of the data distribution across the cut-point.
We repeated an assessment of discontinuities in regression for readmission and mortality after classifying hospital based on (a) their DSH status, (b) whether they incurred financial penalties in 2013, in the 3-year period following the penalties (2014-2016), and (c) whether they were in the highest or lowest quartile for changes in readmissions over the 8-year period based on the coefficient for the least squares regression of readmission rates over calendar years. As these hospitals serve low-income individuals and/or have incurred financial penalties for excess readmissions, they are likely to be more vulnerable to the need to pursue aggressive reductions in readmission in response to the financial penalties. We also evaluated for discontinuities in readmissions based on their etiology, including cardiovascular and non-cardiovascular readmission as well as readmissions for the index condition.
Finally, we illustrate the statistical power of our analyses to detect a small hypothetical difference (0.1%) in the rates of our outcome at points immediately preceding and following the cut-off in the regression discontinuity assessment based on the observed distribution of the data and the variance of the data across the cut point (18). We used the ‘rdpower’ package in STATA 14 to conduct these power assessments.
Sensitivity analyses with positive controls
In addition to the assessment of different data distributions in the regression discontinuity analyses and assessment of minimum detectable difference in readmission and mortality rates in post-hoc power assessments, as described above, we pursued additional analyses wherein we created artificial discontinuities in our data that we used as positive controls. We addressed the ability of our model to identify readmissions that were simulated to occur on day 31 instead of day 30. Specifically, we evaluated whether our model detected discontinuities when a readmission on day 30 was simulated to occur on day 31 at all hospitals. We then evaluated the effect of simulating such a change of just one readmission in sequentially smaller, randomly selected subsets of hospitals, with the goal to identify a threshold at which our analyses would no longer be able to identify a discontinuity due to the statistical noise introduced by other hospitals despite such a systematic change in readmissions. We randomly chose 50%, 25%, 10%, 5% of 2.5% of hospitals where a readmission was moved from day 30 to 31, without any changes to the pattern of readmissions at other hospitals. These analyses also sought to address the sensitivity of our model to practices of delaying or avoiding readmissions at a subset of hospitals.
We used the ‘rdrobust’ package in STATA, version 14 (College Station, TX) to conduct the regression discontinuity analyses (16). All other analyses were performed using SAS, version 9.4 (Cary, NC), and R, version 3.4.3 (The R Foundation). The level of significance was set at 0.05. The study was reviewed by the Yale University Institutional Review Board, which exempted the study from informed consent as it used de-identified data.
Results
We identified 3256 hospitals with at least 25 index events for either of the 3 HRRP conditions over the study period from July 2008 through June 2016 (Online Figure 1). Of these 1,206 (37.1%) were teaching hospitals, 646 (19.8%) were for-profit, 2,777 (85.3%) were in urban areas, 705 (21.6%) were classified as safety-net hospitals, and 2,768 (85.0%) had small/medium bed size (<500). During this period, these hospitals had a median 270 (IQR: 88, 661) hospitalizations for AMI, 620 (IQR: 282, 1227) for HF, and 797 (IQR: 414, 1384) pneumonia, respectively (Table 1).
Table 1: Characteristics of hospitals included in the study.
The study includes 3256 hospitals with 25 or more cases of at least one of the three target conditions of the Hospital Readmissions Reduction Program (HRRP), acute myocardial infarction (AMI), heart failure (HF) or pneumonia, during the study period from July 2008-June 2016.
| Overall | Hospitals with >25 AMI | Hospitals with >25 HF | Hospitals with >25 Pneumonia | |
|---|---|---|---|---|
| Number of hospitals | 3256 | 2744 | 3214 | 3245 |
| Hospitalizations, N | ||||
| Overall, for respective targeted conditions | - | 1,288,099 | 2,841,935 | 3,295,266 |
| Number per hospital, median (IQR) | - | 270 (88, 661) | 620 (282, 1227) | 797 (414, 1384) |
| Bedsize* | ||||
| Small (<250 beds) | 2061 (63.3) | 1654 (60.3) | 2029 (63.1) | 2054 (63.3) |
| Medium (250-500) | 707 (21.7) | 698 (25.4) | 706 (22) | 707 (21.8) |
| Large (≥500) | 276 (8.5) | 273 (9.9) | 274 (8.5) | 276 (8.5) |
| Urban location* | 2777 (85.3) | 2482 (90.5) | 2746 (85.4) | 2770 (85.4) |
| Ownership* | ||||
| Public | 476 (14.6) | 340 (12.4) | 462 (14.4) | 476 (14.7) |
| Private, not-for-Profit | 1922 (59.0) | 1734 (63.2) | 1911 (59.5) | 1920 (59.2) |
| Private, for-profit | 646 (19.8) | 551 (20.1) | 636 (19.8) | 641 (19.8) |
| Teaching status* | ||||
| Council of teaching hospitals | 230 (7.1) | 228 (8.3) | 230 (7.2) | 230 (7.1) |
| Teaching hospitals, other | 976 (30) | 906 (33) | 966 (30.1) | 974 (30) |
| Non-Teaching | 1838 (56.4) | 1491 (54.3) | 1813 (56.4) | 1833 (56.5) |
| Safety-Net Hospital*,† | 705 (21.7) | 541 (19.7) | 691 (21.5) | 705 (21.7) |
| HRRP penalties in 2013† | 2214 (68.0) | 1946 (70.9) | 2208 (68.7)) | 2213 (68.2) |
| Disproportionate share hospital in 2014† | 2364 (72.6) | 2050 (74.7) | 2344 (72.9) | 2362 (72.8) |
Abbreviations: AMI - acute myocardial infarction, HF - heart failure, HRRP – hospital readmissions reduction program, IQR – interquartile range.
Missing information for 212 hospitals (119 AMI, 205 HF, 208 pneumonia)
Based on publicly-reported data by the Centers for Medicare and Medicaid Services
Readmission and mortality rates through post-discharge day-60
The median hospital readmission rates between the first 30 days, and days 31 and 60 post-discharge were 19.6% (IQR: 16.7%, 22.9%) and 7.8% (IQR: 6.5%, 9.4%) for AMI, 23.0% (IQR: 20.6%, 25.3%) and 11.4% (IQR: 10.2%, 12.6%) for HF, and 17.5% (IQR: 15.4%, 19.8%) and 8.3% (IQR: 7.3%, 9.3%) for pneumonia, respectively. Similarly, median hospital mortality rates between days 1 and 30, and days 31 and 60 post-discharge were 8.4% (IQR: 6.1%, 12.8%) and 3.6% (IQR: 2.6%, 5.3%) for AMI, 8.6% (IQR: 7.3%, 10.1%) and 5.3% (IQR: 4.6%, 6.1%) for HF, and 11.1% (IQR: 9.5%, 12.9%) and 4.9% (IQR: 4.2%, 5.6%) for pneumonia, respectively. Readmission and mortality rates across hospitals during days 1 and 30, and days 31 and 60 post-discharge across hospitals over the study years are presented in Online Figure 2.
Distribution of daily readmission and mortality rates
The daily readmission rates across hospitals decreased between days 1 and 60 for all 3 conditions (Online Figure 3). In a comparison of rates of readmission from days 1 through 60 post-discharge in the first (July 2008-June 2009) and last (July 2015-June 2016) years of the study-period using a generalized additive model representing a fourth order polynomial (Figure 1), readmission rates for AMI were lower in 2015-2016 during both days 1-30 as well as days 31-60 post-discharge (P<0.001), but were prominent in the days 1-30 period (P for interaction <0.001 – pre/post 30-day*year). A similar pattern was observed for both HF and pneumonia as well.
Figure 1: All-cause Readmission Rates from Day 1 Through 60 Post-Discharge.
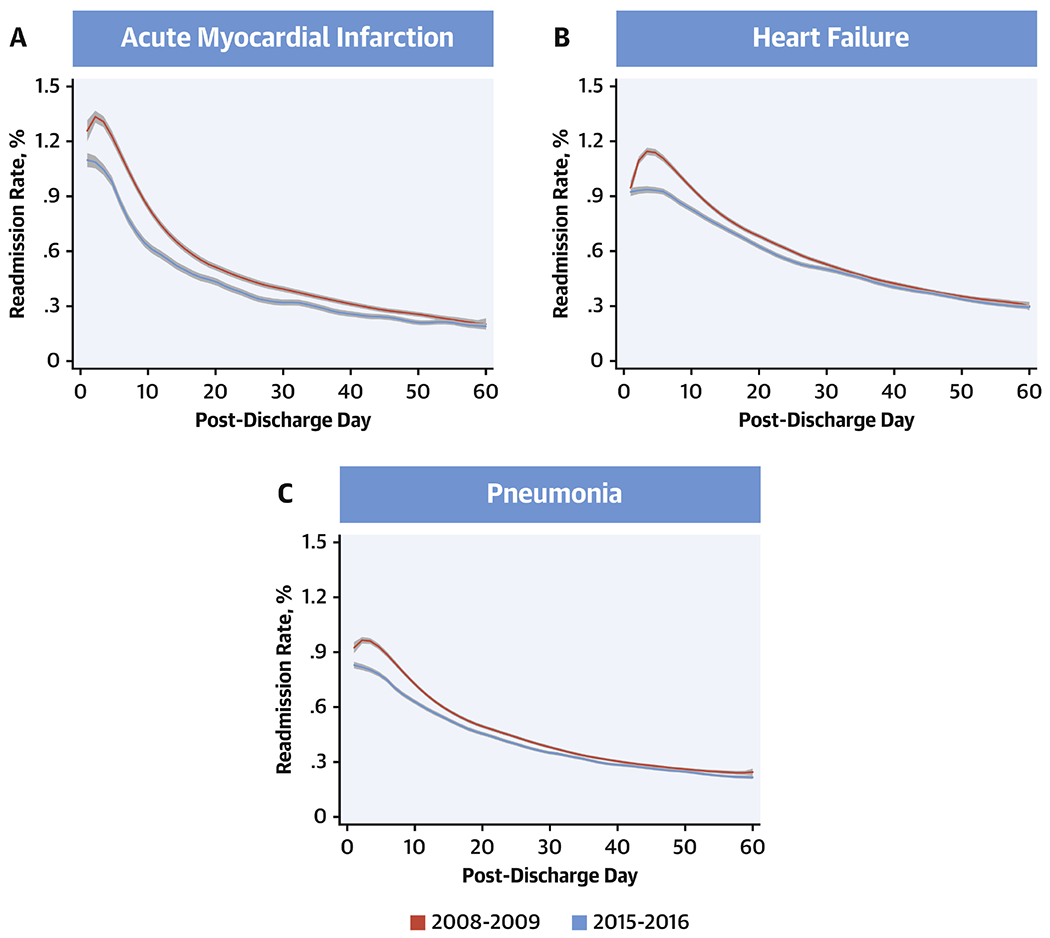
Readmission rates from days 1 through 60 post-discharge during the first year (July 2008-June 2009) and final year (July 2015-June 2016) of the study. Lines represent the smooth curves based on generalized additive models with a fourth order polynomial. Red: 2008-09, blue: 2015-16.
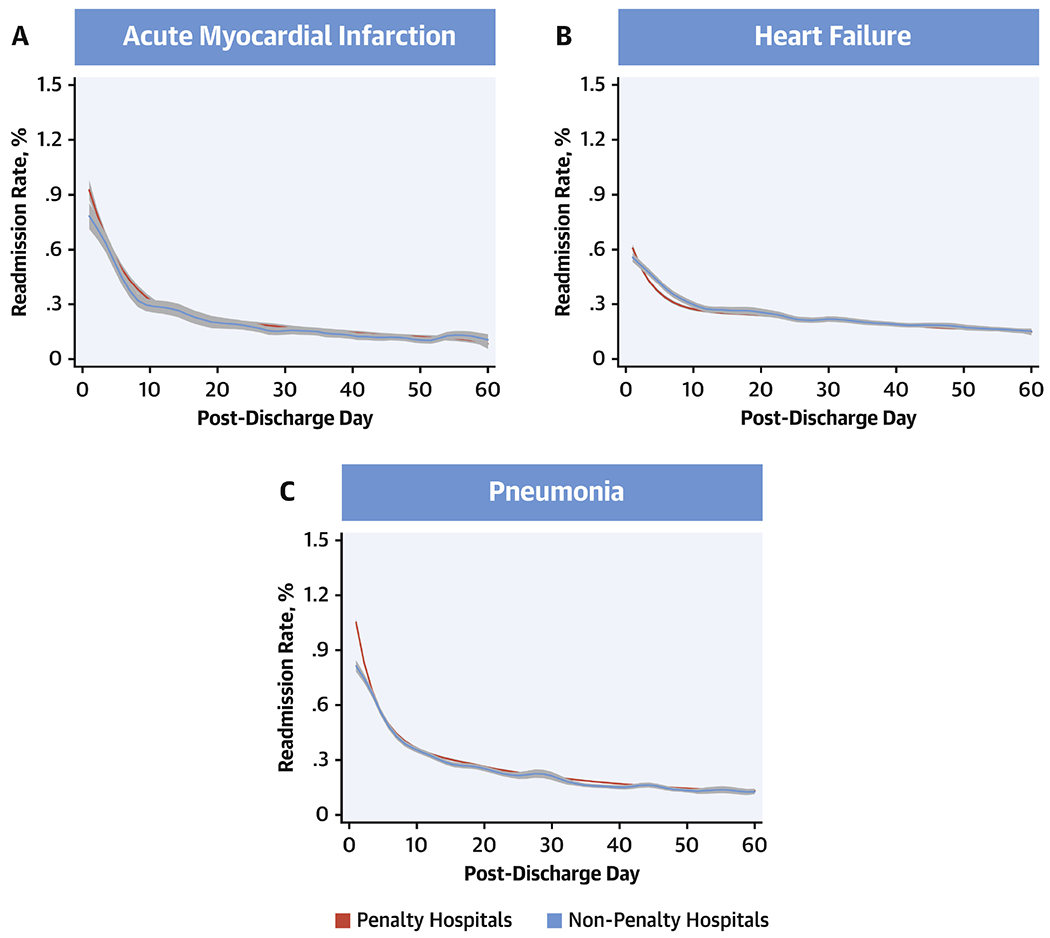
Notably, in 2008-2009, there was a period of rising readmission risk within the first few days following discharge, which was seen across the three target conditions. This rise was the most protracted for HF, extending late into the first week following discharge. AMI and pneumonia also demonstrated a brief period of rising rates of readmissions in this period, however, this period was shorter than that for HF. Nevertheless, in 2015-2016, there was a substantial reduction in readmissions across target conditions that both attenuated this period of early excess readmissions and continued through day-60 post-discharge. Readmissions for specific causes, such as those for cardiovascular and non-cardiovascular conditions, as well as for the same condition as the index hospitalization were also reduced (Figure 2, Online Figure 4). The pattern of readmissions varied across hospitals in the 3-year-period (2013-16) following penalties for excess readmissions in 2013, with penalty hospitals (n=2214) showing higher readmission rates than non-penalty hospitals (n=1042), which were more prominent in the first 30-days after discharge, particularly for HF (P interaction for penalty status*pre/post 30-day after discharge, <0.001 for HF) (Figure 3).
Figure 2: Changes in Readmission Rates from Day 1 Through 60 Post-Discharge by Cause of Readmission.
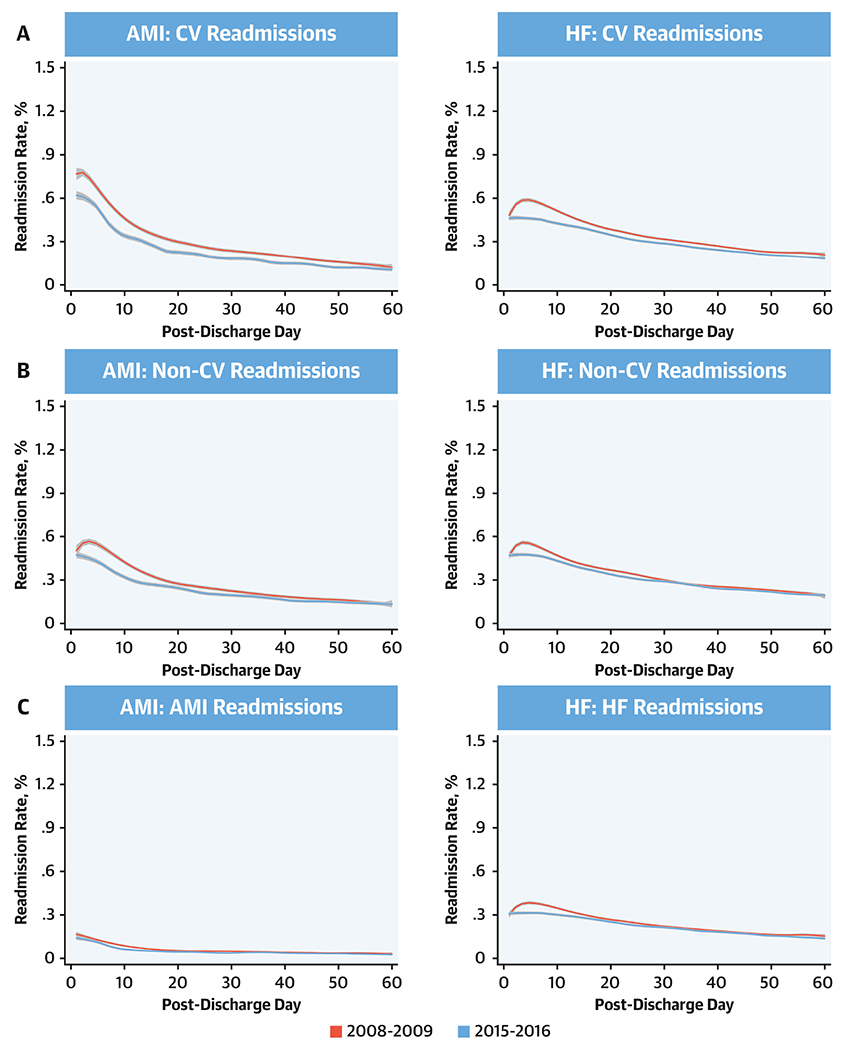
Readmissions were classified as cardiovascular readmissions, non-cardiovascular readmissions, and index-condition readmission and were defined based on the primary diagnosis of the readmission. Lines represent the smooth curves based on generalized additive models with a fourth order polynomial. Red line represents start year July 2008- June 2009 and blue line represents the last year July 2015-June 2016.
Figure 3: Readmission Rates at Penalty Hospitals.
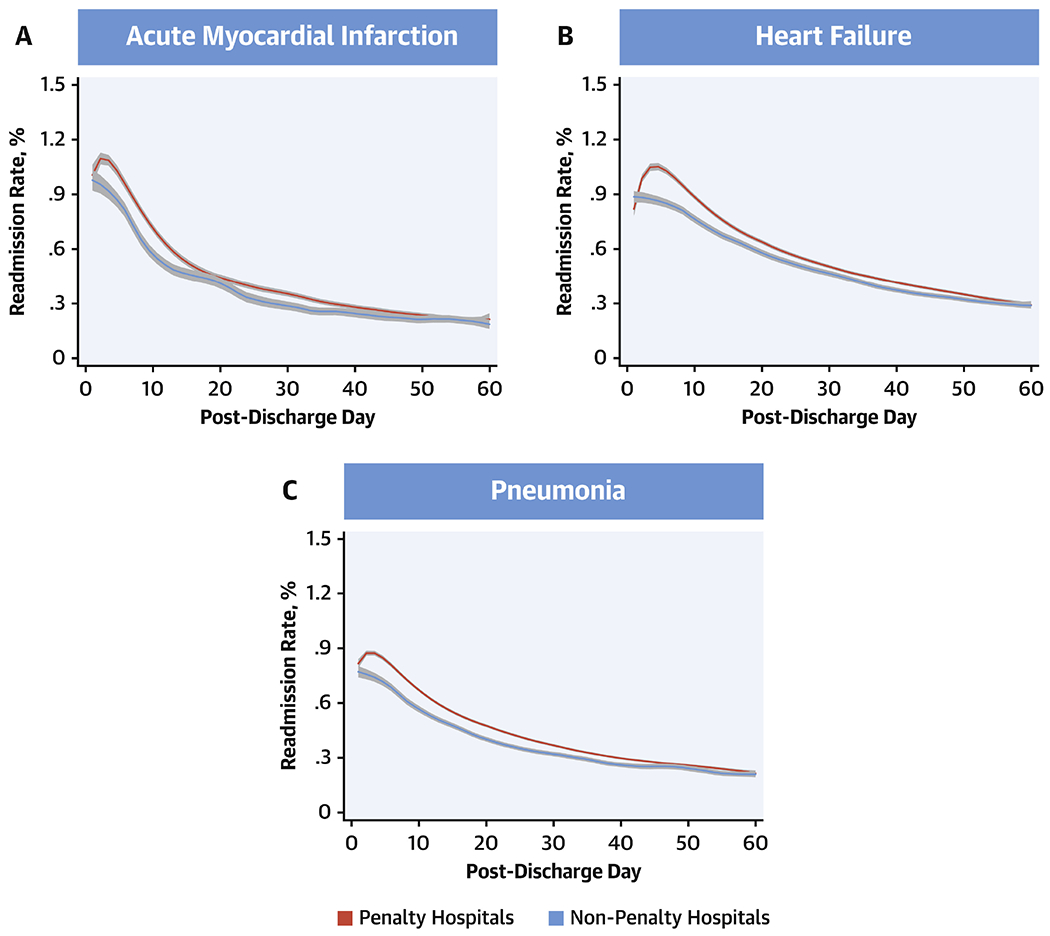
Readmission rates from days 1 through 60 post-discharge during July 2013 -June 2016 based on whether hospitals incurred penalties under the Hospital Readmissions Reduction Program in 2013. Lines represent the smooth curves based on generalized additive models with a fourth order polynomial. Red: Penalty hospitals, blue: Non-penalty hospitals.
The daily rates of mortality followed a similar distribution across the 60-post discharge days (Online Figure 5). However, there were notable differences in changes from 2008-09 and 2015-16 across the 3 conditions. In a generalized additive model with a fourth degree polynomial, daily mortality as outcome, and study year and before vs. after post-discharge day 30 as the predictors (Figure 4), AMI mortality was lower in 2015-16 across the 60-post discharge days (P<0.001), without a significant difference in rates before and after post-discharge day 30 (P for interaction for pre/post 30-day*year = 0.05). In contrast, post-discharge mortality was higher in 2015-16 than 2008-09 for HF and pneumonia, with differences across years limited to the early post-discharge period, without a distinct change in distribution mortality over the post-discharge period. Notably, there were no differences in mortality across penalty and non-penalty hospitals across conditions (Figure 5).
Figure 4: All-cause Mortality Rates from Days 1 Through 60 Post-Discharge.
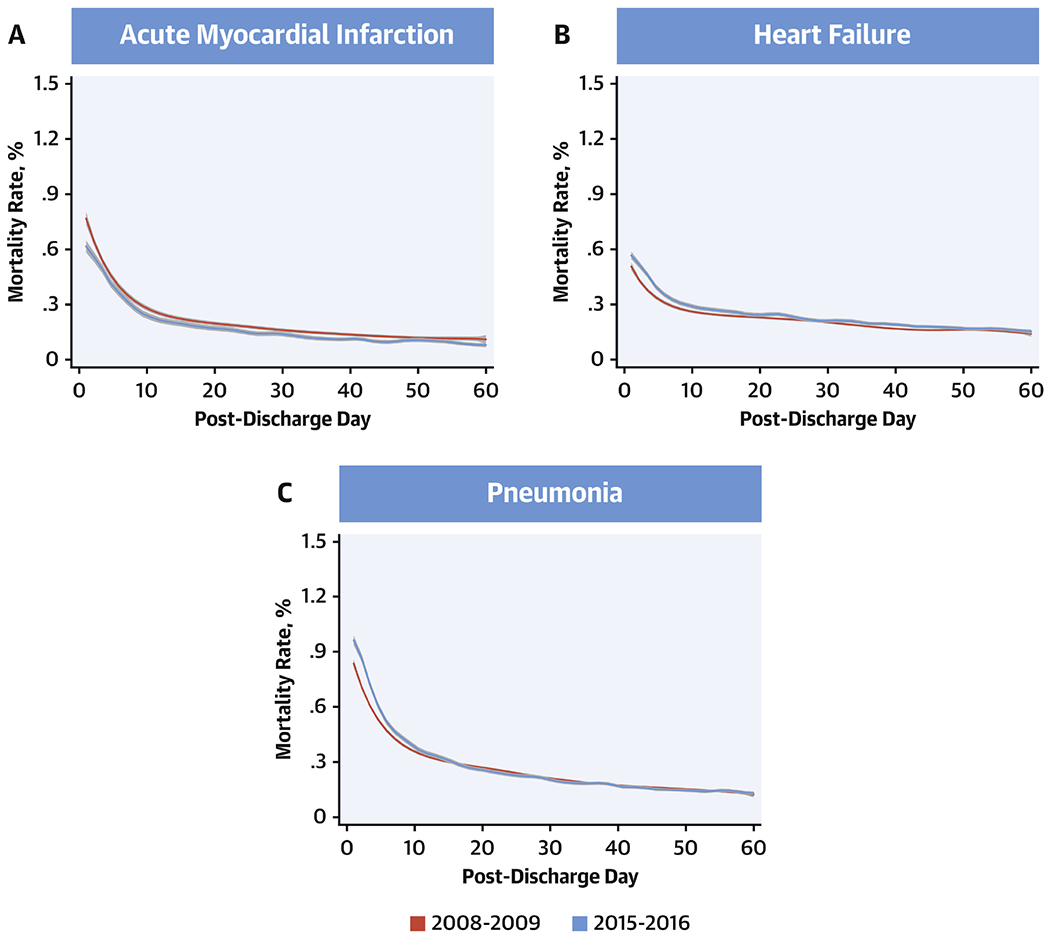
Mortality rates from days 1 through 60 post-discharge during the first year (July 2008-June 2009) and final year (July 2015-June 2016) of the study. Lines represent the smooth curves based on generalized additive models with a fourth order polynomial. Red: 2008-09, blue: 2015-16.
Figure 5: Mortality Rates at Penalty Hospitals.
Mortality rates from days 1 through 60 post-discharge during July 2013 -June 2016 based on whether hospitals incurred penalties under the Hospital Readmissions Reduction Program in 2013. Lines represent the smooth curves based on generalized additive models with a fourth order polynomial. Red: Penalty hospitals, blue: Non-penalty hospitals.
Regression-discontinuity at post-discharge day 30
In local polynomial regression of daily readmission rates for days 1 through 60 over the 8-year study period, there were no discontinuities in readmission rates for AMI at post-discharge day 30 (change at day 30, −0.11; 95% CI, −0.058, 0.010; P = 0.17), with a 99% power to evaluate a difference in readmission rates of 0.1% at the 30-day threshold (Central Illustration). Similarly, there were no discontinuities in readmission rates for HF (change at day 30, 0.007; 95%CI, −0.022, 0.028; P = 0.82) or pneumonia (change at day-30, 0.005; 95%CI, −0.010, 0.025; P = 0.38), with an >99% power to detect difference of 0.1% in readmission rates in HF and pneumonia between post-discharge day 30 and 31 (Central Illustration). Similarly, there were no discontinuities in mortality at day 30 for each of the three conditions, with an over 95% power to detect a difference in mortality of 0.1% (Figure 6, Online Table 2).
Central Illustration: Discontinuity regression plots for 30-day readmission using local polynomial regression.
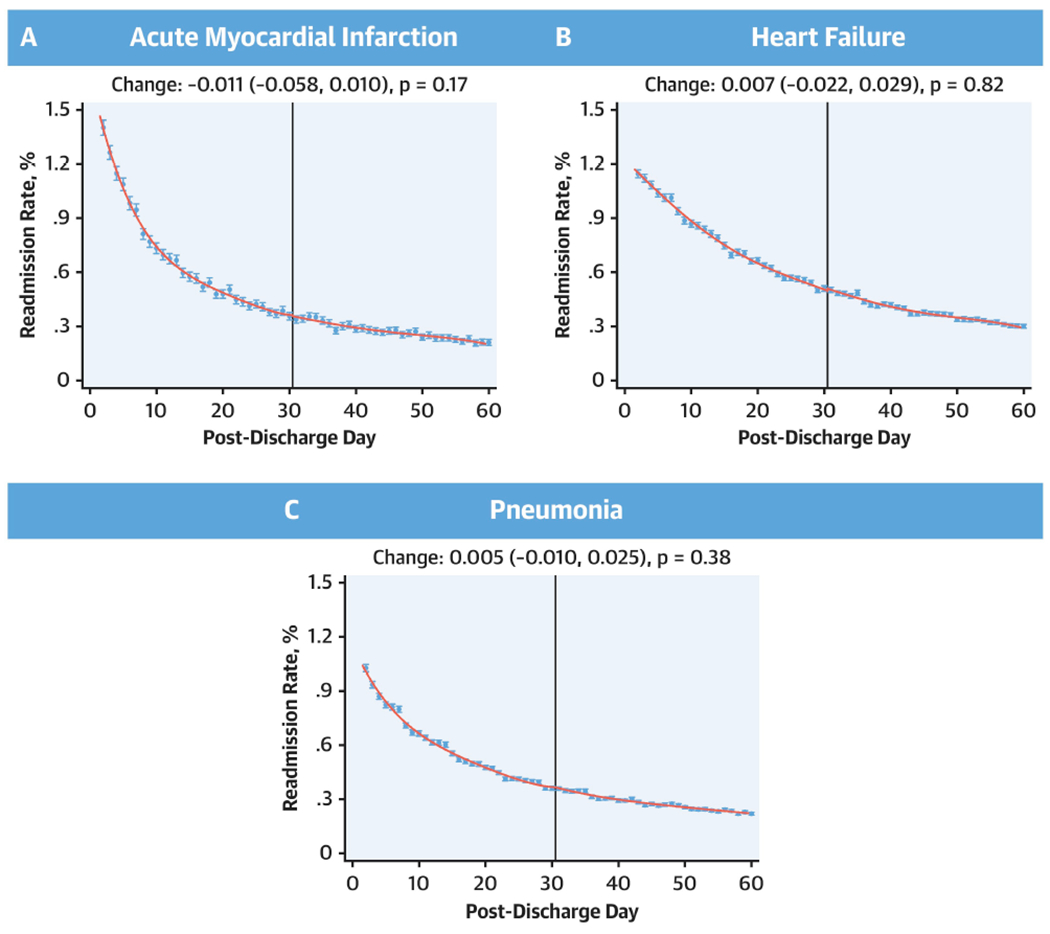
No discontinuities in the regression around 30 days for either acute myocardial infarction, heart failure, or pneumonia. Effect estimates represent changes that occurred across day-30 post-discharge.
Figure 6: Discontinuity regression plots for 30-day mortality using local polynomial regression.
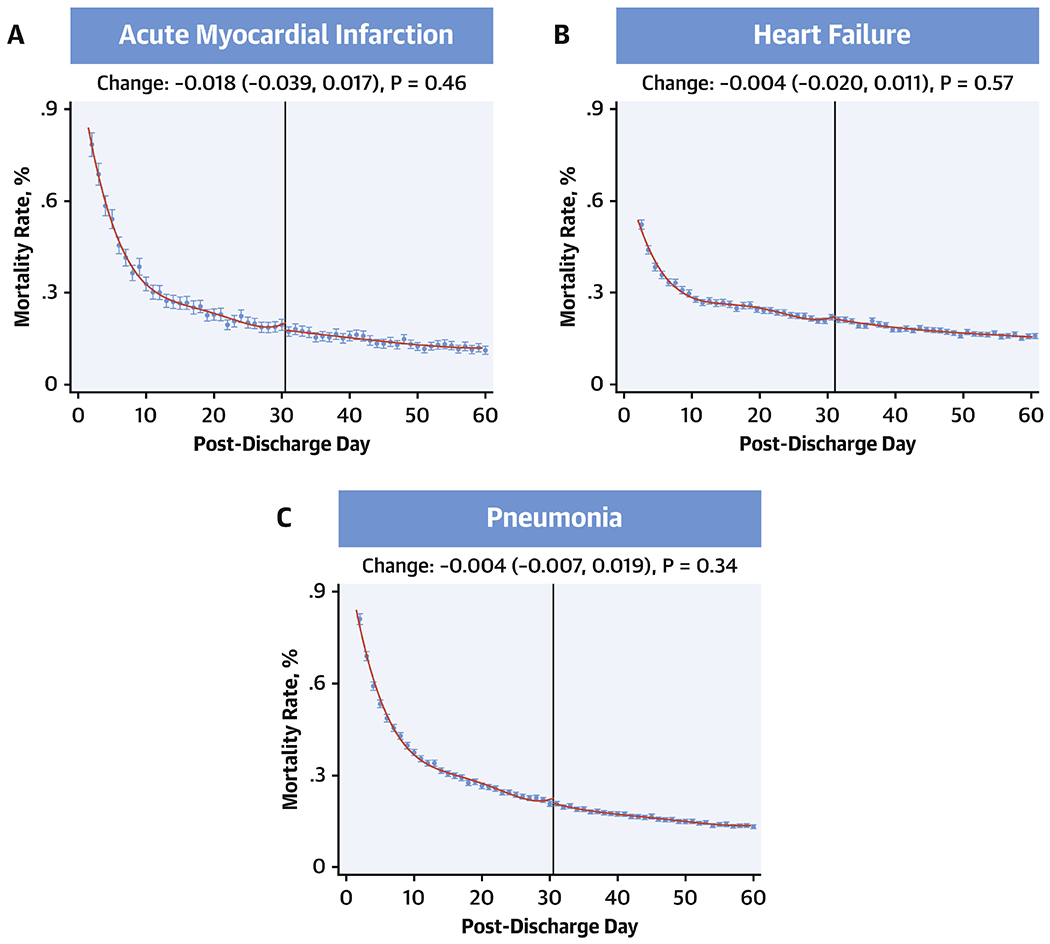
No discontinuities in the regression around 30 days for either heart failure, acute myocardial infarction or pneumonia. Effect estimates represent changes that occurred across day-30 post-discharge.
In subgroup analyses, there were no discontinuities in readmission rates at either DSH hospitals or at those that incurred penalties in 2013 in the 3-year period following these penalties (Table 2). Similarly, there were no discontinuities at hospitals in the highest quartile for changes in readmission rates across the 8-year period for heart failure (Discontinuity at hospitals in the highest quartile for reduction in readmissions, 0.038, 95% CI, −0.029, 0.090; P = 0.32 and in the lowest quartile for readmission reduction, −0.023, 95% CI, −0.086, 0.034; P = 0.40). Further, there were no discontinuities in readmission rates for cardiovascular diagnoses, non-cardiovascular diagnoses as well as readmission for the same condition as the index hospitalization (P>0.05 for all assessments) (Table 2).
Table 2: Discontinuity Regression by Type of Readmission and Hospital Type.
Coefficient for discontinuities and their 95% confidence intervals for local polynomial regression with a cut point at post-discharge day 30. P-values assess the null hypothesis that there are no changes across the 30-day threshold.
| Change across day 30 | |||
|---|---|---|---|
| Acute myocardial infarction | Heart failure | Pneumonia | |
| By Readmission Type | |||
| All cause | −0.011 (−0.058, 0.010); P = 0.17 | 0.007 (−0.022, 0.029); P = 0.82 | 0.005 (−0.010, 0.025); P = 0.38 |
| Cardiovascular | −0.009 (−0.036, 0.015); P = 0.41 | −0.001 (−0.023, 0.016); P = 0.76 | 0.002 (−0.003, 0.013), P = 0.21 |
| Non-cardiovascular | 0.012 (−0.022, 0.031); P = 0.73 | 0.007 (−0.014, 0.022); P = 0.64 | 0.000 (−0.015, 0.017); P = 0.90 |
| Same as index condition | −0.002 (−0.011, 0.013); P = 0.91 | 0.006 (−0.008, 0.024); P = 0.32 | −0.003 (−0.012, 0.007); P = 0.64 |
| By Hospital Penalty Status in 2013 (Outcomes in 2013-2016) | |||
| Penalty hospital | −0.014 (−0.106, 0.054); P = 0.52 | 0.024 (−0.016, 0.074); P = 0.20 | 0.026 (−0.001, 0.064); 0.05 |
| Non-penalty hospital | −0.090 (−0.0181, 0.017): P = 0.10 | −0.066 (−0.192, 0.014); P = 0.09 | 0.039 (−0.022, 0.107); P = 0.20 |
| By Hospital DSH Status | |||
| DSH hospital | −0.011 (−0.064, 0.014); P = 0.21 | 0.007 (−0.021, 0.035); P = 0.64 | 0.009 (−0.006, 0.031); P = 0.18 |
| Non-DSH hospital | −0.010 (−0.091, 0.049); 0.56 | 0.008 (−0.060, 0.045); 0.79 | −0.006 (−0.046, 0.035); 0.79 |
Sensitivity analyses with positive controls
The modeling strategy had robust performance and was able to differentiate discontinuities in readmission trends introduced artificially. The model identified a discontinuity in readmission rates when a single readmission was reassigned from day 30 after discharge to day 31 after discharge among those hospitalized with heart failure. A discontinuity was identified when this simulation was carried out at 100% of hospitals and at randomly selected subsets of 50%, 25%, 10% and 5% of the hospitals (Figure 7). It, however, did not identify a significant discontinuity if 2.5% of hospitals were subjected to this simulation. Therefore, if as few as 5% of hospitals delayed a readmission from day 30 to day 31, our modelling strategy would be expected to identify such a pattern as a discontinuity.
Figure 7: Simulation analyses moving 1 readmission from day 30 to 31.
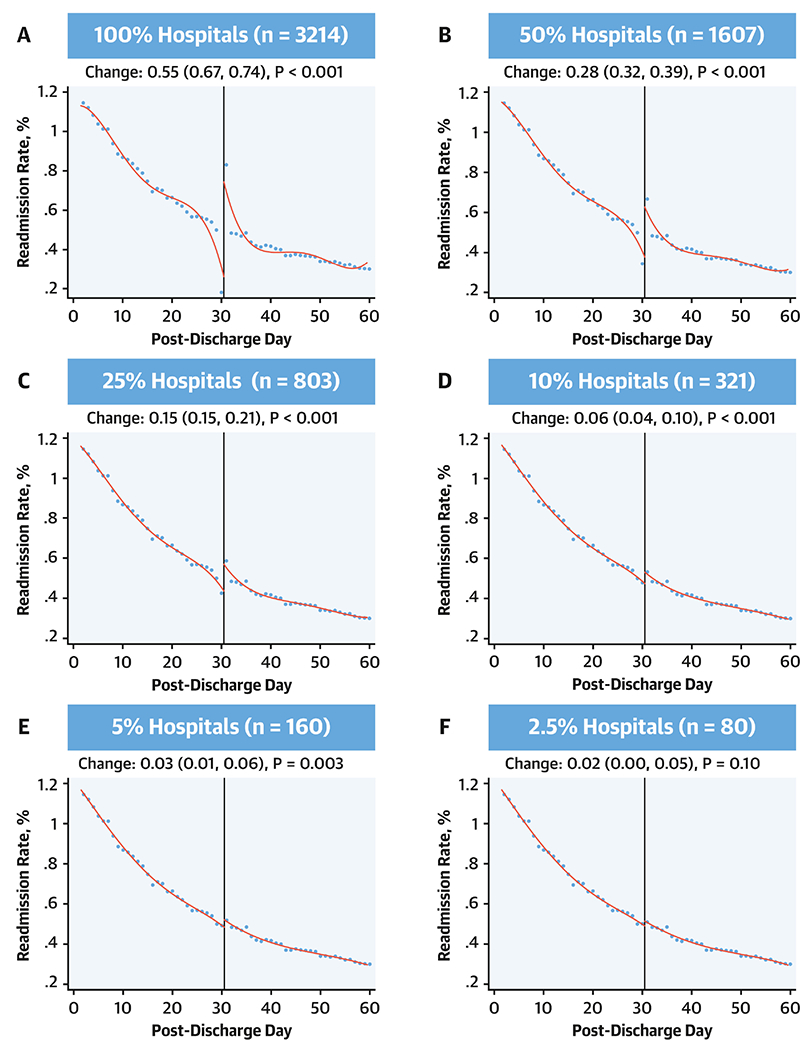
Coefficient for discontinuities and their 95% confidence intervals for local polynomial regression with a cut point at post-discharge day 30. Simulation applied sequentially at all hospitals for the heart failure readmission outcomes and then varying randomly selected subsets of these hospitals.
Discussion
In an assessment of U.S. hospitals between 2008 and 2016 that was sensitive to small inflections in readmissions and mortality rates, there was no evidence that there has been a deferral of readmissions beyond the measure reporting period as a mechanism to reduce readmissions. There were no discontinuities in readmission rates around the 30-day measure reporting threshold, which was consistent at hospitals disproportionately providing care for poor patients, those that incurred financial penalties, and those with the most reduction in readmissions – hospitals most vulnerable to the effects of the program. These assessments are robust and are expected to be able to identify one unexpected excess readmission on day 31 post-discharge at as few as 5% of the hospitals. Similarly, there were no differences in patterns of readmissions for cardiovascular or non-cardiovascular conditions, without an identifiable change across post-discharge day 30. There was also no evidence of changes in mortality around day 30 to suggest an unexpected excess mortality in the 30-day post-discharge period. Finally, across the period of the study, readmission rates decreased in days 1-30 as well as days 31-60 post-discharge, for both cardiovascular and non-cardiovascular causes across three targeted conditions, with modest differences in mortality over time limited to only a short phase in the post-discharge period.
Our study found no discontinuities in the probability of post-discharge readmissions across the day 30 post-discharge. The probability of post-discharge mortality also did not demonstrate an unexpected rise in a hospital around day 30, arguing against practices that specifically focus on deferring readmissions in this period. These observations are pertinent as there has been considerable debate regarding the interpretation of temporal trends in patient readmission and mortality associated with the introduction of HRRP, as studies evaluating them have reached different conclusions (2,9,19,20). Our study, in contrast to the others, focused on mechanisms that may limit the ability of the program to achieve its intended aim of reducing readmissions, through deferment of required admissions to game the measures, which may in turn result in patient harm, but found no evidence of such an effect for either readmissions or mortality. These observations were also consistent across various assessments for robustness. Our modeling strategy was able to accurately identify simulated discontinuities in trends for 1 readmission event at as few as 5% of hospitals. Moreover, we found no heterogeneity in our observations while focusing on specific hospital groups.
Our work also builds on prior work highlighting the continued vulnerability of individuals to both readmission and mortality for an extended period in the post-discharge setting (4,5,21,22). The reduction in readmission rates beyond the 30-day measure reporting period – a period not under the scrutiny of HRRP – is consistent with the hypothesis that the program led to changes in patterns of care that broadly affected readmission risk over time and not merely concerted efforts at hospitals to limit readmissions in the 30-day post-discharge period (23-25). The larger relative declines in this early post-discharge period are consistent with the hypothesis that hospitals instituted policies that early on that dissipated in their effect later after discharge. An alternative explanation is that earlier readmission risk is more amenable to the risk reduction strategies employed by hospitals, such as better transitions (4,6). Notably, we did not observe a higher rate of post-30-day readmissions that would offset reductions in readmissions in the 30-day period following discharge, and readmissions actually decreased beyond the 30-day threshold across the study period. Further, there was modestly higher early post-discharge mortality for heart failure and pneumonia in 2015-2016, the post-discharge phase with the highest mortality in 2008-2009. This observation is consistent with other studies that have found an increase in post-discharge mortality for these conditions (2,9). Notably, however, differences across the 8-year period were small relative to changes in readmissions, and their patterns did not follow those of readmissions, which continued to be lower late into or beyond the 30-day post-discharge period.
The findings of the study are reassuring in that they do not indicate abrupt changes in readmission rates past the HRRP period of observation. The HRRP, which is set to expand to a broader range of hospital conditions (26), is intended to spur the development of systems of care to better deliver transitions of care to patients being discharged from the hospital. Attempts by hospitals to pursue other measures to lower readmissions through deferring of required readmissions would represent a deviation from the spirit of the program and possibly place patients in jeopardy. The absence of such effects at hospitals that were vulnerable to penalties, such as those who already received these penalties in preceding years, and those serving low-income patients, argues against such practices being prevalent.
The study has several limitations. First, our assessment does not account for specific patient care scenarios where required hospitalizations for patients were deferred due to the effects of the program. We can, however, conclude that such examples do not represent a systematic effect at US hospitals and likely do not underlie the changes in readmissions observed nationally. If there was a widespread deferral of 30-day readmissions through a selective utilization of outpatient clinics, observation stays and emergency department in the first 30-day period following discharge, the current analysis would be expected to identify changes in readmission risk across the 30-day threshold. We did not, however, evaluate changes in patterns of care in these alternative care settings in the current study. Second, low volume hospitals are likely to have substantial noise and increase the risk of type II error. We dealt with these potential challenges by setting a volume threshold for hospitals, assessing cumulatively the readmission and mortality risk over an 8-year period, and through sensitivity analyses that attested to the robustness of our modelling and its ability to detect small changes in readmissions and mortality despite the statistical noise. Finally, there may be temporal changes in practices at hospitals that may potentially affect our assessments. However, we found a similar distribution of readmission and mortality across the 60-day period for all years in our study. We also used claims codes and risk-adjustment models that have been validated across the transition in coding strategy in administrative claims from ICD-9-CM to ICD-10-CM to ensure patient populations were consistent across the study years (27). Moreover, sensitivity analyses that focused on shorter periods of observation, such as the most contemporary 3-year period of observation, and periods before HRRP, after its announcement and after the implementation of its penalties, confirmed the observations of our primary analyses.
Conclusions
In recent years, fewer Medicare beneficiaries discharged from US hospitals after AMI, HF and pneumonia have been readmitted both during and beyond the 30-day post-discharge period. There was no evidence for an unexpected increase in readmissions beyond 30 days, or any unexpected excess mortality. This finding is consistent with an effect of the policy that is associated with a generalized reduction in readmission risk rather than a deferral of readmission until after the HRRP observation period.
Supplementary Material
Clinical Perspectives.
Competency in Systems-Based Practice:
Reducing hospital readmission remands comprehensive improvement in care delivery rather than delaying or avoiding necessary hospitalization. This might be achieved by modeling care practices at hospitals with low or improved rates of readmission.
Translational Outlook:
A mixed methods framework that evaluates care practices at hospitals successful in reducing readmission and mortality might elucidate the best approach to improving quality of care and clinical outcomes.
Funding:
Dr. Khera is supported by the National Center for Advancing Translational Sciences (UL1TR001105) of the National Institutes of Health. The funder had no role in the design and conduct of the study; collection, management, analysis, and interpretation of the data; preparation, review, or approval of the manuscript; and decision to submit the manuscript for publication.
Disclosures:
Dr. Krumholz is a recipient of research grants, through Yale, from Medtronic and Johnson & Johnson (Janssen) to develop methods of clinical trial data sharing and from Medtronic and the US Food and Drug Administration to develop methods for post-market surveillance of medical devices. Drs. Krumholz and Lin, and Mr. Wang work under contract with the Centers for Medicare & Medicaid Services to develop and maintain performance measures that are publicly reported. Dr. Krumholz chairs a Cardiac Scientific Advisory Board for UnitedHealth; is a participant/participant representative of the IBM Watson Health Life Sciences Board; is a member of the Advisory Board for Element Science and the Physician Advisory Board for Aetna; and is the founder of Hugo, a personal health information platform. The other authors report no potential conflicts of interest.
ABBREVIATIONS
- AMI
acute myocardial infarction
- CMS
Center for Medicare and Medicaid Services
- DSH
Disproportionate Share Hospitals
- HF
heart failure
- HRRP
Hospital Readmissions Reduction Program
Footnotes
Publisher's Disclaimer: This is a PDF file of an unedited manuscript that has been accepted for publication. As a service to our customers we are providing this early version of the manuscript. The manuscript will undergo copyediting, typesetting, and review of the resulting proof before it is published in its final citable form. Please note that during the production process errors may be discovered which could affect the content, and all legal disclaimers that apply to the journal pertain.
References
- 1.Zuckerman RB, Sheingold SH, Orav EJ, Ruhter J, Epstein AM. Readmissions, observation, and the Hospital Readmissions Reduction Program. N Engl J Med 2016;374:1543–51. [DOI] [PubMed] [Google Scholar]
- 2.Khera R, Dharmarajan K, Wang Y, et al. Association of the hospital readmissions reduction program with mortality during and after hospitalization for acute myocardial infarction, heart failure, and pneumonia. JAMA Network Open 2018;1:e182777. [DOI] [PMC free article] [PubMed] [Google Scholar]
- 3.McIlvennan CK, Eapen ZJ, Allen LA. Hospital Readmissions Reduction Program. Circulation 2015;131:1796–803. [DOI] [PMC free article] [PubMed] [Google Scholar]
- 4.Dharmarajan K, Hsieh AF, Kulkarni VT et al. Trajectories of risk after hospitalization for heart failure, acute myocardial infarction, or pneumonia: retrospective cohort study. BMJ 2015;350:h411. [DOI] [PMC free article] [PubMed] [Google Scholar]
- 5.Krumholz HM, Hsieh A, Dreyer RP, Welsh J, Desai NR, Dharmarajan K. Trajectories of Risk for Specific Readmission Diagnoses after Hospitalization for Heart Failure, Acute Myocardial Infarction, or Pneumonia. PLoS One 2016;11:e0160492. [DOI] [PMC free article] [PubMed] [Google Scholar]
- 6.Krumholz HM. Post-hospital syndrome--an acquired, transient condition of generalized risk. N Engl J Med 2013;368:100–2. [DOI] [PMC free article] [PubMed] [Google Scholar]
- 7.Gupta A, Fonarow GC. The Hospital Readmissions Reduction Program: Evidence for Harm. JACC Heart Fail 2018;6:607–609. [DOI] [PubMed] [Google Scholar]
- 8.Gupta A, Fonarow GC. The Hospital Readmissions Reduction Program-learning from failure of a healthcare policy. Eur J Heart Fail 2018;20:1169–1174. [DOI] [PMC free article] [PubMed] [Google Scholar]
- 9.Wadhera RK, Joynt Maddox KE, Wasfy JH, Haneuse S, Shen C, Yeh RW. Association of the Hospital Readmissions Reduction Program With Mortality Among Medicare Beneficiaries Hospitalized for Heart Failure, Acute Myocardial Infarction, and Pneumonia. JAMA 2018;320:2542–2552. [DOI] [PMC free article] [PubMed] [Google Scholar]
- 10.Centers for Medicare and Medicaid Services. Hospital Compare datasets. 2018. Available at: https://data.medicare.gov/data/hospital-compare. Accessed on Decemebr 15, 2018.
- 11.Centers for Medicare and Medicaid Services. Outcome Measures. Centers of Medicare and Medicaid Services, Baltimore, MD. 2017. Accessed February 5, 2018 at https://www.cms.gov/Medicare/Quality-Initiatives-Patient-Assessment-Instruments/HospitalQualityInits/OutcomeMeasures.html. [Google Scholar]
- 12.Centers for Medicare and Medicaid Services. Hospital Quality Initiative - Measure methodology. Centers for Medicare and Medicaid Services. Baltimore, MD. 2017. Accessed December 25, 2017 at https://www.cms.gov/Medicare/Quality-Initiatives-Patient-Assessment-Instruments/HospitalQualityInits/Measure-Methodology.html. [Google Scholar]
- 13.Hastie TJ. Generalized additive models. Statistical models in S: Routledge, 2017:249–307. [Google Scholar]
- 14.Cattaneo MD, Frandsen BR, Titiunik R. Randomization inference in the regression discontinuity design: An application to party advantages in the US Senate. Journal of Causal Inference 2015;3:1–24. [Google Scholar]
- 15.Imbens GW, Lemieux T. Regression discontinuity designs: A guide to practice. Journal of econometrics 2008;142:615–635. [Google Scholar]
- 16.Calonico S, Cattaneo MD, Titiunik R. Robust data-driven inference in the regression-discontinuity design. Stata Journal 2014;14:909–946. [Google Scholar]
- 17.Gelman A, Imbens G. Why high-order polynomials should not be used in regression discontinuity designs. Journal of Business & Economic Statistics 2018:1–10. [Google Scholar]
- 18.Cattaneo MD, Titiunik R, Vazquez-Bare G. Power calculations for regression discontinuity designs. The Stata Journal 2017. [Google Scholar]
- 19.Gupta A, Allen LA, Bhatt DL et al. Association of the Hospital Readmissions Reduction Program implementation with readmission and mortality outcomes in heart failure. JAMA Cardiol 2018;3:44–53. [DOI] [PMC free article] [PubMed] [Google Scholar]
- 20.Medicare Payment Advisory Commission. Mandated report: The effects of the Hospital Readmissions Reduction Program. 2018. Available at: http://www.medpac.gov/docs/default-source/reports/jun18_ch1_medpacreport_sec.pdf?sfvrsn=0. Accessed August 22, 2018.
- 21.Kini V, Peterson PN, Spertus JA et al. Clinical Model to Predict 90-Day Risk of Readmission After Acute Myocardial Infarction. Circ Cardiovasc Qual Outcomes 2018;11:e004788. [DOI] [PMC free article] [PubMed] [Google Scholar]
- 22.Dharmarajan K, Hsieh A, Dreyer RP, Welsh J, Qin L, Krumholz HM. Relationship Between Age and Trajectories of Rehospitalization Risk in Older Adults. J Am Geriatr Soc 2017;65:421–426. [DOI] [PMC free article] [PubMed] [Google Scholar]
- 23.Bradley EH, Curry L, Horwitz LI et al. Hospital strategies associated with 30-day readmission rates for patients with heart failure. Circ Cardiovasc Qual Outcomes 2013;6:444–50. [DOI] [PMC free article] [PubMed] [Google Scholar]
- 24.Bradley EH, Sipsma H, Horwitz LI, Curry L, Krumholz HM. Contemporary data about hospital strategies to reduce unplanned readmissions: what has changed? JAMA Intern Med 2014;174:154–6. [DOI] [PMC free article] [PubMed] [Google Scholar]
- 25.Khera R, Pandey A. The heart failure readmission quagmire: taking a deep dive to find solutions. Eur J Heart Fail 2018;20:315–316. [DOI] [PubMed] [Google Scholar]
- 26.Khera R, Horwitz LI, Lin Z, Krumholz HM. Publicly Reported Readmission Measures and the Hospital Readmissions Reduction Program: A False Equivalence? Ann Intern Med 2018;168:670–671. [DOI] [PMC free article] [PubMed] [Google Scholar]
- 27.Khera R, Dorsey KB, Krumholz HM. Transition to the icd-10 in the united states: An emerging data chasm. JAMA 2018;320:133–134. [DOI] [PubMed] [Google Scholar]
Associated Data
This section collects any data citations, data availability statements, or supplementary materials included in this article.


