Abstract
Onsite rapid detection of herbicides and herbicide residuals in environmental and biological specimens are important for agriculture, environmental concerns, food safety, and health care. The traditional method for herbicide detection requires expensive laboratory equipment and a long turnaround time. In this work, we developed a single-stripe microliter plate smartphone-based colorimetric device for rapid and low-cost in-field tests. This portable smartphone platform is capable of screening eight samples in a single-stripe microplate. The device combined the advantages of small size (50 × 100 × 160 mm3) and low cost ($10). The platform was calibrated by using two different dye solutions, i.e. methyl blue (MB) and rhodamine B, for the red and green channels. The results showed good correlation with results attained from a traditional laboratory reader. We demonstrated the application of this platform for detection of the herbicide 2,4-dichlorophenoxyacetic acid in the range of 1 to 80 ppb. Spiked samples of tap water, rat serum, plasma, and human serum were tested by our device. Recoveries obtained varied from 95.6% to 105.2% for all of the spiked samples using the microplate reader and from 93.7% to 106.9% for all of the samples using the smartphone device. This work validated that the smartphone optical-sensing platform is comparable to the commercial microplate reader; it is eligible for onsite, rapid, and low-cost detection of herbicides for environmental evaluation and biological monitoring.
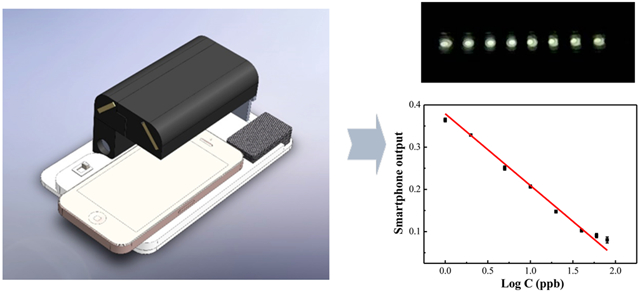
Graphical Abstract
The common herbicide 2,4-dichlorophenoxyacetic acid (2,4-D) is used for the selective control of broadleaf plants.1 As part of the phenoxyacetic acid family, this herbicide has been extensively utilized worldwide since 1945 for preventing early fruit peeling and controlling broadleaf weed growth. As an auxin-type herbicide, 2,4-D kills broadleaf weeds by causing water and nutrient-carrying cells in weed tissues to divide and grow uncontrollably.
During their long use, the phenoxyacetic acid herbicides have undergone extensive toxicity testing and pharmacokinetic analysis in numerous aquatic and mammalian species.2,3 Some ester forms of 2,4-D have been observed to be toxic to aquatic organisms, in which the sensitivity to toxicity increases as the water temperature rises. With regards to mammalian health effects, 2,4-D has been extensively studied for both toxicological concerns and species-specific pharmacokinetics, in addition to environmental and internal dosimetry evaluations.4-6 Experimental animal studies showed dose-dependent adverse effects in the thyroid as well as the eyes, kidneys, adrenals, and ovaries. Delayed neurobehavioral development and changes in neurotransmitter concentrations in offspring were also observed in animals that were exposed to 2,4-D during pregnancy or lactation after gavages.4 Dogs and cats that ingested food or water contaminated with high concentrations of 2,4-D developed acute toxicity symptoms including vomiting, diarrhea, loss of appetite, lethargy, drooling, staggering, or convulsions.5 Herein, the detection of 2,4-D in drinking water is of great importance for environmental monitoring and public health care.
2,4-Dichlorophenoxyacetic acid is an ideal pesticide for biomonitoring investigations because it is rapidly absorbed from the oral route, it has a short plasma half-life, it is not metabolized to any significant extent in rats or humans, and methods have been established for its analysis in blood and urine.6,7 In addition, 2,4-D is rapidly cleared in most species by an active renal-transport mechanism, although the dog is a notable exception.6-8 Humans can be exposed to 2,4-D through dermal contact with plants post application by handling products containing 2,4-D, directly dropping onto the skin, breathing it in during spray operations, or eating or drinking contaminated food products (i.e., unwashed fruits and vegetables). Due to the widespread utilization of 2,4-D for the control of weeds, the detection of 2,4-D in biological samples, especially in blood and noninvasively in saliva, is of great significance for quantitative biological monitoring in support of exposure surveillance and epidemiology investigations.6,7
Historically, many classical analytical methods have been used for agricultural chemical detection, such as traditional electrochemistry,8 chromatography,9,10 Raman spectrometry,11 and fluorescence spectrophotometry.12 In the past few years, different novel methods, such as applying nanomaterials, have been utilized by our group for biological monitoring, thus improving sensitivity.13-18 However, these methods still have a number of requirements, such as a lengthy amount of time and expensive and bulky laboratory equipment, which limit the ability of these techniques for rapid onsite determination.
In recent years, developing smartphone-based, portable, and low-cost devices have attracted the attention of many researchers. The smartphone is a multifunctional platform with high-speed computing capability and a high-quality camera. Although smartphones have broad applications as a communication tool, they are now being adapted as sensing platforms offering greater accessibility and significant financial savings over traditional laboratory instruments.19 For those reasons, the smartphone-based portable device has a promising potential for onsite sensing applications. Recently, several different types of smartphone detection devices have been developed.20 Examples of these include smartphone microscopes,21-23 fluorescence readers,24 test strip readers,25 microfluidic chip readers,26,27 optical spectrum readers,28 and colorimetric readers.29 Among them, colorimetric readers have attracted many researchers because of the simple designs and operation. For smartphone-based colorimetric readers, light-emitting diodes (LEDs) are commonly used as the illumination light source, and the camera in the smartphone is used as the optical sensor, which makes the device less expensive and accessible to everyone. Recently, several smartphone-based colorimetric devices for ELISA applications have been reported. For example, as demonstrated by Tang et al., current optical sensors were placed on the top of smartphone screens which can sense light from 340 to 680 nm. Various analytical targets were detected through this platform.30 Aung Thiha and Fatimah Ibrahim have applied absorption spectrophotometry to measure the absorbance of a sample using a monochromatic light source and optical sensor with a Lab-on-Compact Disc (LOCD) ELISA platform for dengue detection.31 H.T. Luong’s group developed a simple hollow case as a holder to place the smartphone for a 96-well microplate colorimetric signal reading. It allows for the smartphone camera to capture the image of the yellow color of the microplate directly for ELISA bioanalytical applications.32,33 In order to improve the accuracy of detection, a smartphone-based microplate reader was developed by us to read the colorimetric signals of a 64-well microliter plate.34 LEDs were used as the illumination light source for the devices, and the camera in the smartphone is used as the optical sensor; in all, complex mechanical designs were avoided by using a smaller and lower cost design. Ozcan and his co-workers used a LED array to illustrate the 96-well plate and then collected readings via individual optical fibers. Through a smartphone application (app), diagnostic results were delivered to the user for ELISA clinical detection.35 Compared to the traditional laboratory microplate reader, which uses an expensive mechanism to scan and read multiple wells one by one, this kind of imaging-based device can read all of the samples at the same time. However, for many applications, fewer numbers of samples are analyzed. For instance, an eight-well stripe is commonly used instead of a whole microliter plate.
In this work, a compact, smartphone-based, single-stripe colorimetric reader is designed and tested. Compared to a microplate reader, the single-stripe reader has a smaller size, lighter weight, and lower cost, and it is more convenient for in-field applications. A single image of eight samples is taken by using our designed smartphone optical platform. Based on the competitive ELISA kit, we realized the quick and low-cost determination of 2,4-D at room temperature within 2 h. The smartphone reader was validated by using spiked samples, i.e. groundwater, human and rat blood, and urine samples. The results obtained by our portable device are comparable to the results obtained by a standard microplate reader; hence, it can be applied to biological monitoring and analysis in the field.
EXPERIMENTAL SECTION
Design and Fabrication of the Smartphone Optical Reader.
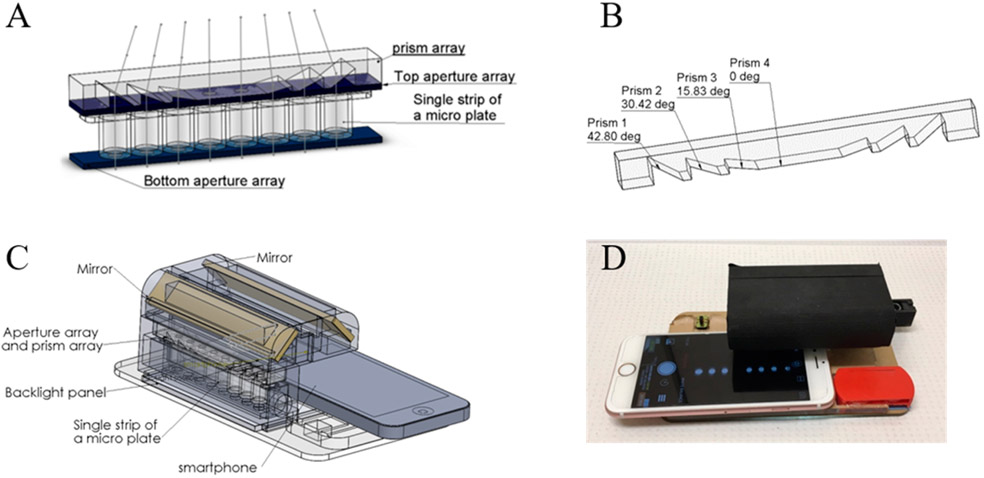
For high-accuracy and high-sensitivity measurements of multiple samples in a single microplate stripe, light must go through each well vertically, and all other light must be blocked from the camera. For this purpose, two aperture arrays (eight 5 mm diameter apertures in each array) were designed. One of the aperture arrays is placed beneath the microplate stripe, and the other is placed right above the stripe (Figure 1A). With the aperture arrays, signals from wells will also be partially or fully blocked when the camera is used to take a picture.32 To see all of the wells in one image without scanning, a prism was designed to tilt light from each well and to direct to the smartphone camera (Figure 1). The prism angles and light-deviation angles are shown in Figure 1B and Table 1.
Figure 1.
(A) Configuration of the aperture arrays, microplate stripe, and prism array. (B) Structure of the prism array. (C) Three-dimensional structure of the smartphone-based single-stripe microplate reader. (D) Actual device with an iPhone 6s for image acquisition. (The strip was partially slid out in Figure 1D to indicate the entrance for the strip; thus not all eight wells were shown in the smartphone screen.)
Table 1.
Light-Deviation Angles and Prism Angles of the Prism Array
| light deviation angle | 18.64° | 12.68° | 6.4° | 0° | 0° | 6.4° | 12.68° | 18.64° |
| prism angle | 42.80° | 30.42° | 15.83° | 0° | 0° | 15.83° | 30.42° | 42.80° |
For a compact and portable device, two mirrors were used to bend the light path and guide the light signals to the front camera of the smartphone (Figure 1C). No smartphone holder was used, and theoretically, any smartphone with a front camera can be used in this current device. Three miniature LED light bulbs were used as the light source, and two 1.5 V button batteries provided the power for the lights. The LED lights and batteries were embedded into an acrylic board that was placed above the base board. The backside flash light on the smartphone can also be used as the light source with a control app to turn on the backside flash light while working with the front camera. In that way, the cost and size of the device can be further reduced. To generate a uniform light field, a backlight panel was placed under the bottom aperture array and the LED lights in order to illuminate the backlight panel from one side. The single stripe will be placed into a stripe holder and can slide in and out of the device from one end. The base board, light-source board, and aperture arrays were laser cut from acrylic boards. The prism array was made by casting and curing polydimethylsiloxane (PDMS, SYLGARD, Dow Corning) on a laser-cut prism-array mold. Other components were 3D printed (uPrint SE, Stratasys, Eden Prairie, MN, U.S.A.) and assembled. The device has a height of 50 mm, a width of 100 mm, and a length of 160 mm. The manufacturing and material cost of the device is about $10.
Image Capture and Analysis.
In this work, an iPhone 6s (Apple, Inc., Cupertino, CA, U.S.A.) smartphone with a 5-mega-pixel front-facing camera was used with the reader (Figure 1D). A free mobile app Yamera (AppMadang) was used in the acquisition of images. With this app, we were able to control the exposure time (shutter time), ISO value, and white balance for consistent conditions. During the experiment, the exposure time was fixed as 1/107 s, and the white-balance temperature and tint were fixed at 5882 and 6, respectively. Different ISO values were used to compare the effects of acquisition conditions on the accuracy and sensitivity of the device. Three images were taken each time, and the average intensity of these images was used as the final result.
For image analysis, a Matlab (Mathworks, Natick, MA, U.S.A.) program was developed to automatically calculate the mean light intensity of each well in the images. The Matlab program output the mean-intensity values of the red, green, and blue (RGB) channels of each well. The absorbance of the sample was calculated by using eq 1:
| (1) |
where A is the absorbance, T is the mean intensity of the sample, and T0 is the mean intensity of the reference obtained under the same image-capture conditions.
Preparation of Two Serial Color Dye Solutions and Calibration of the Smartphone Reader.
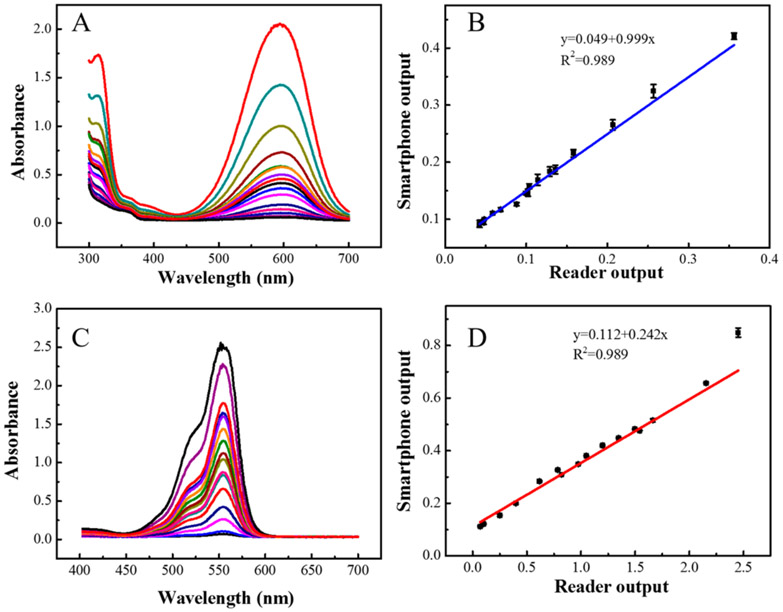
The center wave-length can be different for different cameras, and the details about an iphone 6s camera is unknown. To calibrate the performance of the reader, we separately calibrate the Red, Green, and Blue channel. Methyl blue and Rhodamine B are commonly used dyes. Methyl blue has an absorbance peak at 604 nm, and Rhodamine B has a peak absorbance at 558 nm. These two absorbance peaks are close to the center wavelength of Red and Green channels; thus, those two dyes were selected to calibrate the Red and Green channels. For red channel, Methyl blue (≥98%, peak absorption at 604 nm), which was purchased from Sigma-Aldrich (St. Louis, MO, USA), was serially diluted with DI water from 0 to 50 μg/mL with 16 samples. Deionized (DI) water was used as the blank control. For green channel, Rhodamine B (RhB, ≥ 95%, peak absorption at 558 nm) was purchased from Sigma-Aldrich (St. Louis, MO, USA). It was serially diluted in Deionized (DI) water from 0 to 20 μg/mL with 16 samples. The samples were read by using both the smartphone single-stripe reader and a laboratory microplate reader (Tecan Safire2, Männedorf, Switzerland). From Figure 2B,D, it shows that the results obtained by the smartphone device exhibited a good correlation to the results obtained by the laboratory microplate reader. The linear regression shown in figures revealed that the smartphone-based device has good detection ability to standard dye solutions.
Figure 2.
(A) UV spectrum with different concentrations of methyl blue obtained by a laboratory microplate reader. (B) Correlation of results obtained by laboratory microplate reader and the smartphone single-stripe reader using the red channel. (C) UV spectrum with different concentrations of rhodamine B obtained by a laboratory microplate reader. (D) Correlation of results obtained by using a laboratory microplate reader and the smartphone single-stripe reader using the green channel.
Principle and Fabrication Process of the 2,4-D Immunosensor.
The commercial 2,4-D ELISA kit was purchased from Abraxis Inc. (Warminster, PA). All of the reagents mentioned below were provided by kits. The test is based on a direct competitive ELISA for the specific recognition of antibodies toward 2,4-D. Before the experiment, a secondary antibody (goat anti-mouse) had been immobilized on the commercial wells of the microliter plate. Then 2,4-D and HRP labeled 2,4-D (2,4-D-HRP) analogue compete for the binding sites of the mouse anti-2,4-D antibodies in the solution and bound to the second antibody conjugated on the well. After a washing step and addition of the color solution which contains TMB (3,3’,5,5’-Tetramethylbenzidine) and H2O2, a blue color signal is generated for the HRP (horseradish peroxidase) catalytic reaction. The color reaction is stopped after adding the stop solution at a specified time. Then the color is evaluated using a laboratory microplate reader and the device. The intensity of the yellow color is inversely proportional to the concentration of 2,4-D present in the sample.
The commercial 2,4-D ELISA kit has 96 wells which can be broken into 12 single stripes. For the fabrication process, the experiment followed the assay protocol with minor modification. First, we add a mixture solution of 50 μL of standard 2,4-D solutions of different concentrations, 50 μL of 2,4-D-HRP solution, and 50 μL of antibody solution into each well of an eight-well stripe. After 75 min incubation at room temperature with a cover, the wells were washed three times with 250 μL of 5-times diluted washing buffer. The remaining washing buffer in the well was removed by patting the plate inversely and dried on a stake of paper towels. Then 150 μL of color solution which contains H2O2 and TMB color reaction system were added into each well and incubated for 15 min at room temperature. After that, 100 μL of stop solution were added into each well and the stripe was ready for reading, the color was changed from blue to yellow. For the blue channel, TMB with stop solution, with a peak absorbance at 405 nm, was used to calibrate.
Real Sample Analysis with the Proposed Device on Commercial 2,4-D Kit.
Four different matrices were evaluated for 2,4-D detection and quantification. Since 2,4-D in tap water can lead to drinking water exposure, by monitoring 2,4-D in tap water, we can determine if the water system had been polluted. For biological monitoring, the detection of 2,4-D in blood can be used as an indicator of 2,4-D exposure. In this work, tap water was obtained from the lab tap of Washington State University. The real blood samples (rat plasma, rat serum, human serum) were purchased from bioreclamation IVT. All the blood samples are obtained from pooled gender and not filter treated rat plasma, disodium EDTA was used as anticoagulant. The samples used in our work for detection were original solution without any dilution. All spiked samples were prepared by the standard addition method. A range of 2,4-D concentrations were spiked into tap water and blood samples. By substituting the readouts into the linear relationships obtained, the concentrations of spiked 2,4-D can be calculated. The concentration found by smartphone device or microplate reader were the average value obtained from three times of calculation. Recovery rate is calculated by dividing the calculated concentrations by the original concentrations of the spiked samples.
RESULTS AND DISCUSSION
Optimization of 2,4-D Kit Conditions.
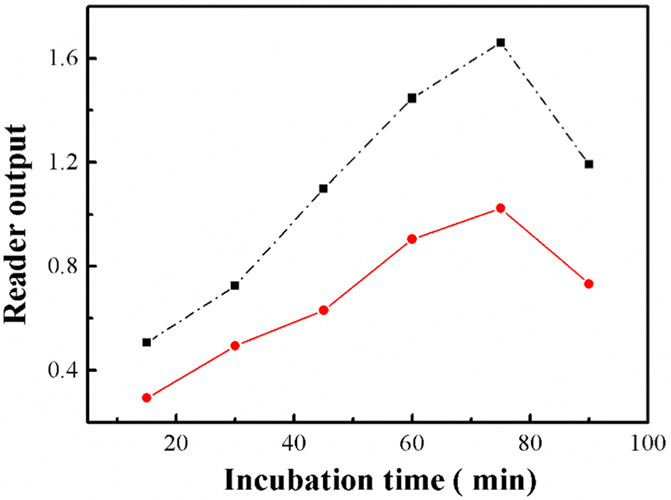
Since the incubation time of the mixture is critical to the binding of the targets and antibody on the plate, it can affect the final performance of the immunosensor. Therefore, a control group (0 ppb, 2,4-D) and an experimental group (5 ppb, 2,4-D) were investigated simultaneously to evaluate the final output on traditional microplate reader. We tested the incubation time of the 2,4-D kit from 15 to 90 min. As shown in Figure 3, the results suggested that with the incubation time increased from 15 to 75 min, the reader-output value of the control and experimental group kept increasing in a similar trend up to 75 min, but as the time increased from 75 to 90 min, the reader-output value of the control and the experimental group both decreased. One possible reason for the decrease of signal is because of the activity of the antibody decreased with the prolonging of incubation time. with the reaction time extending. The largest difference was observed at 75 min. As a result, in our experiment, 75 min was chosen as the best incubation time for the competitive ELISA reaction.
Figure 3.
Effects of conjugation time to absorbance output on laboratory microplate reader for detection of 5 ppb of 2,4-D (black dashed line: 0 ppb 2,4-D; red line, 5 ppb 2,4-D).
ISO Optimization of Smartphone Optical-Sensing Platform for 2,4-D Kit.
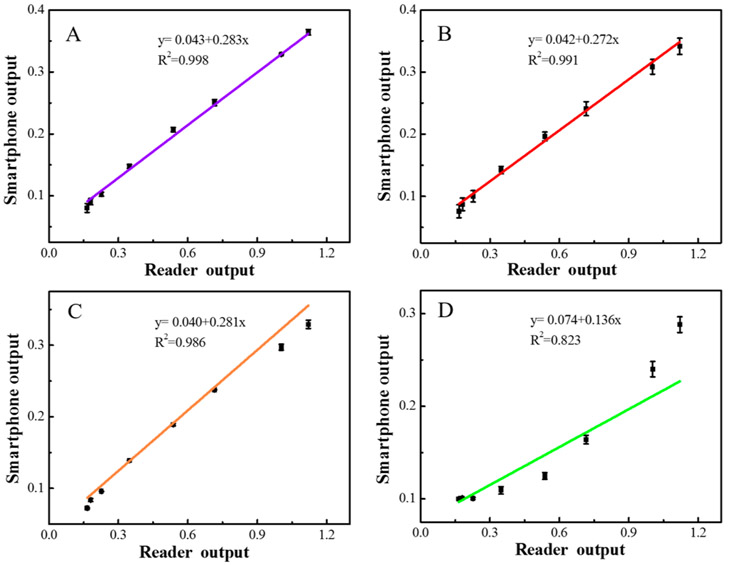
To get the best photographing conditions, we chose several different ISO values to identify the best detection conditions for 2,4-D using the blue channel. A series of ISO values from 132–230 and 344–601 were tested (all other factors such as exposure time and white balance were fixed). The measurement results are shown in Figure 4, and the optimized ISO value is 132. When ISO is lower than 132, the overall light intensity became low, and the background was interferential. When the ISO is higher than 132, the linear correlation coefficients gradually decreased, especially after 601, and the linear correlations of data between the smartphone and reader were poor. Therefore, an ISO value of 132 was chosen for the best linear-detection conditions. As can be seen in Figure 4, the smartphone device readout range is small (~0.1–0.4) compared to the range of the commercial reader (~0.1–1.2). This is the limitation of the low-cost smartphone camera sensor and may result in lower resolution compared to that of the commercial reader.
Figure 4.
Calibration of the blue channel between smartphone-based device output and reader output for the detection of 2,4-D. (A) ISO 132. (B) ISO 230. (C) ISO 344. (D) ISO 601.
2,4-D Kit Linear Detection with the Smartphone Platform and the Commercial Microplate Reader.
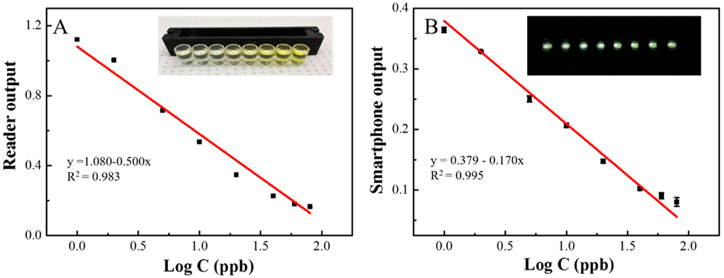
Under the above optimized incubation time and detection ISO, a series of different concentrations of standard 2,4-D samples were detected by our device under optimum detection conditions. With increasing analyte concentration, as shown in Figure 5A, from right to left, the color tends to be lighter, from deep yellow to light yellow. With lower concentrations of 2,4-D, more of the 2,4-D-HRP analogue bound with the mouse anti-2,4-D antibodies were immobilized on the wells of the microliter plate. Higher signal was attained for the catalytic HRP to the color solution (TMB and H2O2). With increasing 2,4-D concentration, more of the 2,4-D will compete with the 2,4-D-HRP analogue to conjugate with mouse anti-2,4-D antibodies and a second antibody (goat anti-mouse). Less of the 2,4-D-HRP will be bound to the well, and any excess will be removed during washing (3×). Hence, the signal response is inversely related to 2,4-D concentration. The results obtained by smartphone showed a good linear relationship with the logarithm concentration of 2,4-D, and this relationship is comparable to the absorbance measured by a standard microplate reader with 2,4-D concentrations ranging from 1 to 80 ppb. The linear coefficient of the standard reader is y = 1.080–0.500·logC (R2 = 0.983), while the coefficient of the smartphone device is y = 0.379–0.170·logC (R2 = 0.995).
Figure 5.
(A) Linear relationship between microplate reader output vs the logarithm of target concentration. Inset: visual figure of single stripe vs different concentrations of target 2,4-D (B) Linear relationship between smartphone output vs the logarithm of target concentration. Inset: smartphone image of single stripe vs different concentrations of target 2,4-D (from left to right: 80, 60, 40, 20, 10, 5, 2 and 1 ppb).
Spiked Sample Detection of 2,4-D with the Smartphone Platform and Microplate Reader.
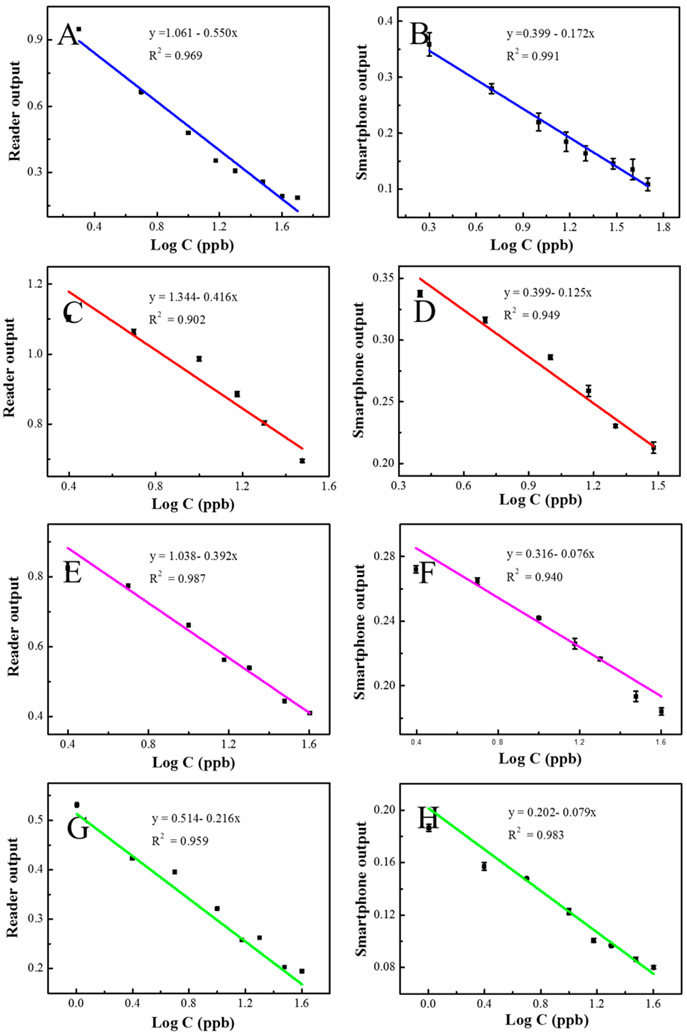
As shown in Figure 6A,B and Table 2, for the tap water samples, there is a good linear relationship for both the smartphone readout and microplate reader readout vs the logarithm concentration of spiked 2,4-D from 2 to 50 ppb. Within this range, three different spiked tap water samples with different concentrations of 2,4-D were detected by using the standard microplate reader and the smartphone device. The recovery rates were in the range of 95.6–103.8% with relative standard deviations (RSDs) of 1.76–3.27% for the standard microplate reader, and 97.1–104.2% with RSDs of 3.29–5.04% for the smartphone-based device.
Figure 6.
Linear calibration of microplate reader output vs the logarithm of target concentration in (A) tap water, (C) rat serum, (E) rat plasma, and (G) human serum. Linear calibration of smartphone-based device output vs the logarithm of target concentration in (B) tap water, (D) rat serum, (F) rat plasma, and (H) human serum.
Table 2.
Spiked Real Sample Analysis on Designed Smartphone-Based Device
| sample | linear range (ppb) |
spike (ppb) |
found by reader (ppb) |
found by smartphone (ppb) |
reader recovery % | smartphone recovery % | RSD (reader) % (n = 3) |
RSD (smartphone) % (n = 3) |
|---|---|---|---|---|---|---|---|---|
| tap water | 2–50 | 5 | 5.19 | 4.92 | 103.8 | 98.4 | 1.76 | 3.29 |
| 10 | 10.27 | 10.42 | 102.7 | 104.2 | 2.74 | 4.22 | ||
| 30 | 28.68 | 29.12 | 95.6 | 97.07 | 3.27 | 5.04 | ||
| rat serum | 2–40 | 5 | 5.24 | 5.18 | 104.8 | 103.6 | 2.62 | 4.78 |
| 10 | 9.62 | 9.37 | 96.2 | 93.7 | 3.54 | 2.46 | ||
| 20 | 19.61 | 19.48 | 98.05 | 97.4 | 4.12 | 5.63 | ||
| rat plasma | 2.5–40 | 5 | 5.08 | 5.13 | 101.6 | 102.6 | 3.81 | 2.84 |
| 10 | 9.66 | 9.55 | 96.58 | 95.55 | 4.04 | 5.13 | ||
| 20 | 20.19 | 19.52 | 100.93 | 97.60 | 3.11 | 5.01 | ||
| human serum | 1–40 | 5 | 4.94 | 4.78 | 98.8 | 95.6 | 2.13 | 3.48 |
| 10 | 9.79 | 9.71 | 97.9 | 97.1 | 3.19 | 4.15 | ||
| 20 | 21.04 | 21.38 | 105.2 | 106.9 | 4.03 | 3.57 |
For blood samples, similar steps were followed for sample preparation and detection with the smartphone device and the laboratory microplate reader. As shown in Figure 6C,D, in rat serum sample, a linear relationship in the range of 5–40 ppb was obtained by the microplate reader, and a linear relationship in the range of 2 to 40 ppb was attained by the smartphone device. However, for the rat serum sample in Figure 6E,F, a good linear relationship in the range of 2.5–40 ppb was obtained by the microplate reader and the smartphone device. Similarly, in Figure 6G,H for human serum samples, a good calibration curve from 1–40 ppb was obtained both by the microplate reader and the smartphone device. For the recovery experiment, as shown in Table 2, high recovery rates were attained for spike sample detection in human and rat blood samples within the range of 96.2–105.2% with RSDs of 2.13–4.12% for the microplate reader, and within the range of 93.7–106.9% with RSDs of 2.46–5.63% for the smartphone device. The results obtained by two different methods showed similar recovery rates and narrow RSD ranges. Overall, these results demonstrated that our smartphone device has a high reliability, which is comparable to the commercial standard laboratory microplate reader.
Stability and Reproducibility of 2,4-D Detection on Smartphone Platform and Reader.
Six parallel tests were carried out to confirm the stability and reproducibility of our experiment and the feasibility of the smartphone-based device for determination. In comparison with the results obtained from the traditional reader, the smartphone-based device shows results with a deviation ranging from 1.3%–4.4% between groups and 2.1%–5.3% within groups after eight readings. The results support the claim that the smartphone-based device has high accuracy and good reproducibility.
CONCLUSIONS
In this work, a smartphone-based single-stripe reader for rapid in-field detection of herbicides was developed offering smaller size, lighter weight, lower costs, and most importantly it is designed for use in the field. A prism array was used to guide light from eight wells into the smartphone camera, and two mirrors were used to achieve a compact device. All of the components were assembled in a 3D-printed black box. Under the illumination of three mini LED light bulbs with two 1.5 V batteries, the device was validated with good sensitivity. Reliable linear relationships for detection were obtained with a series of standard dye solutions using rhodamine B and methylene blue. Afterward, the smartphone optical-sensing platform was put into practical application for 2,4-D detection using competitive ELISA. Different concentrations of 2,4-D from 1 to 80 ppb were detected with good linear relationships. Detection limits are down to 1 ppb, which is comparable with those of the laboratory reader. We also evaluated the device for spiked environmental (water) and biological samples (rat and human plasma/serum). The results showed high recovery rates. The repeatability test results showed that the smartphone device has a good reproducibility. The new smartphone-based device provides a good platform for in-field detection of herbicides which will have potential applications in environmental, public health monitoring, and disease prevention.
ACKNOWLEDGMENTS
This work was supported by the Centers for Disease Control and Prevention/National Institute for Occupational Safety and Health (CDC/NIOSH) Grant No. R01OH011023-01A1. Its contents are solely the responsibility of the authors and do not necessarily represent the official views of CDC. PNNL is operated by Battelle for US-DOE under Contract DE-AC05-76RL01830.
Footnotes
The authors declare no competing financial interest.
REFERENCES
- (1).Neely WB; Ball CD; Hamner CL; Sell HM Plant Physiol. 1950, 25 (3), 525. [DOI] [PMC free article] [PubMed] [Google Scholar]
- (2).Hardell L; Eriksson M Cancer 1999, 85 (6), 1353–1360. [DOI] [PubMed] [Google Scholar]
- (3).McDuffie HH; Pahwa P; McLaughlin JR; Spinelli JJ; Fincham S; Dosman JA; Robson D; Skinnider LF; Choi NW Cancer Epidemiol. Biomarkers Prev 2001, 10, 1155–1163. [PubMed] [Google Scholar]
- (4).Bortolozzi A; Duffard R; Antonelli M; de Duffard AME Ann. N. Y. Acad. Sci 2002, 965 (1), 314–323. [DOI] [PubMed] [Google Scholar]
- (5).Takashima-Uebelhoer BB; Barber LG; Zagarins SE; Procter-Gray E; Gollenberg AL; Moore AS; Bertone-Johnson ER Environ. Res 2012, 112, 171–176. [DOI] [PMC free article] [PubMed] [Google Scholar]
- (6).Kohli JD; Khanna RN; Gupta BN; Dhar MM; Tandon JS; Sircar KP Xenobiotica 1974, 4 (2), 97–100. [DOI] [PubMed] [Google Scholar]
- (7).Rawlings NC; Cook SJ; Waldbillig D J. Toxicol. Environ. Health, Part A 1998, 54 (1), 21–36. [DOI] [PubMed] [Google Scholar]
- (8).Wong A; Sotomayor MDPT Sens. Actuators, B 2013, 181, 332–339. [Google Scholar]
- (9).Hughes DL; Ritter DJ; Wilson RD J. Environ. Sci. Health, Part B 2001, 36 (6), 755–764. [DOI] [PubMed] [Google Scholar]
- (10).Thurman EM; Zimmerman LR; Aga DS; Gilliom RJ Int. J. Environ. Anal. Chem 2001, 79 (3), 185–198. [Google Scholar]
- (11).Jia J-L; Xu H-H; Zhang G-R; Hu Z; Xu B-Q Nanotechnology 2012, 23 (49), 495710. [DOI] [PubMed] [Google Scholar]
- (12).Wang X; Yu J; Wu X; Fu J; Kang Q; Shen D; Li J; Chen L Biosens. Bioelectron 2016, 81, 438–444. [DOI] [PubMed] [Google Scholar]
- (13).Zhang W; Asiri AM; Liu D; Du D; Lin Y TrAC, Trends Anal. Chem 2014, 54, 1–10. [Google Scholar]
- (14).Ge X; Tao Y; Zhang A; Lin Y; Du D Anal. Chem 2013, 85 (20), 9686–9691. [DOI] [PubMed] [Google Scholar]
- (15).Chen A; Du D; Lin Y Environ. Sci. Technol 2012, 46 (3), 1828–1833. [DOI] [PubMed] [Google Scholar]
- (16).Du D; Wang J; Wang L; Lu D; Lin Y Anal. Chem 2012, 84 (3), 1380–1385. [DOI] [PubMed] [Google Scholar]
- (17).Zou Z; Du D; Wang J; Smith JN; Timchalk C; Li Y; Lin Y Anal. Chem 2010, 82 (12), 5125–5133. [DOI] [PubMed] [Google Scholar]
- (18).Du D; Wang J; Smith JN; Timchalk C; Lin Y Anal. Chem 2009, 81 (22), 9314. [DOI] [PMC free article] [PubMed] [Google Scholar]
- (19).Choi J; Gani AW; Bechstein DJ; Lee J-R; Utz PJ; Wang SX Biosens. Bioelectron 2016, 85, 1–7. [DOI] [PubMed] [Google Scholar]
- (20).Roda A; Michelini E; Zangheri M; Di Fusco M; Calabria D; Simoni P TrAC, Trends Anal. Chem 2016, 79, 317–325. [Google Scholar]
- (21).Lee SA; Yang C Lab Chip 2014, 14 (16), 3056–3063. [DOI] [PMC free article] [PubMed] [Google Scholar]
- (22).Hutchison JR; Erikson RL; Sheen AM; Ozanich RM; Kelly RT Analyst 2015, 140 (18), 6269–6276. [DOI] [PubMed] [Google Scholar]
- (23).Lumetta GJ; Arcia E J. Chem. Educ 2016, 93 (10), 1754–1759. [Google Scholar]
- (24).Yu H; Tan Y; Cunningham BT Anal. Chem 2014, 86 (17), 8805–8813. [DOI] [PubMed] [Google Scholar]
- (25).Yu L; Shi Z; Fang C; Zhang Y; Liu Y; Li C Biosens. Bioelectron 2015, 69, 307–315. [DOI] [PubMed] [Google Scholar]
- (26).Barbosa AI; Gehlot P; Sidapra K; Edwards AD; Reis NM Biosens. Bioelectron 2015, 70, 5–14. [DOI] [PubMed] [Google Scholar]
- (27).Lopez-Ruiz N; Curto VF; Erenas MM; Benito-Lopez F; Diamond D; Palma AJ; Capitan-Vallvey LF Anal. Chem 2014, 86 (19), 9554–9562. [DOI] [PubMed] [Google Scholar]
- (28).Wang L-J; Chang Y-C; Sun R; Li L Biosens. Bioelectron 2017, 87, 686–692. [DOI] [PubMed] [Google Scholar]
- (29).Kwon L; Long KD; Wan Y; Yu H; Cunningham BT Biotechnol. Adv 2016, 34 (3), 291–304. [DOI] [PubMed] [Google Scholar]
- (30).Fu Q; Wu Z; Li X; Yao C; Yu S; Xiao W; Tang Y Biosens. Bioelectron 2016, 81, 524–531. [DOI] [PubMed] [Google Scholar]
- (31).Thiha A; Ibrahim F Sensors 2015, 15 (5), 11431–11441. [DOI] [PMC free article] [PubMed] [Google Scholar]
- (32).Vashist SK; Schneider EM; Zengerle R; von Stetten F; Luong JH Biosens. Bioelectron 2015, 66, 169–176. [DOI] [PubMed] [Google Scholar]
- (33).Vashist SK; van Oordt T; Schneider EM; Zengerle R; von Stetten F; Luong JH Biosens. Bioelectron 2015, 67, 248–255. [DOI] [PubMed] [Google Scholar]
- (34).Wang L-J; Sun R; Vasile T; Chang Y-C; Li L Anal. Chem 2016, 88 (16), 8302–8308. [DOI] [PubMed] [Google Scholar]
- (35).Berg B; Cortazar B; Tseng D; Ozkan H; Feng S; Wei Q; Chan RY-L; Burbano J; Farooqui Q; Lewinski M; et al. ACS Nano 2015, 9 (8), 7857–7866. [DOI] [PubMed] [Google Scholar]


