

Abstract
The role of sex, race, and suicide method on recent increases in suicide mortality in the United States remains unclear. Estimating the age, period, and cohort effects underlying suicide mortality trends can provide important insights for the causal hypothesis generating process. We generated updated age-period-cohort effect estimates of recent suicide mortality rates in the US, examining the putative roles of sex, race, and method for suicide, using data from all death certificates in the US between 1999 and 2018. After designating deaths as attributable to suicide according to ICD-10 underlying cause of death codes X60-X84, Y87.0, and U03, we (i) used hexagonal grids to describe rates of suicide by age, period, and cohort visually and (ii) modeled sex-, race-, and suicide method-specific age, period, and cohort effects. We found that, while suicide mortality increased in the US between 1999 and 2018 across age, sex, race, and suicide method, there was substantial heterogeneity in age and cohort effects by method, sex, and race, with a first peak of suicide risk in youth, a second peak in older ages—specific to male firearm suicide, and increased rates among younger cohorts of non-White individuals. Our findings should prompt discussion regarding age-specific clinical firearm safety interventions, drivers of minoritized populations’ adverse early-life experiences, and racial differences in access to and quality of mental healthcare.
Introduction
Suicide is the leading cause of violent death globally [1]. In the United States, roughly 50,000 people die by suicide annually and it is the fourth leading cause of years of life lost [2]. The societal impact of suicide is far-reaching and long lasting, spreading across families and communities over generations, while driving substantial emotional and economic costs.
Monitoring suicide mortality rates is paramount for guiding suicide prevention efforts. Additionally, detecting changes in time trends can generate new causal hypotheses. While global suicide mortality rates have decreased over the last three decades [3], rates in the United States have increased by 35% since 1999, representing an urgent public health crisis [1]. Though suicide mortality rates in the US are on the rise across all sociodemographic groups and methods for suicide, recent increases have been most salient among females and males aged 10–44 years, and males aged >64 years, as well as in predominantly rural counties, and for non-firearm suicides [4, 5].
Suicide mortality trends are generally characterized across three effect groupings: age, period, and cohort [6]. Cohort effects measure the array of environmental exposures that individuals born within a given historical context share, and that may differ from those of people born into other contexts [7]. For instance, American baby boomer males (born between 1946 and 1964) have consistently been found to have higher suicide rates than other generations, across age and the specific time period under consideration [8]. Age effects result from biological and social factors specific to development, and period effects from external factors that impact subjects across age groups and cohorts equally within a given temporal moment.
Identifying and reporting separate estimates for age-period-cohort effects is a logical next step to time trends surveillance in the causal hypothesis generating process. Accordingly, age-period-cohort effects have been used to investigate the biological, social, cultural, and political causes of suicide rate variations [9–16]. In the US, research using suicide mortality data up to 2012 demonstrated different age effect patterns for Black and White populations [17]. However, the age-period-cohort effects of suicide among people of other races remain unexplored. In addition, examining suicide methods has potentially large clinical and public health implications, as the distribution of methods used largely explains the outcome of suicidal acts and suicide mortality trends [18]. A recent study analyzed data on adults aged 50–84 years who died by firearm suicide [19] and found a decreasing period effect in firearm suicide mortality among older adults. Notwithstanding, little is known about the age, period, and cohort effects underlying increasing trends of adult non-firearm suicide.
The objective of this study was to generate updated age-period-cohort effect estimates of suicide mortality rates in the US from 1999 to 2018 and to examine the putative roles of sex, race, and method for suicide.
Methods
Data source
Data were drawn from the US National Vital Statistics System and include data from all death certificates in the US from 1999 through 2018. Death certificates are filed with the State Vital Registration Office and comprise (i) basic demographic information, including age of death, sex, and race (using NCHS’s bridged categories: American Indian/Alaska Native, Asian/Pacific Islander, Black/African American, or White) [20]—provided by the deceased’s next of kin and (ii) medical information, including immediate and underlying cause/s of death—supplied by a physician, medical examiner, or coroner. Data are coded and transmitted electronically to the National Center for Health Statistics, where further curation and editing is conducted, cause of death is aggregated based on the International Classification of Disease, Tenth Revision (ICD-10), and national files for analysis and reporting are generated [20]. We designated deaths as attributable to suicide based on ICD-10 underlying cause of death codes X60-X84, Y87.0, and U03, which gathers information from both the listed cause and manner of death, following practices from the National Center for Health Statistics [4]. Suicide deaths were further coded based on the method used.
Statistical analysis
First, we used hexagonal grids to describe rates of suicide by age, period, and cohort visually, as proposed by Jalal et al. [21]. These grids overcome limitations of traditional graphical presentations of age, period, and cohort rates and present each data point (the suicide rate for a specific age at a specific year, and thereby for a specific cohort as Cohort = Period−Age) with hexagonal shape, with hexagonal grid pieces spaced at equal intervals allowing for an intuitive visual interpretation.
Age-period-cohort models were then estimated using methods proposed by Clayton and Schifflers and implemented with the APC package developed by Carstensen [22]. We first assessed suicide rates over time using categorical age as the only predictor. Then, the overall linear trend in rates was described using a “drift” parameter, which is the sum of the linear effects over time by period and cohort. The first deviations of the “drift” parameter were then estimated and uniquely attributed to specific periods and cohorts. These first deviations can be described using risk ratios, estimating the increase or decrease in the relative risk of suicide that is attributable to period and cohort. Model fit was assessed at each stage including age + drift compared to age alone, and then iteratively adding in cohort and period effects to determine if the model improved with additional parameters. Subsequently, each parameter was iteratively removed to assess whether model fit deteriorated following parameter removal. Models were estimated by firearm involvement, sex, and race. For main analyses, we used 2010 as reference period and 1960 as reference cohort. As a sensitivity analysis, we created animated graphs of APC figures for every possible reference cohort and period to determine whether results and interpretation would change if the referent group changed.
Code is available under request. Study procedures were approved by the Institutional Review Board at Columbia University Mailman School of Public Health.
Results
The modal method of suicide death was firearms (ranging from 56.8% of suicide deaths in 1999 to 49.8% in 2015). Other salient suicide methods were suffocation and poisoning.
Descriptive analyses
Figure 1 displays the rate of suicide in the US between 1999 and 2018 for men, stratified by firearm involvement, across age, period, and cohort. Supplementary Figs. S1–S4 provide further stratification by race. Suicide rates for each birth cohort can be visualized along the diagonal C isolines, with corresponding ages and periods along A and P isolines, respectively. In male firearm suicide, there was a clear age effect, with lower rates at young ages and higher rates at the oldest ages, regardless of cohort and time period. A period effect was also evident, as the suicide rate increased recently across ages, but especially among men aged between 40 and 70 years. Finally, the concentration of firearm suicides among men in their mid-life was particularly high for those born in the 1940s–1950s, indicating a cohort effect. For non-firearm suicides, rates were lower than for firearm suicide, yet trends were similar, save for the lack of excess deaths among older men. Age, period, and cohort effects were especially obvious in White men-specific maps (Supplementary Fig. S1).
Fig. 1. Suicide rates in the US from 1999 to 2018 for men, stratified by firearm involvement, across age, period, and cohort.
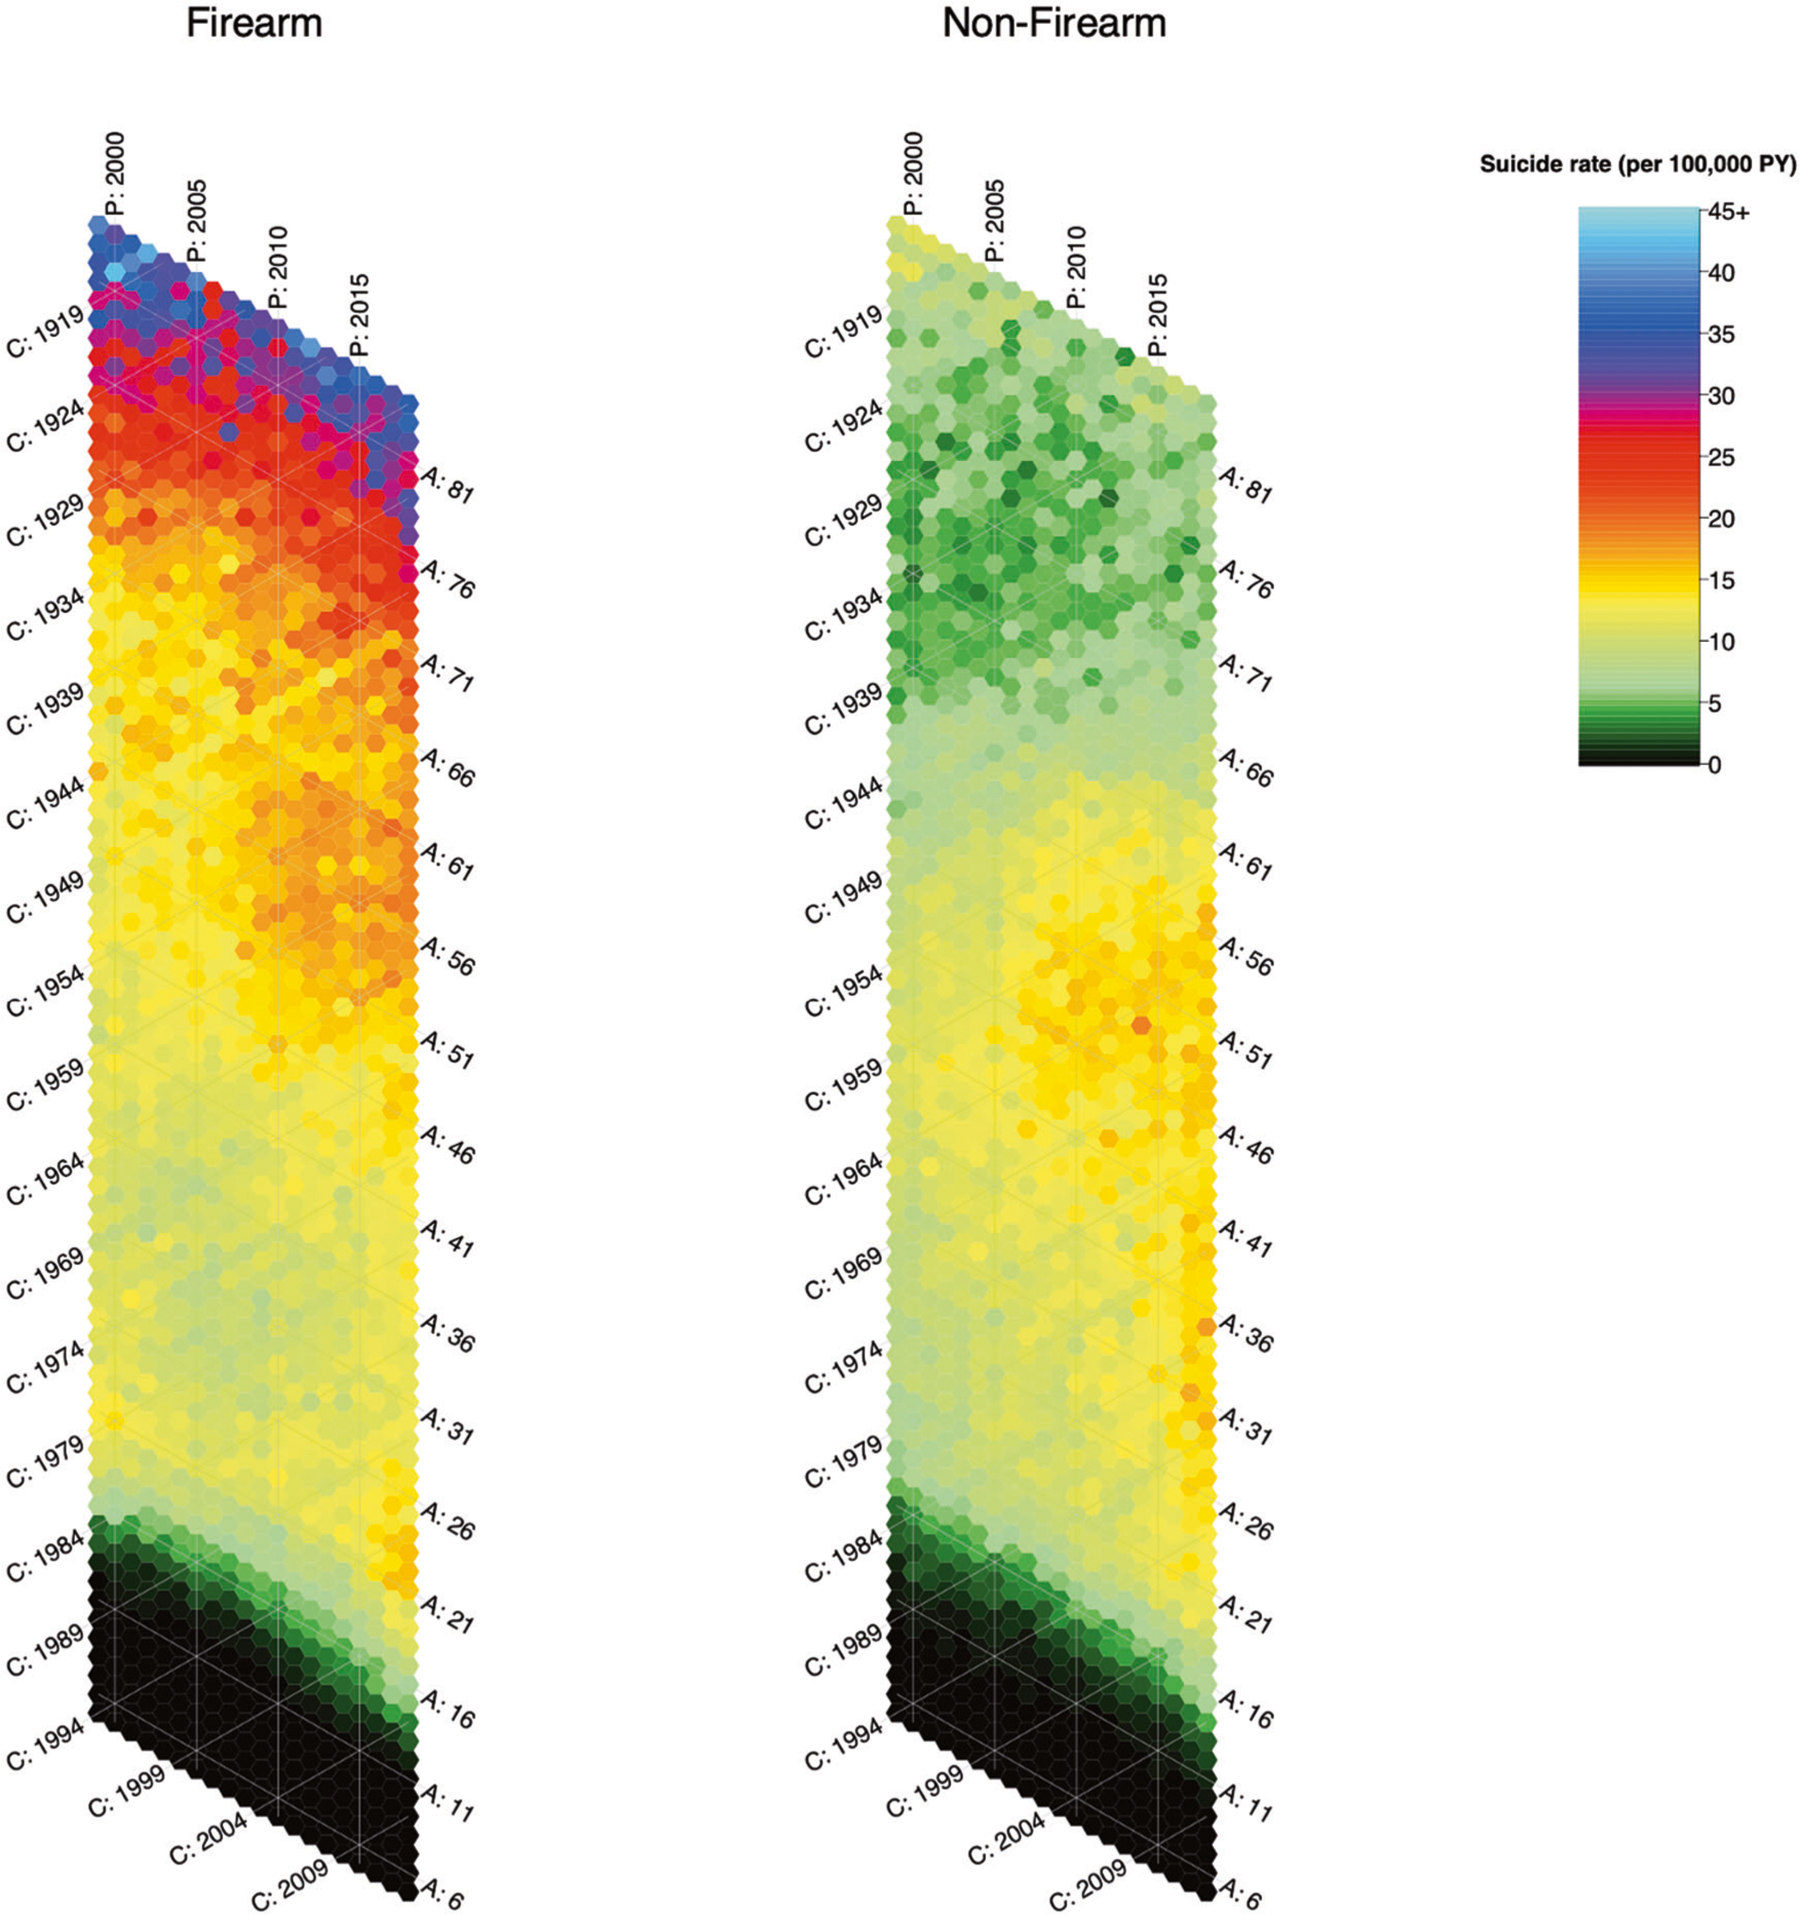
A = Age, P = Period, C = Cohort. All isolines are spaced at 5 years. Suicide rates are stratified by firearm involvement. Suicide rates for each birth cohort can be visualized along its specific diagonal C isoline, with corresponding ages and periods along A and P isolines, respectively. For instance, diagonal isoline C:1964 represents the suicide rate specific to the cohort of men born in 1964. The hexagon where C:1964 intersects with vertical isoline P:2010 and diagonal isoline A:46 represents their suicide rate in year 2010, when they were 46 years of age. Likewise, suicide rates for each period can be visualized along its specific column or vertical P isoline; and suicide rates for each age group along its specific diagonal A isoline.
Compared with men, women had lower rates of both firearm and non-firearm suicide, and there was no spike in firearm suicide among the elderly (Fig. 2). Age, period, and cohort effects in suicide trends were also evident among women, although the overall lower rates make the magnitude of change less clear in the graphic representation. Among women, increases were more notable in non-firearm rather than firearm suicide, and particularly salient among those in young and early middle adulthood. Supplementary Figs. S5–S8 provide race-specific maps.
Fig. 2. Suicide rates in the US from 1999 to 2018 for women, stratified by firearm involvement, across age, period, and cohort.
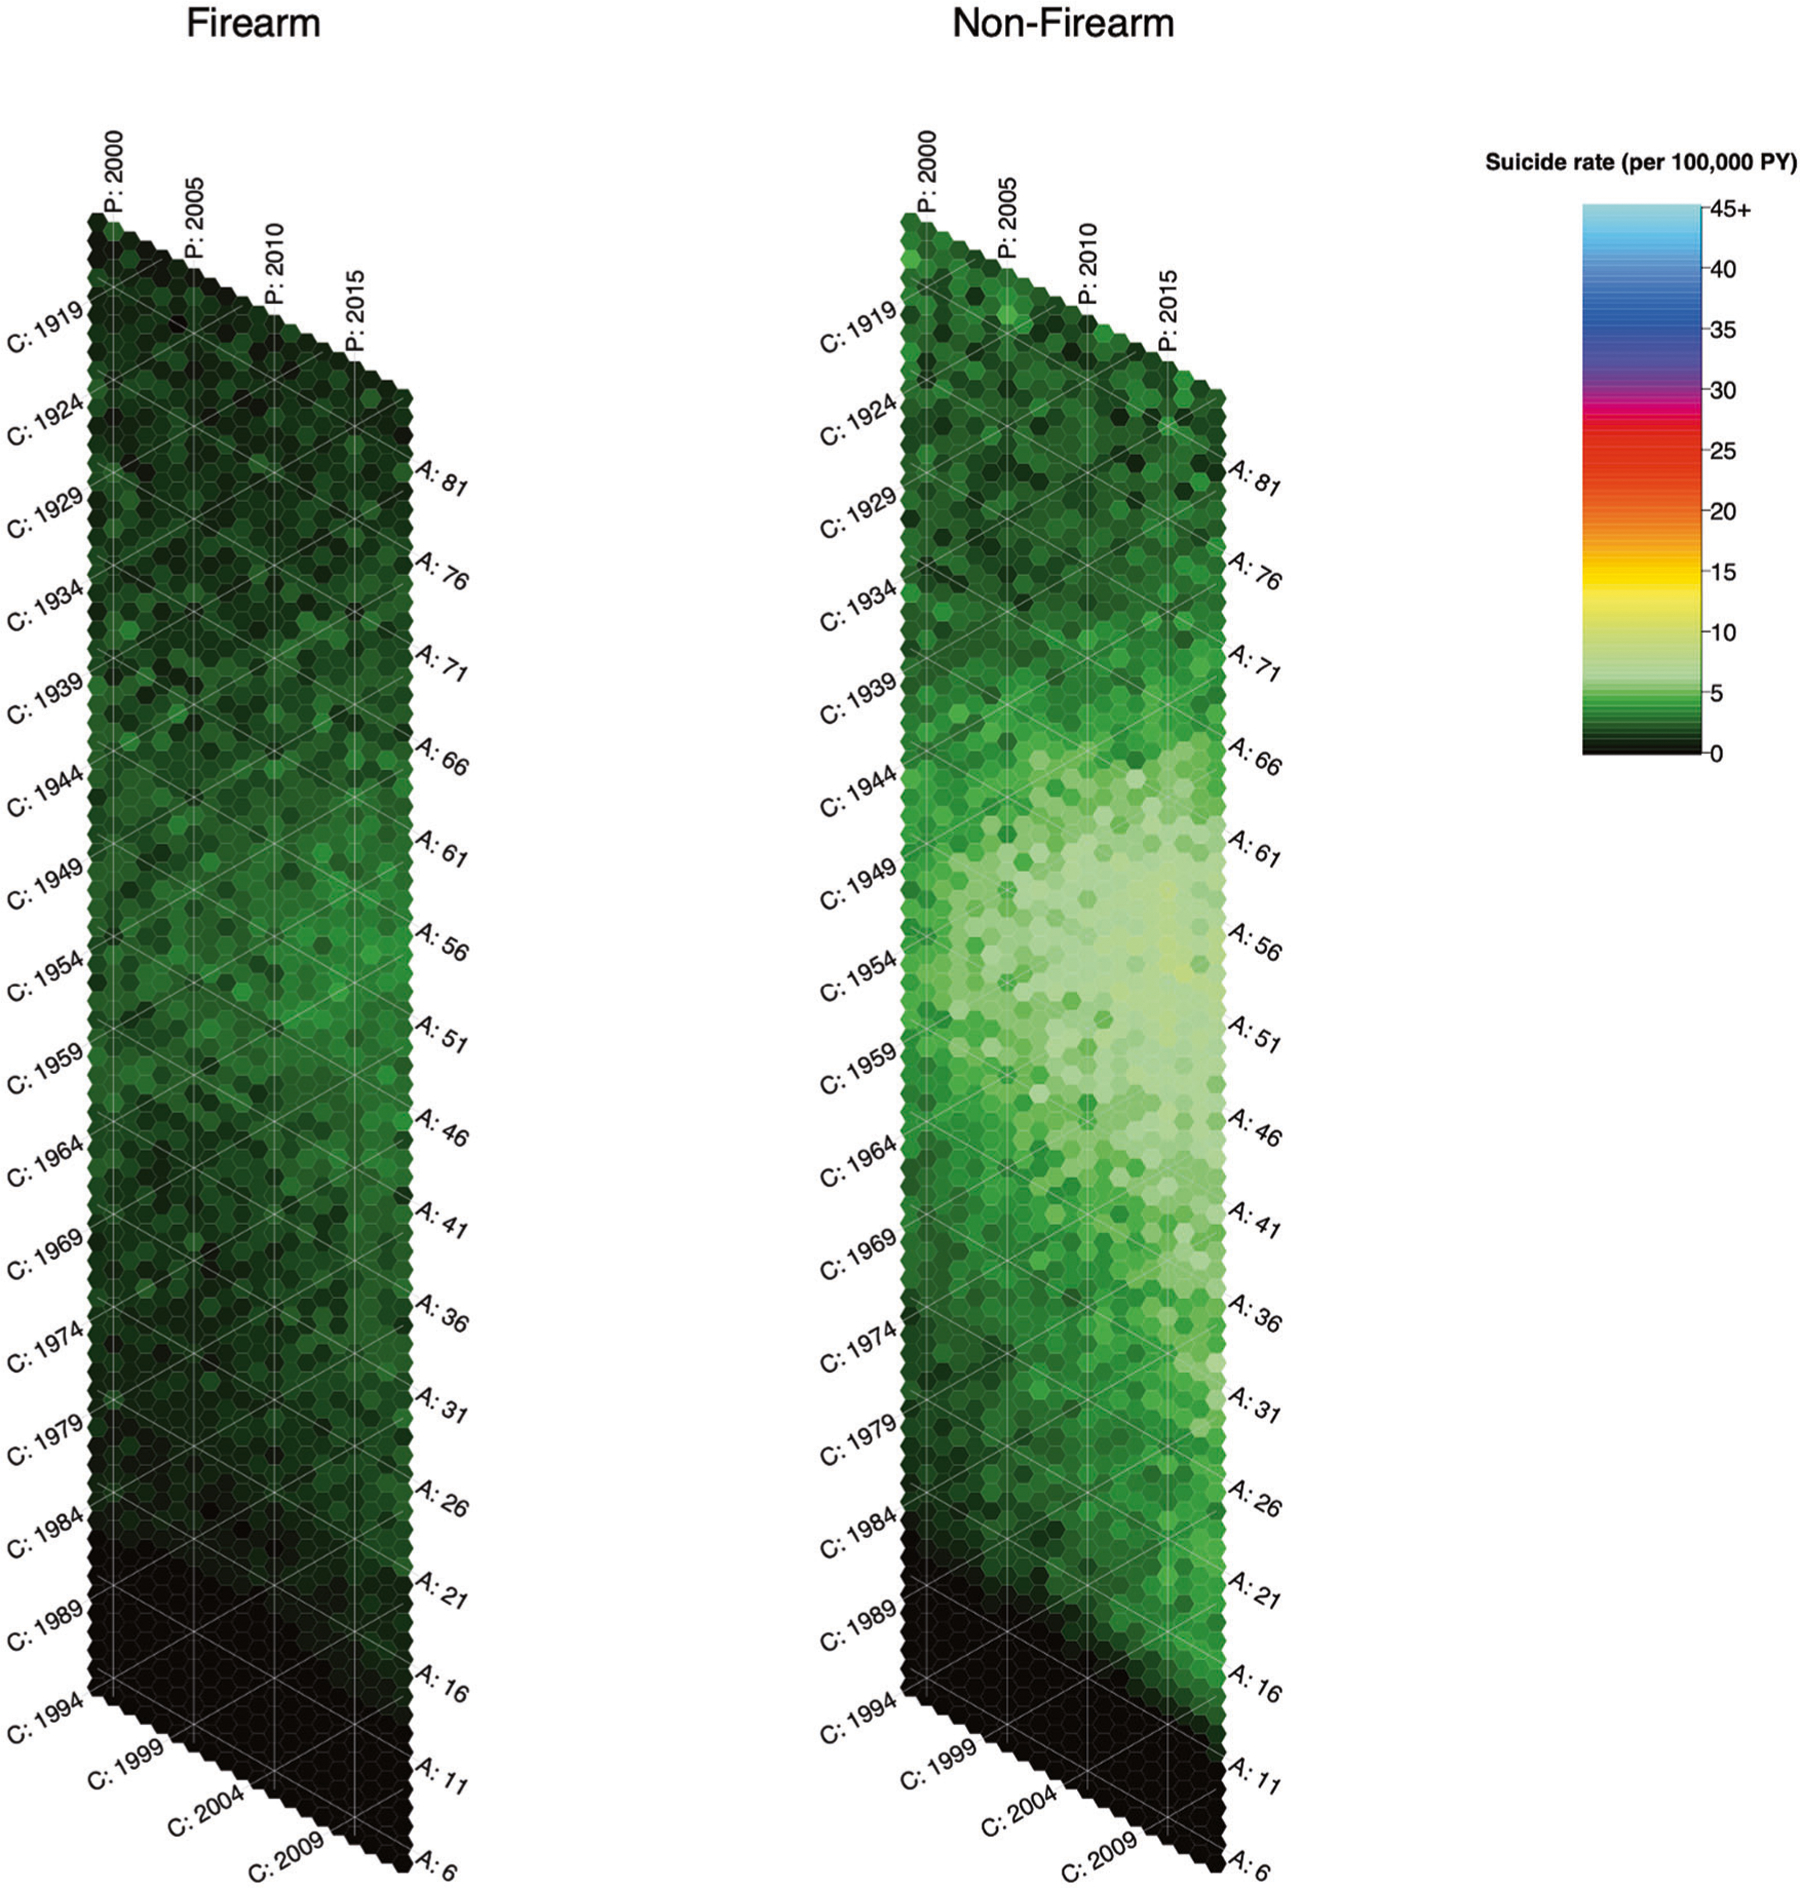
A = Age, P = Period, C = Cohort. All isolines are spaced at 5 years. Suicide rates are stratified by firearm involvement. Suicide rates for each birth cohort can be visualized along its specific diagonal C isoline, with corresponding ages and periods along A and P isolines, respectively. For instance, diagonal isoline C:1964 represents the suicide rate specific to the cohort of women born in 1964. The hexagon where C:1964 intersects with vertical isoline P:2010 and diagonal isoline A:46 represents their suicide rate in year 2010, when they were 46 years of age. Likewise, suicide rates for each period can be visualized along its specific column or vertical P isoline; and suicide rates for each age group along its specific diagonal A isoline.
Age-period-cohort models
Figures 3 and 4 estimate age, period, and cohort effects for male and female suicide, respectively, stratified by race. Supplementary Tables S1 and S2 provide the model fit statistics for overall age, period, and cohort contributions to firearm and non-firearm suicide rates. Including age, period, and cohort parameters all improved model fit, and removing them all reduced model fit, indicating that all three parameters are sufficiently predictive of variance to be included in a final model. Model fit results were consistent across race as well (Supplementary Tables S3, S4). Supplementary Figs. S9–S12 represent age-period-cohort effects on all-cause mortality, overall and after stratification by sex and race. Supplementary Figs. S13–S45 provide animated sensitivity analyses where the reference periods and cohorts are modified; interpretation of the results did not change.
Fig. 3. Age, period, and cohort effects on suicide in the US from 1999 to 2018 by firearm involvement and race, among men.
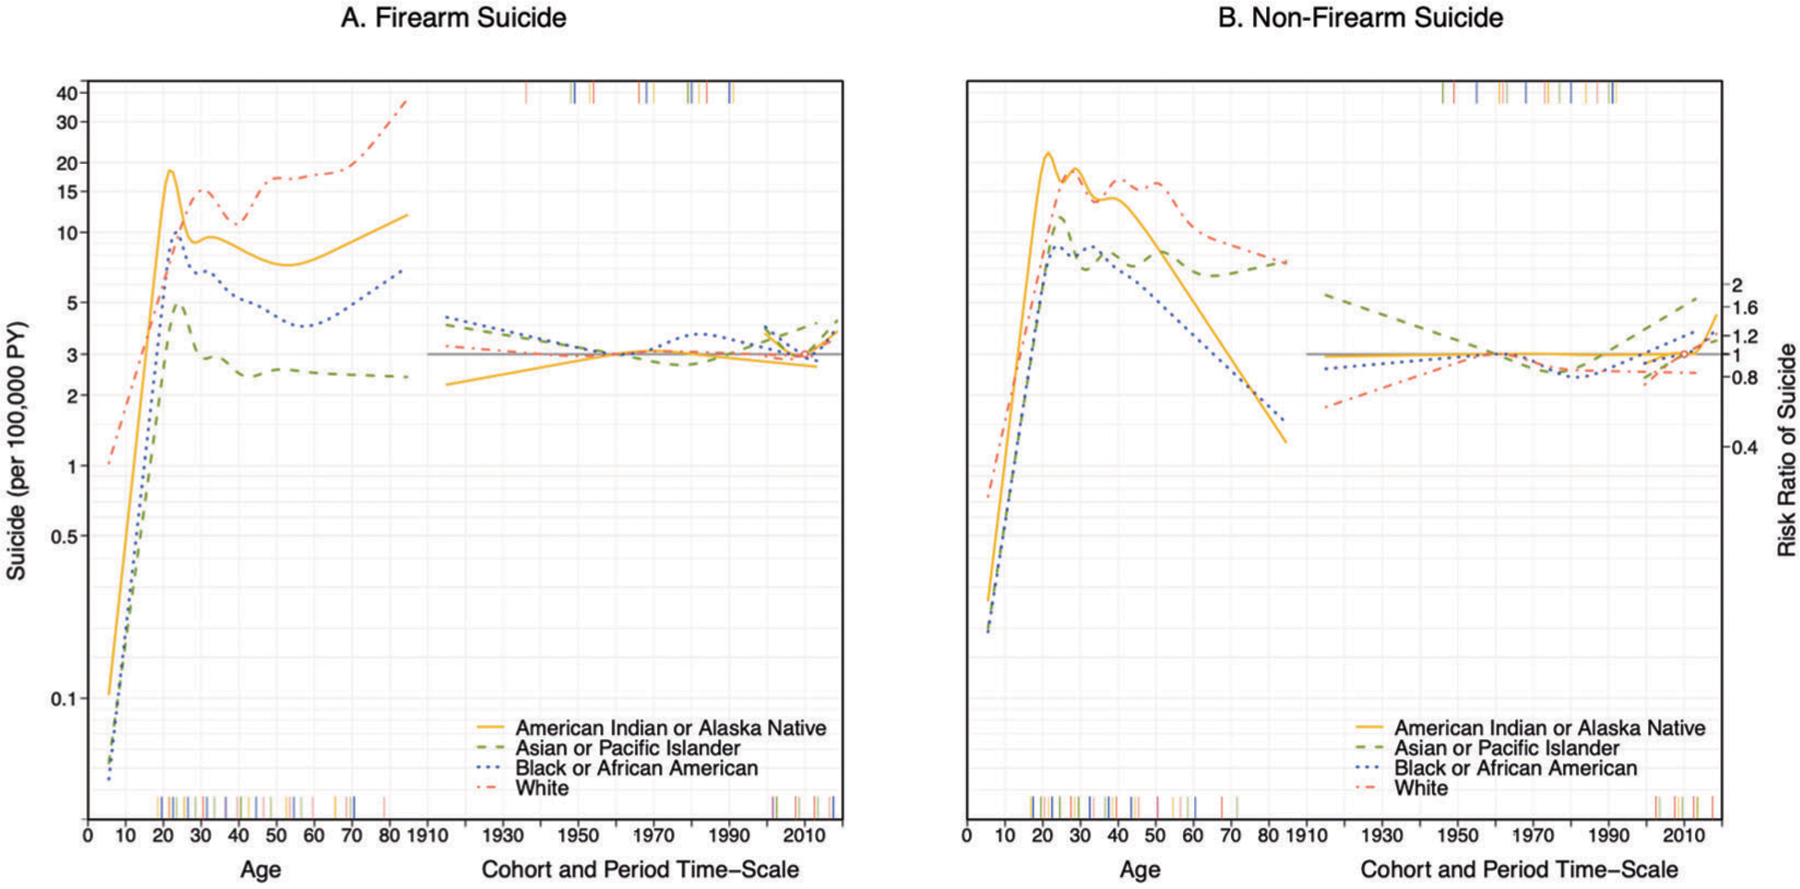
The left axis coincides with the age effect and indicates suicide rates per 100,000 men and is anchored to the reference cohort (1960). The right axis corresponds to the risk ratio comparing each cohort and period to the reference cohort (1960) and period (2010).
Fig. 4. Age, period, and cohort effects on suicide in the US from 1999 to 2018 by firearm involvement and race, among women.
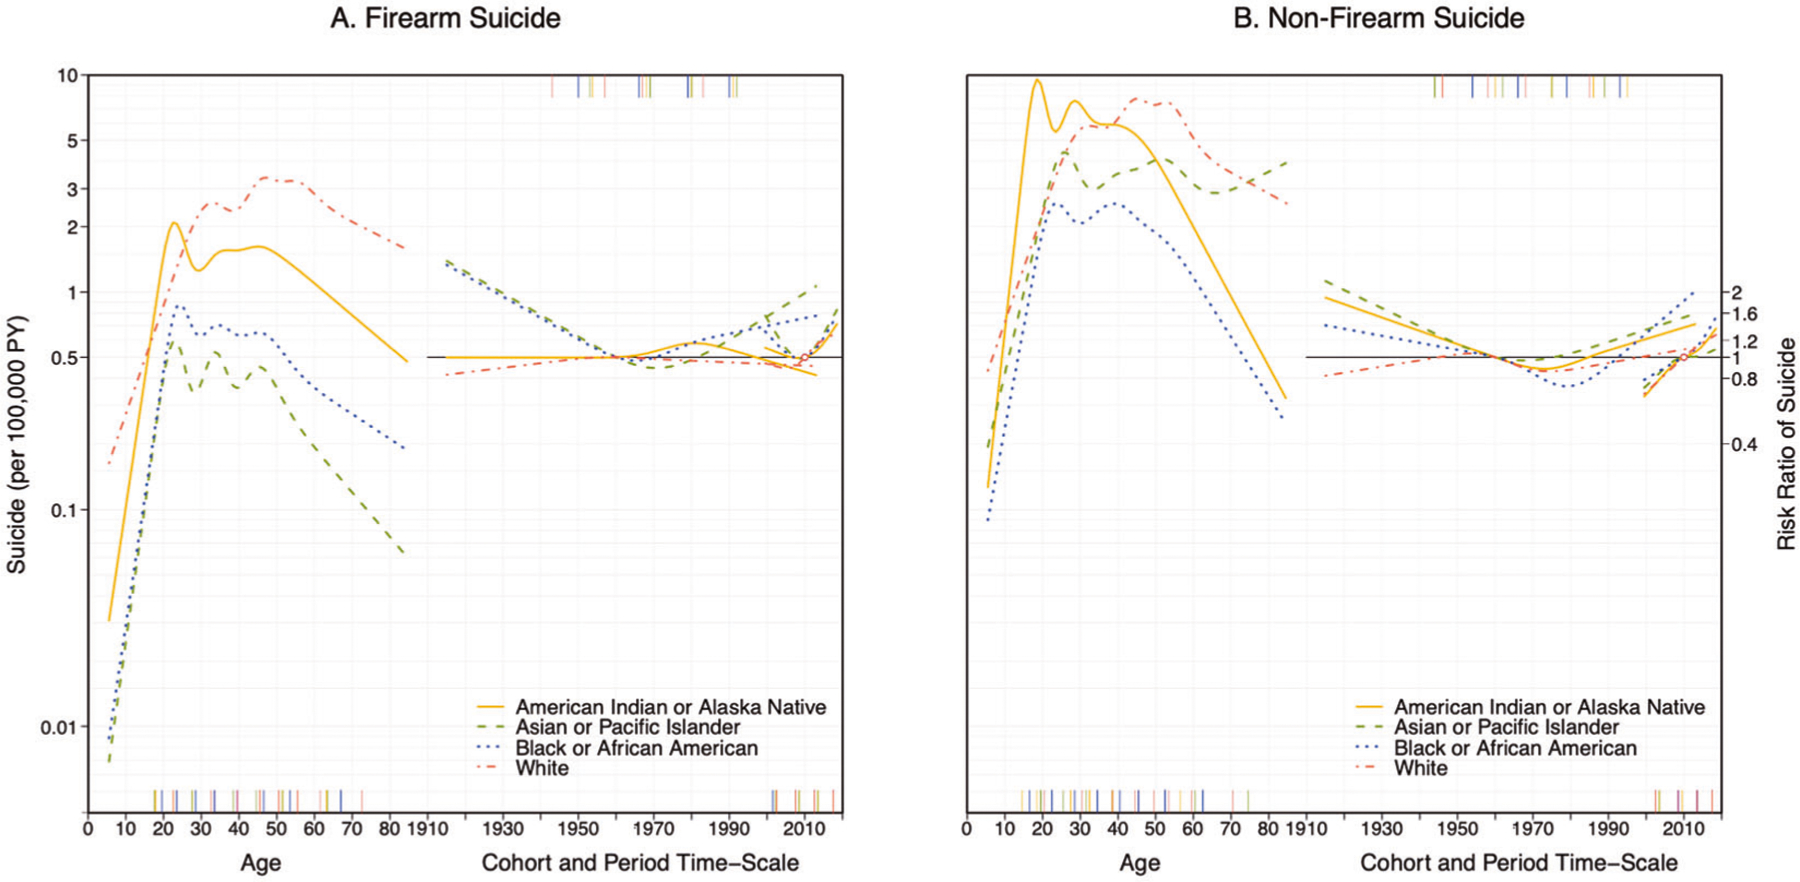
The left axis coincides with the age effect and indicates suicide rates per 100,000 women and is anchored to the reference cohort (1960). The right axis corresponds to the risk ratio comparing each cohort and period to the reference cohort (1960) and period (2010).
In Fig. 3, Panel A (male firearm suicide), the left axis of the figure coincides with the age effect and shows the suicide rate per 100,000 men anchored to the reference cohort (1960). By age, firearm suicide increased rapidly through adolescence with a peak in young adulthood for Black, Asian/Pacific Islander, and especially American Indian/Alaska Native men, with subsequent declines in suicide through approximately age 60. Firearm suicide then increased in later life for all but Asian/Pacific Islander men. On the other hand, among White men, the young adulthood peak in firearm suicide rate occured later and the subsequent decline was smaller and of shorter duration. Through middle age and late life, firearm suicide rates remained higher for White men than for all other racial groups.
The right axis of the figure corresponds to the risk ratio comparing each period and cohort to the reference period (2010) and cohort (1960). Cohort effects also suggest heterogeneity by race. Firearm suicide risk was higher for Black men born between 1970 and the late 1990s, American Indian/Alaska Native men born approximately between 1960 and 1985, and Asian/Pacific Islander men born after 1990. Period effects indicate that firearm suicide rates decreased through 2010 but began to increase soon after, for all groups.
Trends in male non-firearm suicide are shown in Fig. 3, Panel B. Age effects indicate a young adulthood peak for all racial groups, especially salient among American Indian/Alaska Native men (over 20 suicides per 100,000 at age 20). Non-firearm suicide remained roughly stable until middle adulthood and then declined with age across racial groups save Asian/Pacific Islander men, among whom suicides remain relatively constant. White men had the highest rate of non-firearm suicides after age 40. By cohort, Black and especially Asian/Pacific Islander men born into younger cohorts (1990–2010) exhibited elevated non-firearm suicide risk; for Black men the risk was higher than in any earlier born cohort, while Asian/Pacific Islander men born earlier in the 20th century had comparably high suicide rates. Among Whites, those born in the 1950s–1960s had the highest cohort effects compared to earlier and later-born cohorts. There was roughly no cohort effect in non-firearm suicide among American Indian/Alaska Native men. By period, there was evidence of increasing non-firearm suicides after 2010 for all racial groups.
Figure 4 estimates age, period and cohort effects for female suicide by race. Suicide rates were lower for women compared to men overall. Panel A represents firearm-involved suicide. By age, the peak firearm suicide rate for women was among White women in their 50s (around 3.3 annual deaths per 100,000). Similar to men, firearm suicide among women peaked in young adulthood for Black, Asian/Pacific Islander, and American Indian/Alaska Native women. Unlike men, however, the firearm suicide rate generally declined during later adulthood. Cohort effects indicate that the youngest cohorts of Black and Asian/Pacific Islander women had higher rates of firearm suicide compared to the 1960 cohort. Among American Indian/Alaska Native women, the risk peaked among those born in the 1970s.
Regarding non-firearm suicide (panel B), age effects indicate that young American Indian/Alaska Native women had the highest rates of non-firearm suicide across all women, with over 9 annual suicide deaths per 100,000 at age 20. Cohort effects indicate an increase in non-firearm suicide rate for women in younger cohorts, especially remarkable for Black women born after 1980. Additionally, period effects indicate an increase in non-firearm suicide in recent years as well, across all racial groups. This indicates that non-firearm suicide increased between 1999 and 2018 among all women, and especially among younger cohorts of non-White women.
Discussion
Suicide rates continue to increase in the US, and age-period-cohort models suggest that young cohorts particularly of minoritized adolescents are an emerging risk group. Suicide mortality increased in the US between 1999–2018 regardless of method, sex, race, age, and birth cohort. We found substantial heterogeneity in age and cohort effects by suicide method, sex, and race. In particular, we found that the increase in suicide risk among older adults is specific to male firearm suicide, and we detected a clear cohort effect associated with recent increases in non-firearm suicide risk among young Black, Asian/Pacific Islander, and American Indian/Alaska Native adults.
Access to lethal means plays a critical role in suicide mortality risk [23]. In the US, where 60% of firearm deaths correspond to suicides and nearly 1 in 2 suicides involve use of a firearm, the role of firearms in the recent increase in suicide has been the subject of extensive research. Though gun ownership increases suicide risk, gun ownership has slowly declined overall among Americans over the last three decades [24] (yet spikes in firearm purchases during 2020 have seemingly interrupted this trend [25]), and the relative increase in suicidal acts by other means (especially suffocation) is threefold that of suicidal acts by firearm, a finding present among men and women and across ages [26–34]. In line with previous reports, we found that, in addition to a predominance of suicide risk among young men and women, there was a second peak in older ages, specific to male firearm suicide and especially salient among White men. To explore the age-period-cohort effects underlying these phenomena, we stratified all analyses by firearm involvement. In line with Haviland et al. [18], we found that absolute firearm suicide risk is nonetheless on the rise, with a current 25% increase in risk relative to 2010. Conversely, we detected a lower risk of firearm-related suicide risk in young cohorts of men and women. These findings may reflect the overall decline in firearm ownership, partially driven by gun control laws that have more strongly impacted younger age groups, especially those limiting the minimum age to purchase and possess firearms [35–37]. Indeed, our results provide context for recent reports indicating that increasing the minimum age for selling handguns from 18 to 21 may decrease suicide risk for adolescents aged 18 to 20 years [38].
While the period effect of firearm suicide risk decreased between 1999 and 2010, non-firearm suicide increased over the whole study period. This has important public health and clinical implications, as method is a strong predictor of death risk in suicidal attempts and most lethal means counseling initiatives in the US have focused on reducing the availability of firearms [18]. A clear non-firearm suicide age effect affected people at younger ages across sex and races (except for white women, whose peak of risk takes place at around 50 years of age), with subsequent decreases in older ages (except for Asian/Pacific Islander individuals). The most important cohort effects in non-firearm suicide corresponded with younger non-White cohorts, especially young Black individuals and Asian/Pacific Islander men. These findings are consistent with recent increases in depression and suicidal ideation and behaviors among US adolescents [39–42]. Only younger cohorts of white individuals did not show increases in non-firearm suicide. The recent opioid epidemic may partially explain this [43], as determining the intent underlying opioid-overdose fatalities is often challenging [44]. Though the opioid epidemic has impacted all racial/ethnic groups, [44] non-firearm suicides using opioids may be particularly underestimated among White non-Hispanics because this group has the overall highest risk of opioid overdose death in the US [45].
Two observations stand out regarding to race. Previous studies have reported an age effect of suicide that varies by race, such that risk peaks at considerably earlier ages for Black individuals relative to White individuals [18]. Our data reflect the same pattern but extend it for Asians/Pacific Islanders and American Indian/Alaska Native as well. The peak risk of suicide at earlier ages for these groups may reflect relative differences in social marginalization experienced between dominant and minoritized groups. Secondly, cohort effects were observed in firearm suicide among Black men born in the late 1970s/early 1980s and non-firearm suicide among Black women born in the early 1980s. While explanations for these observations remain speculative, it is worth investigating whether contemporary increases in criminality, heavy police surveillance, and incarceration rates in Black communities [46], whose negative health consequences are widespread and well documented [46–50], may be implicated in the increased suicide risk observed for this cohort. We should note that, despite these cohort effects, White men remain at the highest suicide risk, a phenomenon that remains mostly unexplained.
This study has limitations. First, our data on suicide mortality are subject to potential errors in suicide mortality certification [51–53]. Second, the validity of our results depends on the appropriateness of APC modeling. All age-period-cohort models are subject to limitations due to regression identification issues that render models potentially vulnerable to misspecification; however, we conducted extensive sensitivity analysis wherein we varied the reference periods and cohorts. If the model were prone to misspecification, we would anticipate variation in model interpretation across reference periods and cohorts. Third, our data did not have information on Hispanic ethnicity. Fourth, while we used the United States as a whole unit of analysis, there is long-standing evidence that suicide rates are much higher in sparsely populated Western noncostal states [43]. Future analyses should examine age-period-cohort effects of suicide among US Hispanics, a group whose historically low suicide risk has steadily increased since 2000 [54], and the role of suicide method and race on regional or state-level suicide rates.
In conclusion, these results enhance understanding of the role of sex, race, and suicide method on the national increase in suicide. Two findings stand out because of their possible public health and clinical implications. First, the high rate of firearm suicide among older men should encourage the development of suicide prevention programs aimed at this population group that specifically target firearm safety, in line with those implemented in similarly high-risk groups such as the VA [55]. Second, the increased suicide risk of younger cohorts of non-White racial groups, especially Black individuals, points out the need for (i) acting on the social, economic, and political drivers of minoritized population’s adverse early-life experiences, and (ii) reducing racial/ethnic differences in access to and quality of mental health systems [56] through evidence-based approaches, such as cultural adaptive programs [57].
Supplementary Material
Acknowledgements
This work was funded by the National Institute of Mental Health (R01-MH121410). The funder/sponsor had no role in the conception, design, or execution of the study.
Footnotes
Conflict of interest JS and Columbia University declare partial ownership of SK Analytics. SK was a consultant for SK Analytics. JS was a consultant for BNI. KK has been compensated as an expert witness in litigation. No other disclosures were reported.
Supplementary information The online version contains supplementary material available at https://doi.org/10.1038/s41380-021-01078-1.
References
- 1.Turecki G, Brent DA, Gunnel D, O’Connor RC, Oquendo MA, Pirkis J, et al. Suicide and suicide risk. Nat Rev Dis Prim. 2019;5:74. [DOI] [PubMed] [Google Scholar]
- 2.Centers for Disease Control and Prevention. National Center for Injury Prevention and Control. Web‐based Injury Statistics Query and Reporting System (WISQARS). 2020. www.cdc.gov/injury/wisqars/index.html.
- 3.Naghavi M Global, regional, and national burden of suicide mortality 1990 to 2016: systematic analysis for the Global Burden of Disease Study 2016. BMJ. 2019;364:l94. [DOI] [PMC free article] [PubMed] [Google Scholar]
- 4.Hedegaard H, Curtin SC, Warner M. Increase in suicide mortality in the United States, 1999–2018. NCHS Data Brief. 2020. https://www.cdc.gov/nchs/data/databriefs/db362-h.pdf. [PubMed] [Google Scholar]
- 5.Baker SP, Hu G, Wilcox HC, Baker TD. Increase in suicide by hanging/suffocation in the U.S., 2000–2010. Am J Prev Med. 2013;44:146–9. [DOI] [PMC free article] [PubMed] [Google Scholar]
- 6.Keyes KM, Li G. Age-period-cohort modeling. In: Li G, Baker S, editors. Injury research. Boston, MA: Springer; 2012. 10.1007/978-1-4614-1599-2_22 [DOI] [Google Scholar]
- 7.Susser M Commentary: the longitudinal perspective and cohort analysis. Int J Epidemiol. 2001;30:684–7. [DOI] [PubMed] [Google Scholar]
- 8.Phillips JA. A changing epidemiology of suicide? The influence of birth cohorts on suicide rates in the United States. Soc Sci Med. 2014;114:151–60. [DOI] [PubMed] [Google Scholar]
- 9.Park S, Song Y-J, Kim J, Ki M, Shin JY, Kwon YM, et al. Age, period, and cohort effects on suicide mortality in South Korea, 1992−2015. Int J Environ Res Public Health. 2018;15. 10.3390/ijerph15081580 [DOI] [PMC free article] [PubMed] [Google Scholar]
- 10.Cha ES, Chang S-S, Choi Y, Lee WJ. Trends in pesticide suicide in South Korea, 1983–2014. Epidemiol Psychiatr Sci. 2019;29: e25. [DOI] [PMC free article] [PubMed] [Google Scholar]
- 11.Chen X, Sun Y, Li Z, Yu B, Gao G, Wang P. Historical trends in suicide risk for the residents of mainland China: APC modeling of the archived national suicide mortality rates during 1987–2012. Soc Psychiatry Psychiatr Epidemiol. 2019;54:99–110. [DOI] [PubMed] [Google Scholar]
- 12.Chung RY, Yip BHK, Chan SSM, Wong SYS. Cohort effects of suicide mortality are sex specific in the rapidly developed Hong Kong Chinese population, 1976–2010. Depress Anxiety. 2016;33:558–66. [DOI] [PubMed] [Google Scholar]
- 13.Ajdacic–Gross V, Bopp M, Gostynski M, Lauber C, Gutzwiller F, Rössler W. Age–period–cohort analysis of Swiss suicide data, 1881–2000. Eur Arch Psychiatry Clin Neurosci. 2006;256: 207–14. [DOI] [PubMed] [Google Scholar]
- 14.Gunnell D, Middleton N, Whitley E, Dorling D, Frankel S. Influence of cohort effects on patterns of suicide in England and Wales, 1950–1999. Br J Psychiatry. 2003;182:164–70. [DOI] [PubMed] [Google Scholar]
- 15.Odagiri Y, Uchida H, Nakano M. Gender differences in age, period, and birth-cohort effects on the suicide mortality rate in Japan, 1985–2006. Asia Pac J Public Heal. 2009;23:581–7. [DOI] [PubMed] [Google Scholar]
- 16.Yu B, Chen X. Age and birth cohort–adjusted rates of suicide mortality among US male and female youths aged 10 to 19 years from 1999 to 2017. JAMA Netw Open. 2019;2: e1911383–e1911383. [DOI] [PMC free article] [PubMed] [Google Scholar]
- 17.Wang Z, Yu C, Wang J, Bao J, Gao X, Xiang H. Age-period-cohort analysis of suicide mortality by gender among white and black Americans, 1983–2012. Int J Equity Health. 2016;15:107. [DOI] [PMC free article] [PubMed] [Google Scholar]
- 18.Haviland MJ, Rowhani-Rahbar A, Rivara FP. Age, period and cohort effects in firearm homicide and suicide in the USA, 1983–2017. Inj Prev. 2020. 10.1136/injuryprev-2020-043714. [DOI] [PubMed] [Google Scholar]
- 19.Conner A, Azrael D, Miller M. Suicide case-fatality rates in the United States, 2007 to 2014. Ann Intern Med. 2019;171:885–95. [DOI] [PubMed] [Google Scholar]
- 20.Council NR. Vital statistics: summary of a workshop. (Siri MJ, Cork DL, eds.). Washington, DC: The National Academies Press; 2009. 10.17226/12714. [DOI] [PubMed] [Google Scholar]
- 21.Jalal H, Burke DS. Hexamaps for age–period–cohort data visualization and implementation in R. Epidemiology. 2020. https://journals.lww.com/epidem/Fulltext/9000/Hexamaps_for_Age_Period_Cohort_Data_Visualization.98384.aspx. [DOI] [PMC free article] [PubMed] [Google Scholar]
- 22.Clayton D, Schifflers E. Models for temporal variation in cancer rates. II: age-period-cohort models. Stat Med. 1987;6:469–81. [DOI] [PubMed] [Google Scholar]
- 23.Gunnell D, Eddleston M. Suicide by intentional ingestion of pesticides: a continuing tragedy in developing countries. Int J Epidemiol. 2003;32:902–9. [DOI] [PMC free article] [PubMed] [Google Scholar]
- 24.Smith TW, Son J. General Social Survey Final Report: Trends in Gun Ownership in the United States, 1972–2018. Published online in 2020. https://www.norc.org/Research/Projects/Pages/general-social-survey.aspx. Accessed 2 Mar 2021.
- 25.McKnight R, Levine PB. Three million more guns: The Spring 2020 spike in firearm sales. Brookings. Published July 13, 2020. https://www.brookings.edu/blog/up-front/2020/07/13/three-million-more-guns-the-spring-2020-spike-in-firearm-sales/. Accessed 2 Mar 2021.
- 26.National Institute of Mental Health. NIMH Suicide Statistics. 2018. https://www.nimh.nih.gov/health/statistics/suicide.shtml#part_154971.
- 27.Hassan A Deaths from drugs and suicide reach a record in the US. The New York Times. 2019. https://www.nytimes.com/2019/03/07/us/deaths-drugs-suicide-record.html. [Google Scholar]
- 28.Bureau of Justice Statistics. Key facts at a glance: firearm deaths by intent, 1991–2001. 2010. https://web.archive.org/web/20130118071124/http:/bjs.ojp.usdoj.gov/content/glance/tables/frmdth.cfm.
- 29.Preventing suicide by limiting access to guns. Harvard Sch Public Heal News. 2020. https://www.hsph.harvard.edu/news/hsph-in-the-news/preventing-suicide-by-limiting-access-to-guns/. [Google Scholar]
- 30.Miller M, Barber C, White RA, Azrael D. Firearms and suicide in the United States: Is risk independent of underlying suicidal behavior? Am J Epidemiol. 2013;178:946–55. [DOI] [PubMed] [Google Scholar]
- 31.Siegel M, Rothman EF. Firearm ownership and suicide rates among US men and women, 1981–2013. Am J Public Health. 2016;106:1316–22. [DOI] [PMC free article] [PubMed] [Google Scholar]
- 32.Studdert DM, Zhang Y, Swanson SA, Prince L, Rodden JA, Holsinger EE, et al. Handgun ownership and suicide in California. N Engl J Med. 2020;382:2220–9. [DOI] [PubMed] [Google Scholar]
- 33.Smith PN, Currier J, Drescher K. Firearm ownership in veterans entering residential PTSD treatment: associations with suicide ideation, attempts, and combat exposure. Psychiatry Res. 2015;229:220–4. [DOI] [PubMed] [Google Scholar]
- 34.Wang J, Sumner SA, Simon TR, Crosby AE, Annor FB, Gaylor E, et al. Trends in the incidence and lethality of suicidal acts in the United States, 2006 to 2015. JAMA Psychiatry. 2020;77:684–93. [DOI] [PMC free article] [PubMed] [Google Scholar]
- 35.Ludwig J, Cook PJ. Homicide and suicide rates associated with implementation of the Brady Handgun Violence Prevention Act. JAMA. 2000;284:585–91. [DOI] [PubMed] [Google Scholar]
- 36.Rodríguez Andrés A, Hempstead K. Gun control and suicide: the impact of state firearm regulations in the United States, 1995–2004. Health Policy. 2011;101:95–103. [DOI] [PubMed] [Google Scholar]
- 37.Giffords Law Center to Prevent Gun Violence. Minimum age to purchase & possess. 2020. https://giffords.org/lawcenter/gun-laws/policy-areas/who-can-have-a-gun/minimum-age/.
- 38.Raifman J, Larson E, Barry CL, Siegel M, Ulrich M, Knopov A, et al. State handgun purchase age minimums in the US and adolescent suicide rates: regression discontinuity and difference-in-differences analyses. BMJ. 2020;370. 10.1136/bmj.m2436. [DOI] [PMC free article] [PubMed] [Google Scholar]
- 39.Mojtabai R, Olfson M, Han B. National trends in the prevalence and treatment of depression in adolescents and young adults. Pediatrics. 2016;138:e20161878. [DOI] [PMC free article] [PubMed] [Google Scholar]
- 40.Keyes KM, Gary D, O’Malley PM, Hamilton A, Schulenberg JE. Recent increases in depressive symptoms among US adolescents: trends from 1991–2018. Soc Psychiatry Psychiatr Epidemiol. 2019;54:987–96. [DOI] [PMC free article] [PubMed] [Google Scholar]
- 41.Plemmons G, Hall M, Doupnik S, Gay J, Brown C, Browning W, et al. Hospitalization for suicide ideation or attempt: 2008–2015. Pediatrics. 2018;141:e20172426. [DOI] [PubMed] [Google Scholar]
- 42.Centers for Disease Control and Prevention. Trends in the prevalence of suicide-related behaviors national YRBS: 1997–2017. Youth Risk Behav Surv. 2018. https://www.cdc.gov/healthyyouth/data/yrbs/pdf/trends/2017_suicide_trend_yrbs.pdf. [Google Scholar]
- 43.Stone DM, Simon TR, Fowler KA, Kegler SR, Yuan K, Holland KM, et al. Vital Signs: Trends in state suicide rates—United States, 1999–2016 and circumstances contributing to suicide— 27 states, 2015. Morb Mortal Wkly Rep. 2018;67:617–24. [DOI] [PMC free article] [PubMed] [Google Scholar]
- 44.Oquendo MA, Volkow ND. Suicide: a silect contributor to opioid-overdose deaths. N. Engl J Med 2018;378:1567–9. [DOI] [PubMed] [Google Scholar]
- 45.Kaiser Family Foundation. Opioid overdose deaths by race/ethnicity. 2020. https://www.kff.org/other/state-indicator/opioid-overdose-deaths-by-raceethnicity/?currentTimeframe=0&sortModel=%7B%22colId%22:%22Location%22,%22sort%22:%22asc%22%7D.
- 46.Nunn KB. Race, crime and the pool of surplus criminality: or why the war on drugs was a war on blacks. J Gender, Race Justice. 2002;6. [Google Scholar]
- 47.Moore LD, Elkavich A. Who’s using and who’s doing time: incarceration, the war on drugs, and public health. Am J Public Health. 2008;98:S176–S180. [DOI] [PMC free article] [PubMed] [Google Scholar]
- 48.Clear T Imprisoning communities: how mass incarceration makes disadvantaged neighborhoods worse. New York, NY: Oxford University Press; 2007. [Google Scholar]
- 49.Wildeman C, Goldman AW, Lee H. Health consequences of family member incarceration for adults in the household. Public Health Rep. 2019;134:15S–21S. [DOI] [PMC free article] [PubMed] [Google Scholar]
- 50.Kajeepeta S, Rutherford CG, Keyes KM, El-Sayed AM, Prins SJ. County jail incarceration rates and county mortality rates in the United States, 1987–2016. Am J Public Health. 2020;110: S109–S115. [DOI] [PMC free article] [PubMed] [Google Scholar]
- 51.Bakst SS, Braun T, Zucker I, Amitai Z, Shohat T. The accuracy of suicide statistics: are true suicide deaths misclassified? Soc Psychiatry Psychiatr Epidemiol. 2016;51:115–23. [DOI] [PubMed] [Google Scholar]
- 52.De Leo D Can we rely on suicide mortality data? Cris J Cris Inter Suicide Prev. 2015;36:1–3. [DOI] [PubMed] [Google Scholar]
- 53.Gunnell D, Bennewith O, Simkin S, Cooper J, Klineberg E, Rodway C, et al. Time trends in coroners’ use of different verdicts for possible suicides and their impact on officially reported incidence of suicide in England: 1990–2005. Psychol Med. 2013;43:1415–22. [DOI] [PubMed] [Google Scholar]
- 54.Silva C, Van Orden KA. Suicide among Hispanics in the United States. Curr Opin Psychol. 2018;22:44–49. [DOI] [PMC free article] [PubMed] [Google Scholar]
- 55.The President’s roadmap to empower veterans and end a national tragedy of suicide. https://www.va.gov/PREVENTS/EO-13861.asp. Accessed 10 Dec 2020.
- 56.Lee-Tauler SY, Progovac AM, Samson F, Sanchez MJ. A review of mental health and mental health care disparities research: 2011–2014. Med Care Res Rev. 2019;76:683–710. [DOI] [PubMed] [Google Scholar]
- 57.Alegria M, Nakash O, Johnson K, et al. Effectiveness of the DECIDE interventions on shared decision making and perceived quality of care in behavioral health with multicultural patients: a randomized clinical trial. JAMA Psychiatry. 2018;75:325–35. [DOI] [PMC free article] [PubMed] [Google Scholar]
Associated Data
This section collects any data citations, data availability statements, or supplementary materials included in this article.