Abstract
Radiation therapy (RT) in combination with immune checkpoint inhibitor (ICI) represents a promising regimen for non-small cell lung cancer (NSCLC), however, the underlying mechanisms are poorly characterized. We identified a specific dose of RT that conferred tumor regression and improved survival in NSCLC models when combined with ICI. The immune-modulating functions of RT was ascribed to activated lung-resident Scgb1a1+ club cells. Importantly, mice with club cell-specific knockout of synaptosome-associated protein 23 failed to benefit from the combination treatment, indicating a pivotal role of club cell secretome. We identified 8 club cells secretory proteins, which inhibited immunosuppressive myeloid cells, reduced pro-tumor inflammation, and enhanced anti-tumor immunity. Notably, CC10, a member of club cell secretome was increased in plasma of NSCLC patients responding to the combination therapy. By revealing an immune-regulatory role of club cells, our studies have the potential to guide future clinical trials of ICI in NSCLC.
Keywords: Non-small-cell lung cancer (NSCLC), immune checkpoint inhibitor (ICI), radiation therapy (RT), club cell, secretome
Despite advances in surgery, radiotherapy, and molecular targeted therapies, mortality in non-small cell lung cancer (NSCLC) remains high1,2. Immune checkpoint inhibitors (ICI) targeting the programmed cell death protein ligand 1 (PD-L1)/programmed cell death protein 1 (PD-1) axis promote tumor cell killing by invigorating cytotoxic T cell activity3. Although these inhibitors have been approved for the treatment of advanced NSCLC, the majority of patients experience little clinical benefit due to a variety of immunosuppressive barriers in the tumor microenvironment (TME)4,5. Therefore, efforts are urgently needed to identify immunomodulatory agents that may overcome these barriers and increase the efficacy of ICI3.
Radiation therapy (RT) has potential immunomodulatory properties, as it can trigger immunogenic cell death and activate antigen-presenting cells that cross-prime tumor-specific T cells6, not only to limit primary tumor growth, but also to produce systemic effects that target distant (abscopal) non-irradiated metastatic lesions7–9. Unfortunately, the optimal RT dose and the underlying molecular mechanisms are cancer type-dependent10,11, and little has been elucidated for NSCLC, including the sequencing and dose/fractionation schemes that elicit optimal immune modulation. Emerging evidence supports the therapeutic potential of combining ICI with RT for various tumor types12–16 including NSCLC17–19. A phase I trial demonstrated that NSCLC patients previously treated with radiotherapy exhibited longer progression-free survival with ICI than patients without previous radiotherapy20. However, due to the lack of molecular mechanisms identified in previous trials, current clinical trials testing such combinations are guided by empirical choices that may not be optimal. Here, we provide mechanistic insights that may accelerate the development of RT and ICI combination in NSCLC.
A specific dose of RT enhances the efficacy of PD-1 blockade.
We employed the mutant HKP1 (KrasG12Dp53−/−) orthotropic mouse model of lung cancer, which develops adenocarcinoma with histopathological similarities to human NSCLC in immunocompetent C57/BL6 mice21. We have reported that HKP1 mice treated with α-PD-1 antibody exhibit a significant albeit short-term survival benefit22, which provides an opportunity to investigate the impact of RT on the efficacy of ICI.
Various doses of hypofractionated RT have been reported in ongoing investigations in human23 and mouse24 tumors, and the critical importance of the dose and fractionation has been suggested25. Therefore, we first optimized an μCT-guided RT regimen in HKP1-bearing lungs that could enhance the therapeutic efficacy of PD-1 inhibition. We tested both an RT regimen previously reported to have immunomodulatory activities in breast cancer models: 8 Gray (Gy) for 3 consecutive days (8Gy×3)24, and two lower dosing regimens, 4Gy×3 and 0.5Gy×3 (Fig. 1a). Remarkably, 4Gy×3 (4Gy-RT) in combination with α-PD-1 antibody elicited significant tumor control (Fig. 1b, 1c) and improved survival (Fig. 1d). Importantly, 40% of mice exhibited tumor-free survival, in contrast to 10% in the cohort treated with α-PD-1 antibody alone. The other doses of 0.5Gy×3 and 8Gy×3 combined with PD-1 inhibition did not confer significant tumor control or improve survival over PD-1 inhibition alone (Fig. 1e, 1f). These results suggest that 4Gy-RT elicit an effective anti-tumor immune response, which enhanced the efficacy of PD-1 inhibition in the HKP1 model.
Figure 1. A specific dose of RT enhances efficacy of PD-1 inhibition in HKP1 NSCLC model.
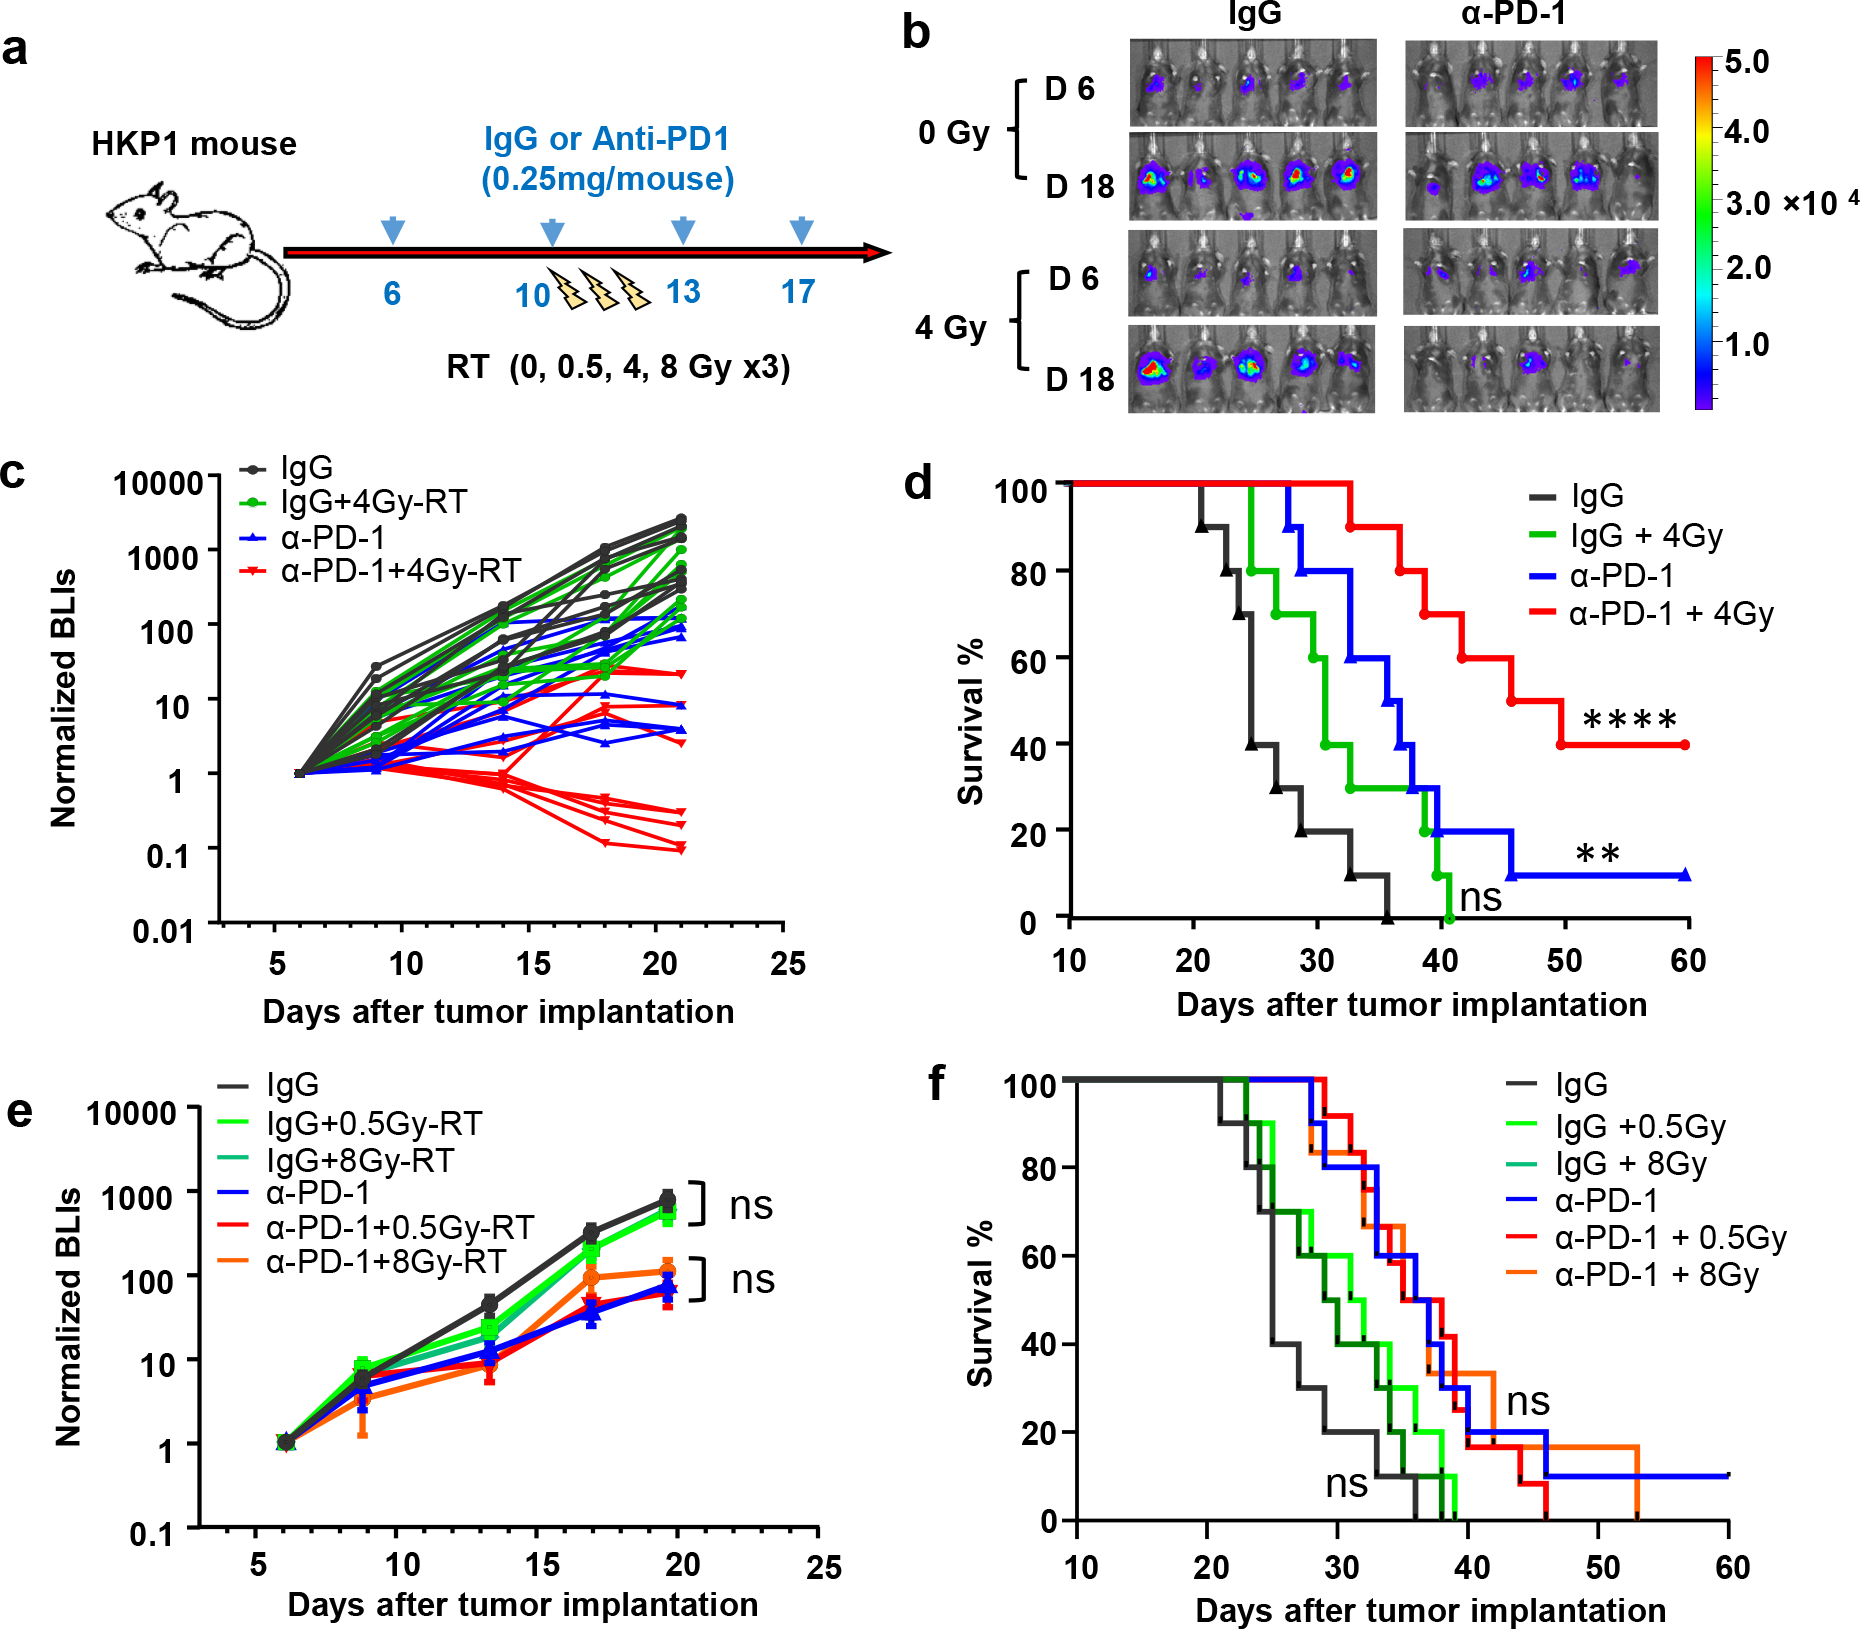
a, Schematic depicting treatment strategy of HKP1 mice. HKP1-bearing mice were treated with either IgG or α-PD1 antibody (0.25 mg/mouse, i.p.) at day 6, 10, 13, and 17. Mice also received different hypofractionated doses of RT (0, 0.5, 4 or 8Gy) for 3 consecutive days (day 10–12).
b, Representative bioluminescent images (BLIs) of HKP1 mice (n=10) treated with 0 or 4Gy-RT in combination with IgG or α-PD1 antibody.,
c, Tumor growth curves of HKP1 mice (n=10) treated with indicated regimens., IgG vs.4Gy-RT, P=0.95, non-significant (ns); IgG vs.α-PD1, *P=0.0173; α-PD1 vs. α-PD1+4Gy-RT; *P=0.048, two-way ANOVA with Tukey’s post-hoc test.
d, Kaplan-Meier survival curves of HKP1 mice (n=10) receiving treatments as indicated. IgG vs.4Gy-RT: P=0.0936, non-significant (ns); IgG vs.α-PD1: **P=0.0027; IgG vs.α-PD1+4Gy-RT: ****P < 0.0001, Two-tailed logrank test with Bonferroni method.
e, Tumor growth curves of HKP1 mice (n=10) treated with indicated regimens. Data are mean ± SEM. 0 vs. 0.5 or 8Gy-RT in IgG cohort, P>0.34; in α-PD1 cohort, P>0.88. ns, non-significant. Two-way ANOVA with Tukey’s post-hoc test.
f, Kaplan-Meier survival curves of HKP1 mice (n=10) receiving treatments described in e. 0 vs 0.5 or 8Gy-RT in IgG cohort, P>0.15; in α-PD1 cohort, P>0.87, ns, non-significant. Two-tailed logrank test with Bonferroni method.
Durable T cell activities conferred by combination therapy.
To elucidate the differential impacts of various RT doses, we examined T cell infiltration and cytokine production one day after the last dose of RT (Day 4 post-RT initiation). Amongst all the cohorts examined, 4Gy-RT showed the highest number of infiltrating CD8+ T cells in tumor islets (Fig. 2a, Extended Data Fig. 1a), and the highest number of IFNγ+/TNFα+/CD4+ T cells and GzmB+/CD8+ T cells in the HKP1 lungs (Fig. 2b, 2c, Extended Data Fig. 1b). These 4Gy-RT-induced T cell activities are consistent with its synergistic effects of PD-1 inhibition.
Figure 2. 4Gy-RT increases T cell infiltration and activation in HKP1-bearing lungs.
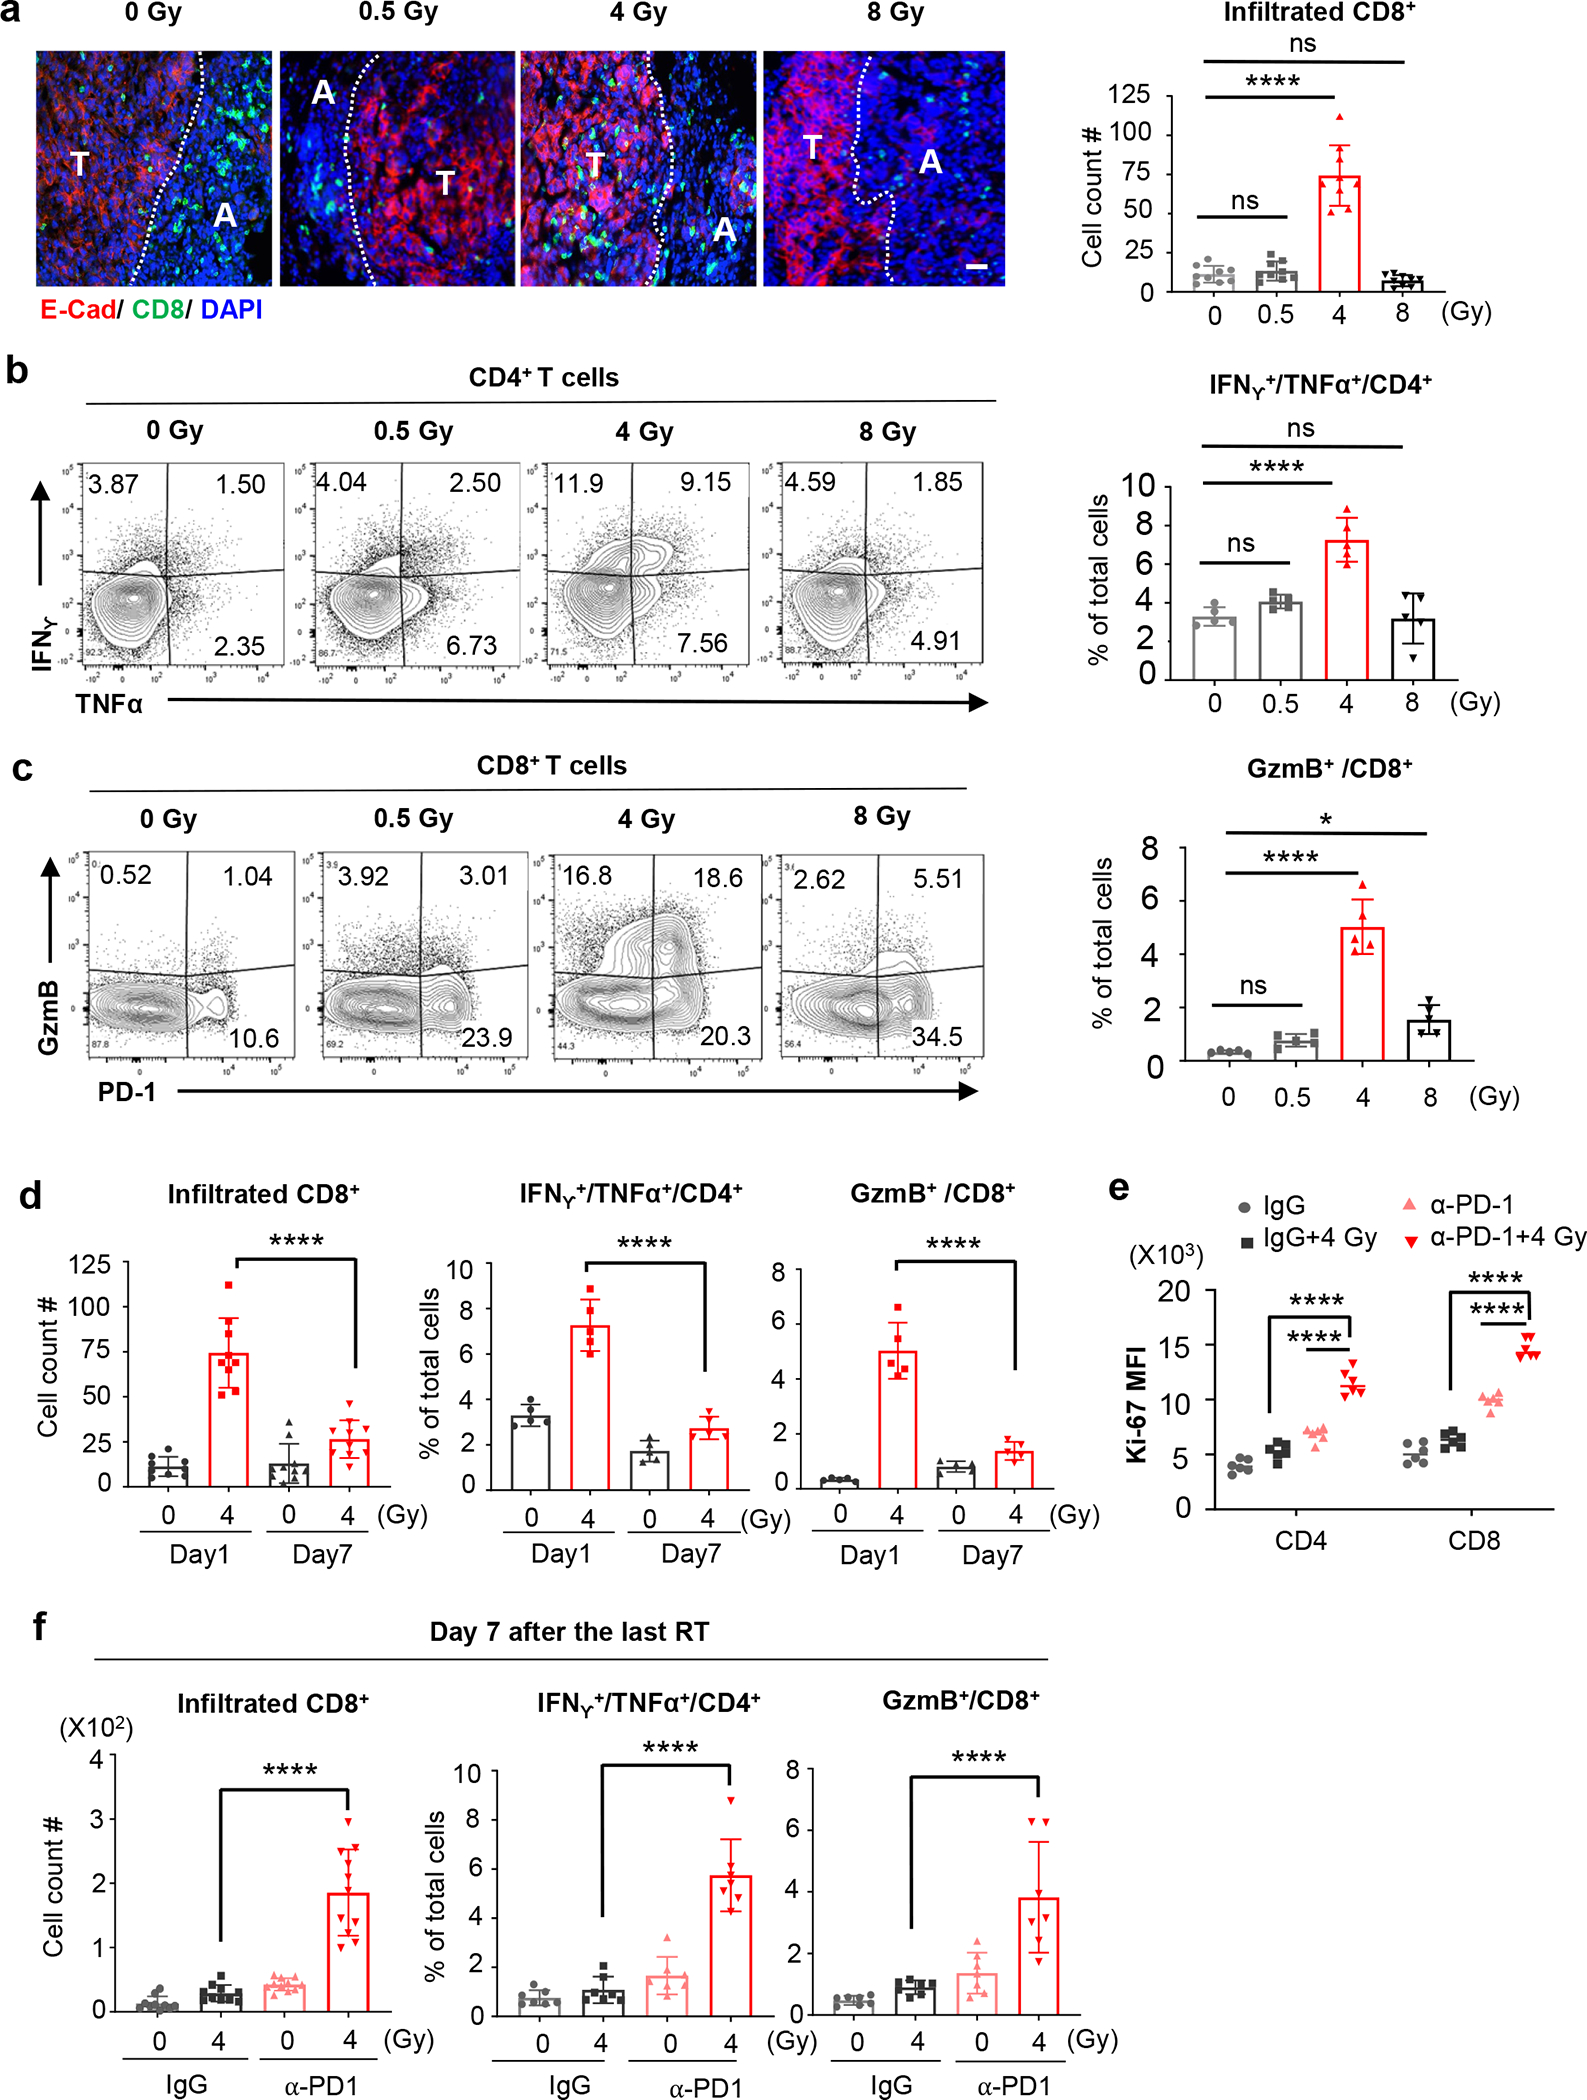
a, Representative immunofluorescent images of HKP1-bearing lungs (n=9 tissue sections from 4 mice) showing the impact of various doses of RT alone on the infiltration of CD8+ T cells (Green) into E-cadherin+ tumor islets (Red) Tumor (T) and adjacent lung tissue (A) are separated by a dotted line. Right panel: quantification of CD8+ T cells in tumor islets. Cell counts/field were evaluated. Scale Bar: 20μM. Data are mean ± SEM. 0Gy vs. 0.5Gy-RT, P=0.9781; 0Gy vs. 4Gy-RT, ****P<0.0001; 0Gy vs. 8Gy-RT, P=0.8443. One-way ANOVA with Tukey’s post-hoc test.
b, Flow cytometry analysis of IFNγ and TNFα expression by CD4+ T cells in HKP1-bearing lungs after treatment with various doses of RT. Right panel: quantification of IFNγ+/TNFα+/CD4+ T cells. n=5 tumor-bearing lungs. 0Gy vs. 0.5Gy-RT, P=0.5539; 0Gy vs. 4Gy-RT, ****P<0.0001; 0Gy vs. 8Gy-RT, P=0.9978.
c, Flow cytometry analysis of GzmB and PD1 expression by CD8+ T cells in HKP1-bearing lungs after treatment with various doses of RT. Right panel, quantification of GzmB+/CD8+ T cells. n=5 tumor-bearing lungs. 0Gy vs. 0.5Gy-RT, P=0.6599; 0Gy vs. 4Gy-RT, ****P<0.0001; 0Gy vs. 8Gy-RT, *P=0.0239.
d, Quantification of the infiltrated CD8+ T cells (left, Day1 4Gy-RT:n=9 lung sections and Day7 4Gy-RT:n=10 lung sections, ****P<0.0001), IFNγ+/TNFα+/CD4+ (middle, n=5 tumor-bearing lungs, ****P<0.0001), and GzmB+/CD8+ T cells (right, n=5 tumor-bearing lungs, ****P<0.0001) in HKP1 lungs at Day 1 and Day 7 after 0Gy or 4Gy-RT.
e, Ki67 mean fluorescence intensity (MFI) of cytokine+ T cells in HKP1 lungs treated with IgG, IgG+4Gy-RT, α-PD1 or α-PD1+4Gy-RT at Day 7 post-RT. n= 6 tumor-bearing lungs. ****P<0.0001. One-way ANOVA with Tukey’s post-hoc test.
f, Quantification of infiltrated CD8+ T cells (left, Day1 4Gy-RT:n=10 lung sections and Day7 4Gy-RT:n=11 lung sections, ****P<0.0001), IFNγ+/TNFα+/CD4+ T cells (middle, n=7 tumor-bearing lungs, ****P<0.0001), and GzmB+/CD8+ T cells (right, n=7 tumor-bearing lungs, ****P<0.0001) in HKP1 lungs treated with IgG, IgG+4Gy-RT, α-PD1 or α-PD1+4Gy-RT at Day 7 post-RT.
2b-d and 2f: Quantification were performed using cytokine+ T cell % of total single cells of HKP1-bearing lung, Data are mean ± SEM. One-way ANOVA with Tukey’s post-hoc test.
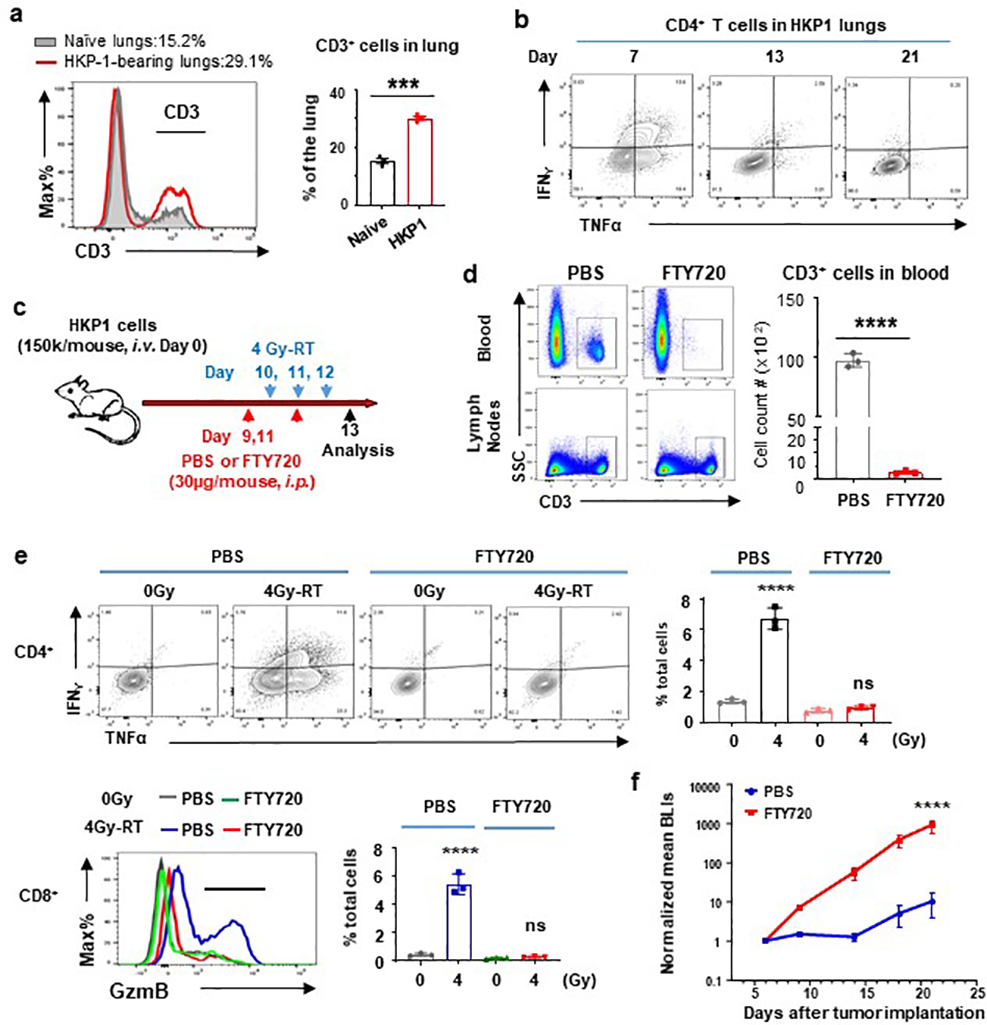
T cells that were increasingly recruited to HKP-1 lungs gradually acquired dysfunctional phenotypes as evidenced by decreased expression of effector cytokines by CD4+ T cells, such as IFNγ and TNFα (Extended Data Fig. 2a–b). To determine if 4Gy-RT enhanced the functionality of pre-existing T cells, we treated the HKP1 mice with FTY720, an inhibitor of S1P receptor, which blocks egress of activated T cells from the lymph nodes26 (Extended Data Fig. 2c). As expected, FTY720 treatment by reducing circulating T cells (Extended Data Fig. 2d), confined the effect of 4Gy-RT to pre-existing T cells in lungs. FTY720 abrogated the ability of 4Gy-RT to increase IFNγ+/TNFα+/CD4+ T cells and GzmB+/CD8+ T cells, when compared to controls (Extended Data Fig. 2e). Consequently, the efficacy of 4Gy-RT and α-PD1 combination therapy was abrogated in FTY720-treated mice (Extended Data Fig. 2f). These findings suggest that 4Gy-RT does not re-invigorate dysfunctional T cells pre-existing in TME.
Despite mounting T cell responses, 4Gy-RT as a single modality did not significantly control tumor growth (Fig. 1b, 1c). Further analyses revealed that 4Gy-RT increased PD-1 expression on GzmB+/CD8+ T cells and IFNγ+/TNFα+/CD4+ T cells (Fig. 2c and Extended data Fig. 3a). We posited that PD-1 checkpoint engagement may have compromised the durability of 4Gy-RT-induced immune responses. Indeed, analyses at a later time point (Day 7 after the last RT), which showed a significant decrease in T cell infiltration and cytokine production in contrast to Day 1 (Fig. 2d). Addition of α-PD-1 antibody to 4Gy-RT significantly increased proliferation of GzmB+/CD8+ T cells and IFNγ+/TNFα+/CD4+ T cells compared to controls (Fig. 2e). Moreover, sustained T cell infiltration and effector cytokine production were observed at Day 7 in the combination treatment arm, but not in the single modality arms (Fig. 2f, Extended data Fig. 3b–c). Proliferation of active T cells is essential for the generation of central memory T cells (Tcm; CD62L+/CD44+/CCR7+), which mediate durable anti-tumor responses27. A marked expansion of Tcm was observed in secondary lymphoid tissues in the combination cohort, but not in single treatment cohorts (Extended Data Fig. 3d). Together, these findings demonstrate that 4Gy-RT combined with PD-1 blockade elicited durable anti-tumor immune responses.
4Gy-RT activates lung-resident club cells in TME.
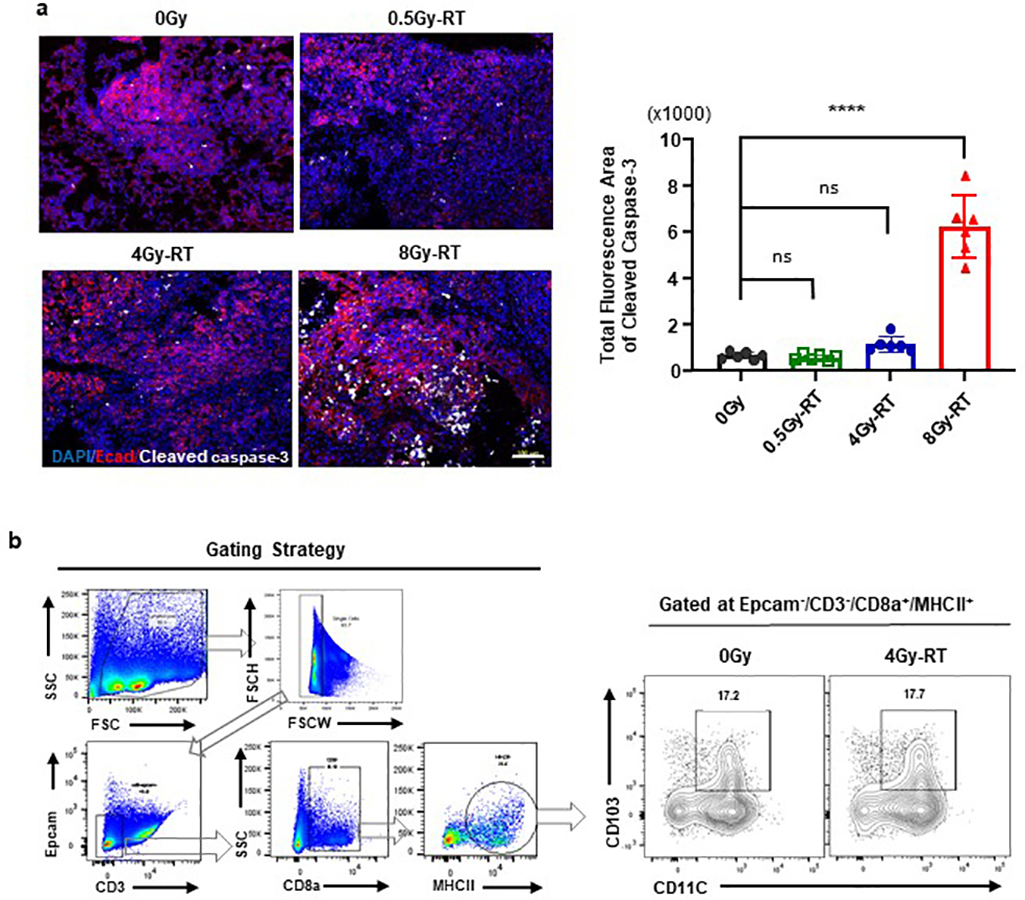
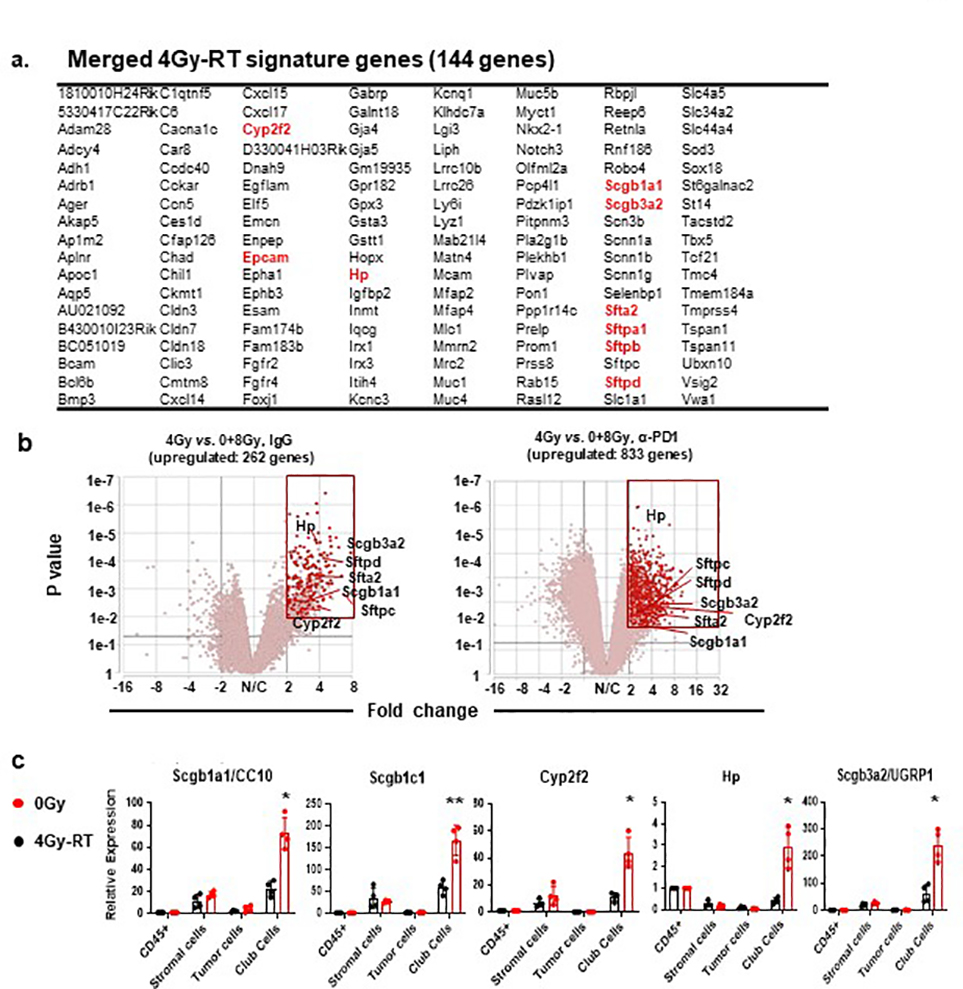
To explore mechanisms by which 4Gy-RT elicits anti-tumor immune responses, we examined RT-induced activation of dendritic cells (DCs)28,29. 4Gy-RT neither elicited tumor cell death (Extended data Fig. 4a) nor increased CD103+ cross-presenting DCs in bronchial lymph nodes (Extended data Fig. 4b). We next performed RNA-seq analyses of HKP1 lungs treated with RT (0Gy, 4Gy, or 8Gy×3) in combination with IgG or α-PD-1 antibody. Differentially expressed genes (P < 0.01, fold change ≥ 2, and LSM ≥ 5) were identified by comparing 4Gy-RT to 0Gy (mock) and 8Gy-RT (ineffective dose) groups in the presence or absence of α-PD-1 treatment. By overlapping the 4Gy-RT-upregulated genes in the IgG cohort with the α-PD-1 cohort, we identified 144 genes specifically upregulated by this effective radiation dose (Fig. 3a, Extended data Fig 5a). To identify the cellular source of these 4Gy-RT signature genes, we performed single-cell RNA-seq (scRNA-seq) analyses of HKP1-bearing lungs that received 0Gy or 4Gy-RT. By projecting the 144 signature genes to the t-SNE plot, we found that these genes were predominantly upregulated upon 4Gy-RT in the airway epithelial/club cell cluster (Fig. 3b). Gene Set Enrichment Analysis (GSEA) of the bulk RNA-seq data also revealed enrichment of airway epithelial/club cell-specific genes30,31 in mice treated with 4Gy-RT, as compared to 0Gy and 8Gy-RT (Fig. 3c). These findings suggest that 4Gy-RT may activate lung-resident club cells.
Figure 3. 4Gy-RT activates club cells in the lung microenvironment.
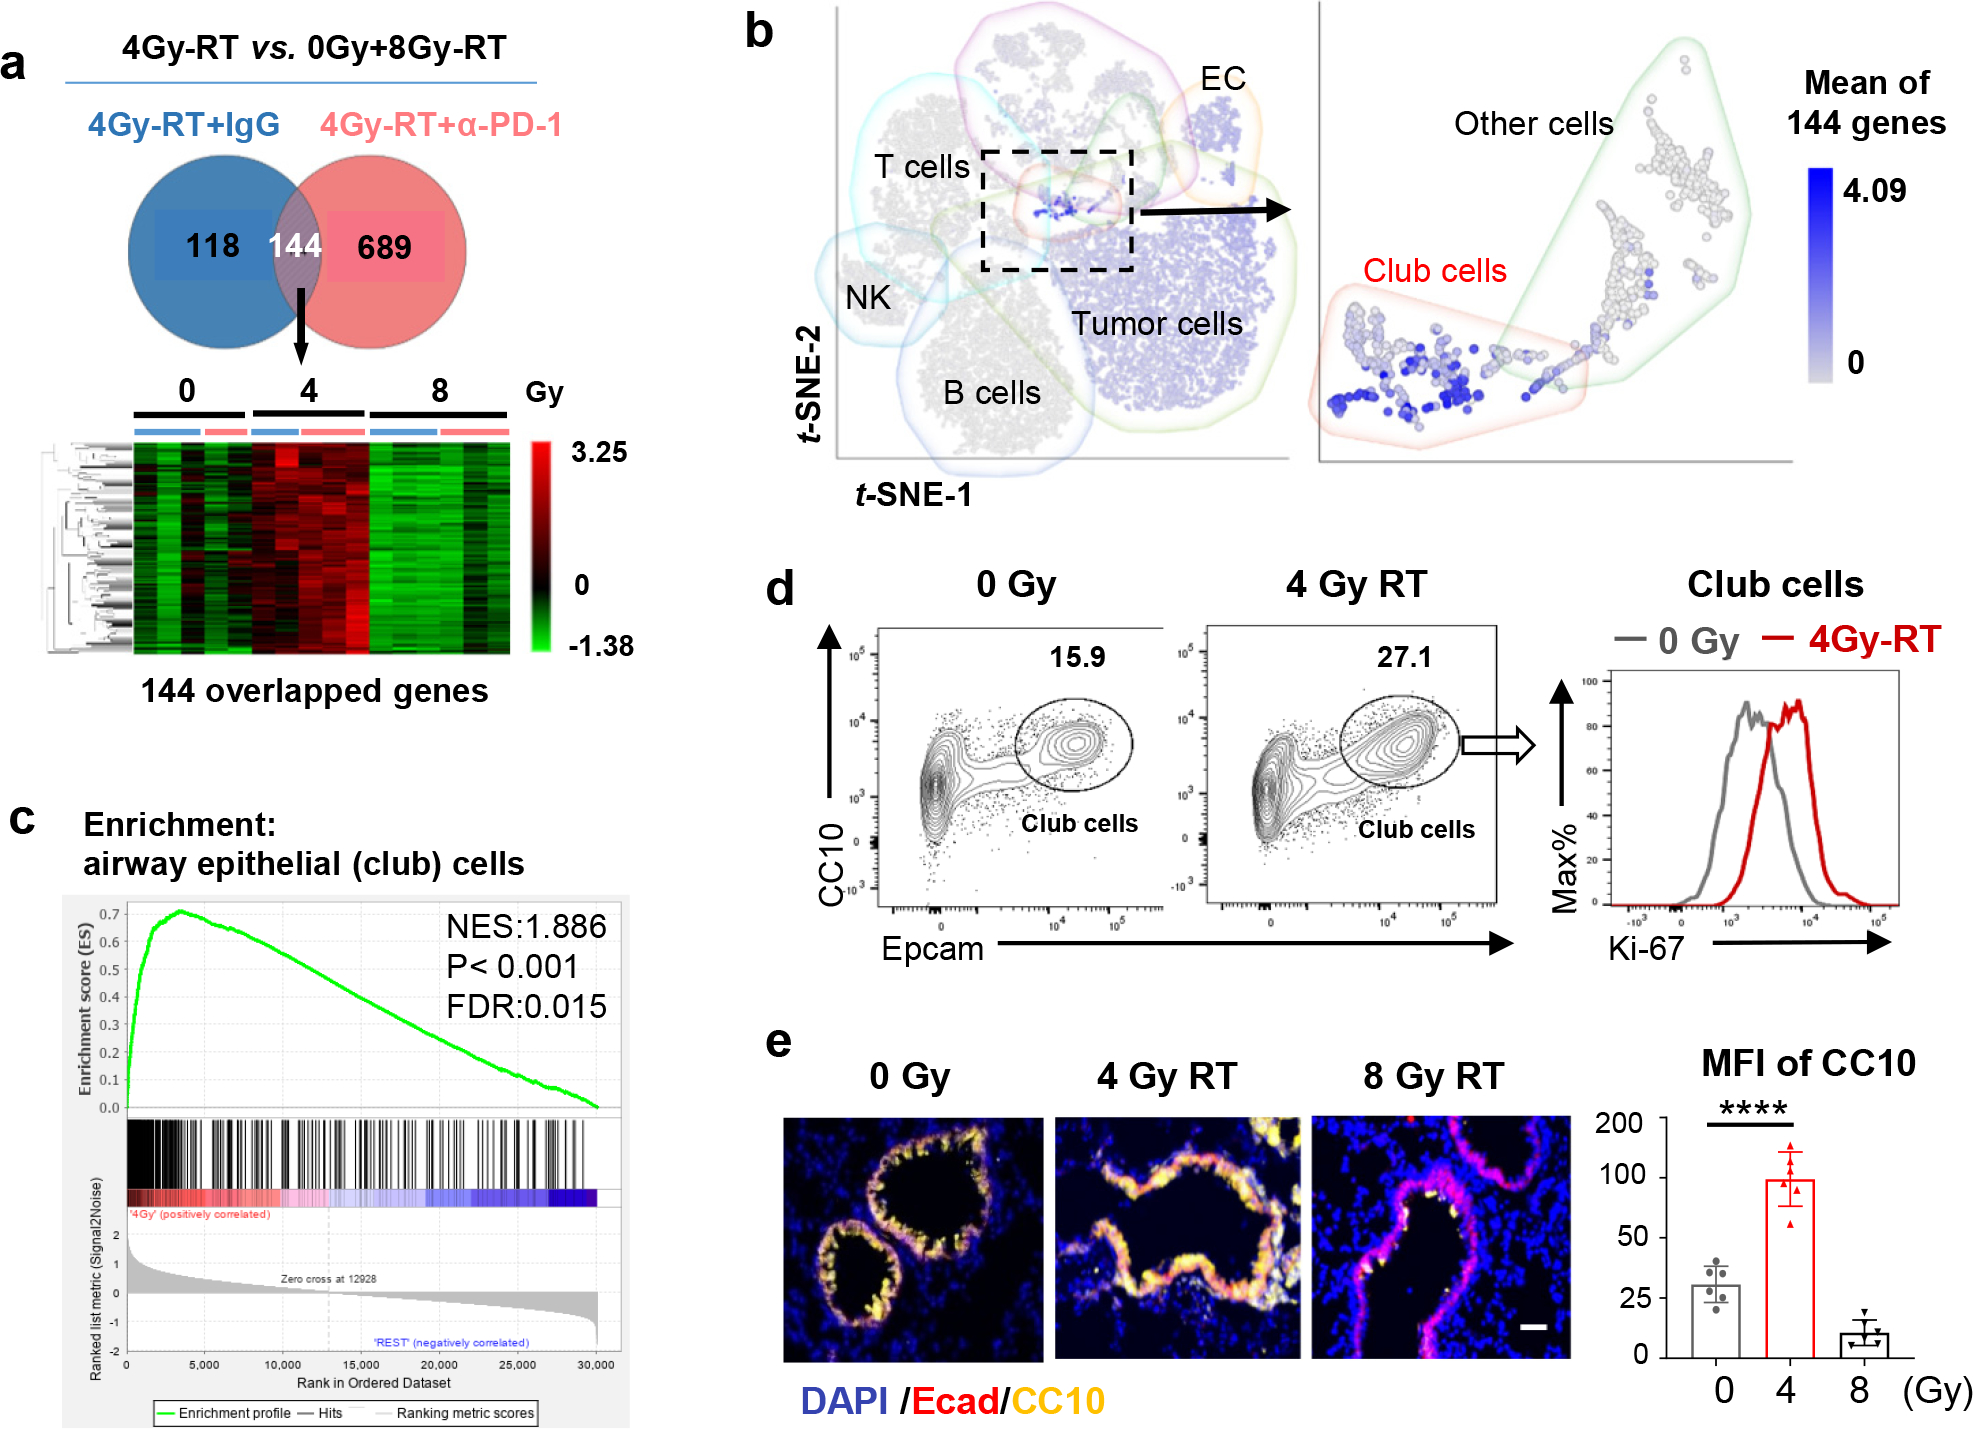
a, RNA-seq analyses HKP1 lungs treated with RT or RT in combination with α-PD1 antibody (each sample pooled from 3 individual mice, 5 samples for 0Gy and 4Gy-RT group, 6 samples for 8Gy-RT group). Genes upregulated specifically by 4Gy-RT (compared to 0Gy and 8Gy-RT) were identified in the IgG or α-PD1 cohort (two-sided adjusted P value <0.01, Fold change ≥ 2, LSMean ≥ 5). The overlapped 144 upregulated genes from two cohorts are highlighted in the heatmap (lower panel).
b, The t-SNE plot of scRNA-seq of 0Gy- and 4Gy-RT-treated HKP1 mice (lung samples pooled from 4 mice/group). The mean expression values of the 144 signature genes are highlighted in various cell clusters.
c, GSEA showing enrichment of club cell signature genes in the 4Gy-RT as compared to the 0Gy and 8Gy-RT groups (n was same as described in 3a). The Nominal P value is not adjusted for gene set size or multiple hypothesis testing.
d, Flow cytometry analysis of club cells (CD45−/mCherry−/CC10+/Epcamhi) in HKP1-lungs treated with 4Gy-RT. Percentages of club cells and their proliferation rates (Ki67+ cells) are shown (n=4 mice).
e, Representative Immunofluorescent images of n= 6 lung sections from 3 mice treated by different doses of RT as indicated. Club cells were stained with Ecadherin (Ecad) and CC10. Quantification was performed with mean fluorescence intensity (MFI). Scale Bar: 20μM. right panel, data are mean ± SEM. ****P<0.0001, One-way ANOVA with Tukey’s post-hoc test.
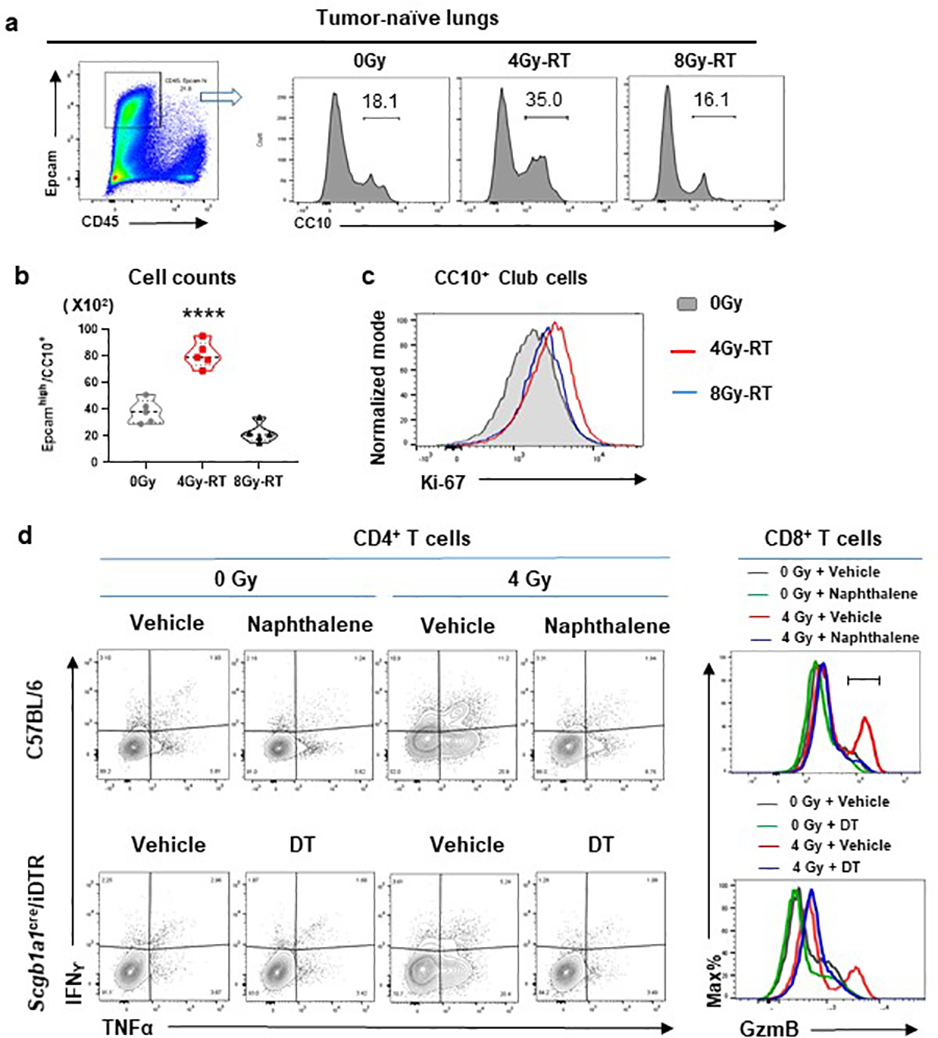
Among the 4Gy-RT signature genes were many well-characterized club cell genes32, including Scgb1a1(CC10/Uteroglobin) and Scgb3a2 (Uteroglobin-related protein 1, UGRP1), Hp (Haptoglobin), Cyp2f2 (Cytochrome P450 2F2), and genes encoding surfactant associated proteins (Sftpa1, Sftb, and Sftpd) (Extended data Fig. 5b). Quantitative reverse transcription PCR (qRT-PCR) analyses of discrete cellular populations confirmed that the expression of Scgb1a1, Scgb3a2, Scgb1c1, Hp, and Cyp2f2 was specifically upregulated upon 4Gy-RT in the club cells (Epcamhigh/CD24low)33, but not in immune (CD45+), stromal (CD45−EpCam−), or HKP1 tumor (mCherry+) cells (Extended data Fig. 5c). Flow cytometry analyses showed that 4Gy-RT resulted in the expansion and increased proliferation (Ki-67) of club cells in both HKP1-bearing and tumor-naïve lungs (Fig. 3d. Extended data Fig. 6a–c), indicating that such club cell expansion was RT-dependent, yet tumor-independent. Moreover, microscopic analyses confirmed increased CC10+ fluorescence intensities in the bronchiolar epithelium region of lungs treated with 4Gy-RT, but not 8Gy-RT (Fig. 3e). Together, these results suggest that 4Gy-RT selectively activates lung-resident club cells.
Club cell secretome contributes to the efficacy of the combination treatment.
Club cells are non-ciliated exocrine epithelial cells lining the pulmonary bronchioles. They protect the bronchiolar epithelium from xenobiotic agents34,35 by proliferating and repairing damaged airway epithelia36,37. We hypothesized that 4Gy-RT may have elicited moderate damages to lung epithelia, and in turn elicited protective responses of club cells. We employed both pharmacological and genetic approaches to selectively deplete club cells prior to RT. As a pharmacological approach, we used naphthalene (NP)38, which is metabolized to a cytotoxic product by club cell-specific Cyp2f238,39 (Fig. 4a, upper). HKP1-bearing mice treated with NP demonstrated specific yet efficient loss of club cells (Fig. 4b, upper). As a genetic approach, Scgb1a1-CreERT/LSL-DTR mice were administered with tamoxifen to drive the CRE-mediated expression of diphtheria toxin receptor (DTR) specifically by club cells (Fig. 4a, lower), and subsequent treatment with diphtheria toxin (DT) resulted in depletion of club cells (Fig. 4b, lower). Regardless of the depletion approach, club cell loss blunted the immune responses to 4Gy-RT in HKP1-bearing lungs, exemplified by significantly dampened T cell infiltration into tumor islets and reduced effector cytokine production (IFNγ/TNFα in CD4+ and GzmB in CD8+ T cells) (Fig. 4c, Extended data Fig. 6d). Importantly, club cell deficiency abolished the therapeutic efficacy of the combination treatment in HKP1-bearing mice (Fig. 4d).
Figure 4. Club cells contribute to the efficacy of the combination treatment.
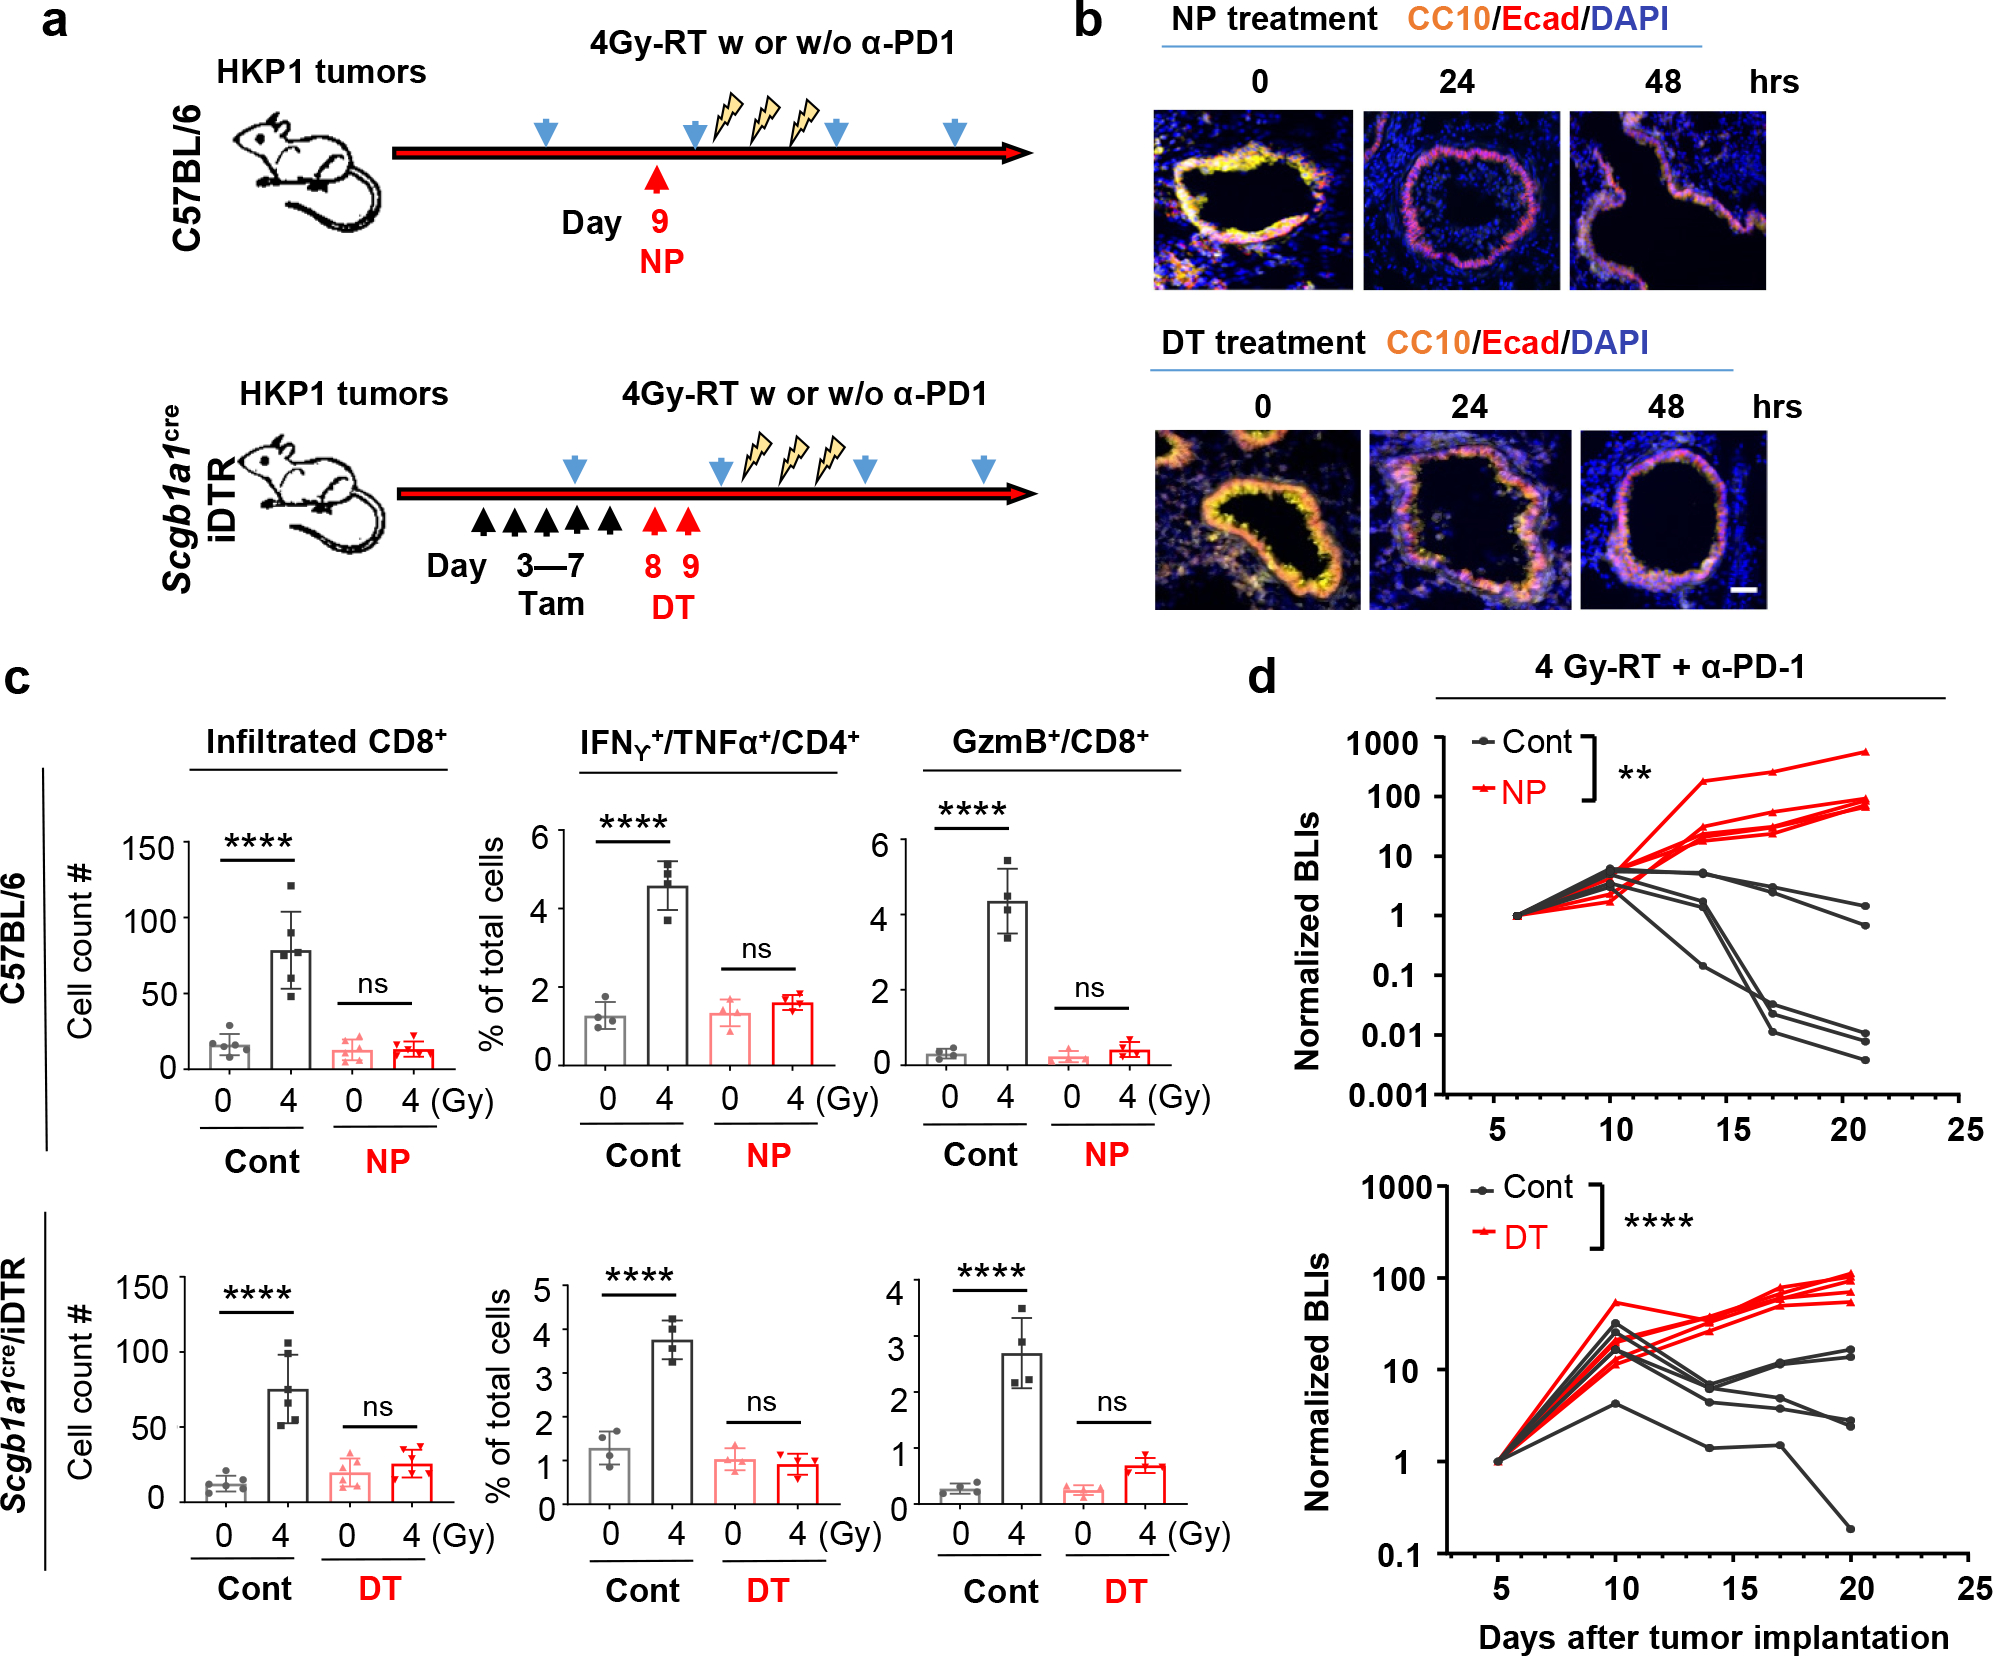
a, Schematic depicting club cell depletion strategies. As a pharmacological approach (Upper), HKP1 mice were treated with naphthalene (NP, 200mg/kg, i.p) at Day 9 post-tumor implantation. As a genetic approach (Lower), Scgb1a1Cre/iDTR mice with HKP1 tumors were treated with Tamoxifen (Tam, 2mg/mouse, i.p.) for 5 consecutive days (Day 3–7), followed by 2 doses of Diphtheria toxin (DT, day 8–9). Animals also received 4Gy-RT with or without α-PD1 antibody treatment as illustrated.
b, Representative immunofluorescent images (20x) of n=10 lung sections from 3 mice pre- vs. post- club cell depletion. CC10+ cells are shown at 24hr and 48hr post-treatment.. Scale Bar: 20 μM.
c, Quantification of the infiltrated CD8+ T cells (left, n=6 sections from 3 mice/treatment), IFNγ+/TNFα+/CD4+ T cells (middle, n=4 tumor-bearing lungs) and GzmB+ CD8+ T cells (right, n=4 tumor-bearing lungs) in HKP1 lungs with or without club cells at 1 day after 4Gy-RT. middle and right: Cytokine+ T cell % of total single cells of HKP1-bearing lungs. Data are mean ± SEM. ****P<0.0001, One–way ANOVA with Tukey’s post-hoc test; ns, non-significant.
d, Tumor growth curves showing responses to the combination therapy in mice with or without club cells. (Upper: pharmacological depletion; lower: genetic depletion). Cont vs.NP, n=5 mice, **P=0.0055; Cont vs.DT, n=5 mice, ****P<0.0001, two-way ANOVA with Sidak’s test.
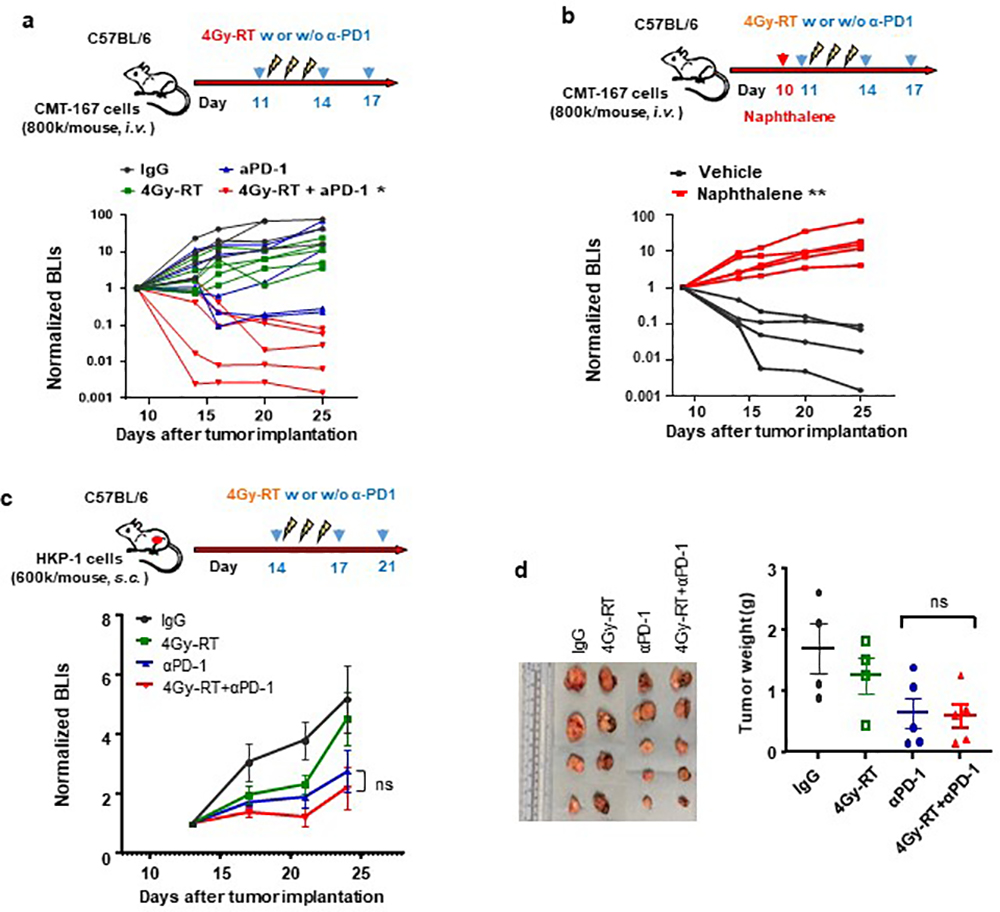
To confirm the essential role of club cells in NSCLC, we employed another orthotopic NSCLC model, CMT-16740,41. Consistently, 4Gy-RT significantly improved the efficacy of PD-1 blockade in CMT-167-bearing mice (Extended data Fig. 7a), in a club cell-dependent fashion (Extended data Fig. 7b). To further investigate the necessity of lung-resident club cells in mediating therapeutic efficacy, we administered combination therapy to HKP1 tumors grown subcutaneously in the flank (Extended data Fig. 7c). As expected, in the absence of club cells in the flank region, 4Gy-RT failed to improve the efficacy of PD-1 blockade (Extended data Fig. 7c, 7d). Collectively, these findings suggest that RT-activated club cells mediate the efficacy of the combination treatment.
Further characterization of club cells using electron microscopy showed increased number of secretory vesicles in club cells sorted from 4Gy-RT treated lungs compared to controls (Extended Data Fig. 8a, 8b). We posited that the secretome of post-RT club cells may play a role in increasing efficacy of ICI. To address this, we blocked the release of club cell secretory proteins into lung TME using the Scgb1a1-CreER™/Snap23flox/flox transgenic mice (abbreviated as Scgb1a1cre/Snap23fl/fl). The synaptosome-associated protein 23 (SNAP23) is a key component of the SNARE complex which mediates intracellular vesicle fusion to membranes to regulate exocytosis42. Tamoxifen treatment of Scgb1a1cre/Snap23fl/fl mice allowed conditional club cell-specific deletion of Snap23 gene (Fig. 5a), without any alteration in the integrity of bronchioles (Extended data Fig. 8c). Analyses of the bronchoalveolar lavage fluid (BALF) confirmed a significant reduction of CC10, a component of club cell secretome, in 4Gy-RT treated Scgb1a1cre/Snap23fl/fl mice compared to WT controls (Fig. 5b). Consistent with club cell ablation, SNAP23 deficiency abrogated T cell infiltration and activation in response to 4Gy-RT in HKP1 lungs (Fig. 5c, Extended data Fig. 8d), and importantly, the combination therapy failed to control HKP1 tumor growth in Scgb1a1cre/Snap23fl/fl mice compared to controls (Fig. 5d). Collectively, these results suggest that the efficacy of combination therapy relies on RT-enhanced secretory function of club cells.
Figure 5. Club cell secretome contributes to the efficacy of the combination treatment.
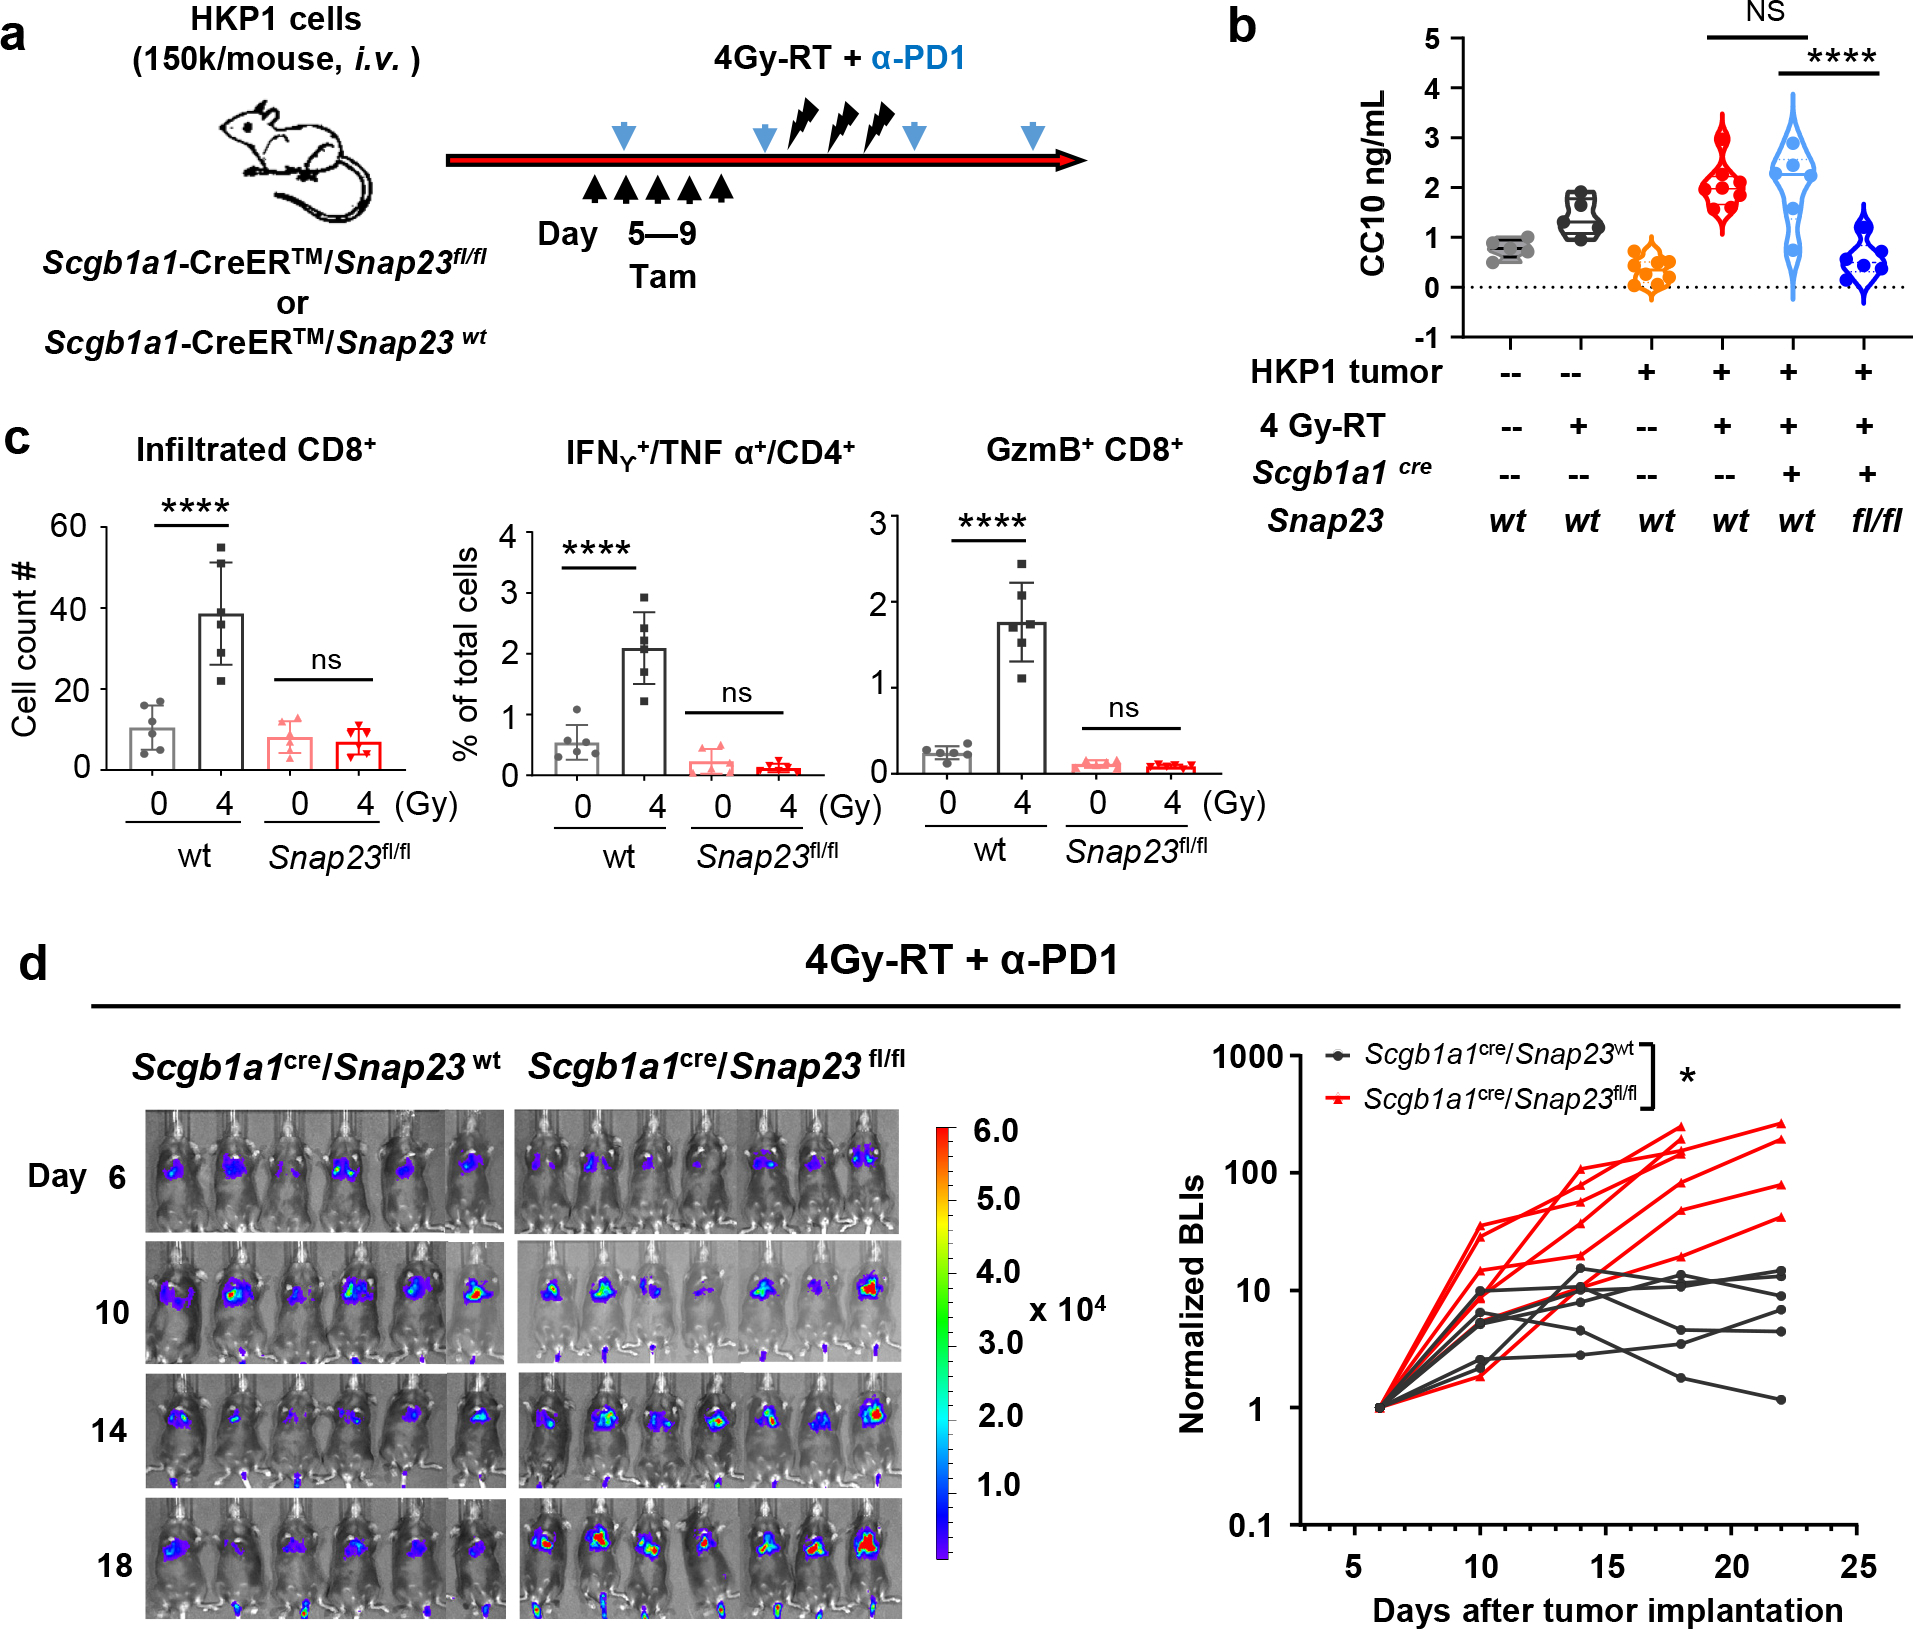
a, Experimental schema for timely and selective knockout of Snap23 gene in club cells. HKP1 mice Scgb1a1Cre/Snap23fl/fl mice were treated with tamoxifen (Tam, 2mg/mouse, i.p.) for 5 consecutive (Day 5–9) days. All animals in d also received 4Gy-RT + α-PD1 antibody treatment. Scgb1a1Cre/Snap23wt littermates served as controls.
b, ELISA of CC10 in BALF collected at 1 day after 4 Gy-RT from Scgb1a1Cre/Snap23wt and Scgb1a1Cre/Snap23fl/fl mice. Naïve and HKP1-bearing C57BL/6 mice with or without 4Gy-RT served as controls. Naïve, n=5 mice; HKP1, n=8 mice, Scgb1a1cre/Snap23wt or fl/fl, n=6 mice. ****P<0.0001; ns, non-significant, P>0.99. one-way ANOVA with Tukey’s post-hoc test.
c, Quantification of the infiltrated CD8+ T cells, IFNg+/TNFα+ CD4+ and GzmB+/CD8+ T cells in HKP1 lungs of Scgb1a1Cre/Snap23wt (wt control) or Scgb1a1Cre/Snap23fl/fl mice at 1 day after 4Gy-RT or mock treatment (0Gy). Data are mean ± SEM. n=6 tumor-bearing lungs, ****P<0.0001, ns, non-significant, P>0.94. one-way ANOVA with Tukey’s post-hoc test.
d, BLIs and tumor growth curves showing the impact of club secretome deficiency on responses to the combination therapy. Scgb1a1Cre/Snap23 wt :n=6 mice; Scgb1a1Cre/Snap23fl/fl :n=7 mice *P=0.0408. Two-way ANOVA with Sidak’s post-hoc test.
Club cells reduce tumor-promoting inflammation.
Club cells are integral in maintaining lung homeostasis and are believed to be the cell of origin of lung adenocarcinoma43,44. Club cell secretoglobins (CC10 and UGRP1) and surfactant-associated proteins (SP-A and SP-D) have been reported to confer anti-inflammatory and immunomodulatory functions in conditions of allergy, asthma, and COPD45–48,49,50. However, the role of club cells in regulating immune responses to ICI in NSCLC has not been elucidated.
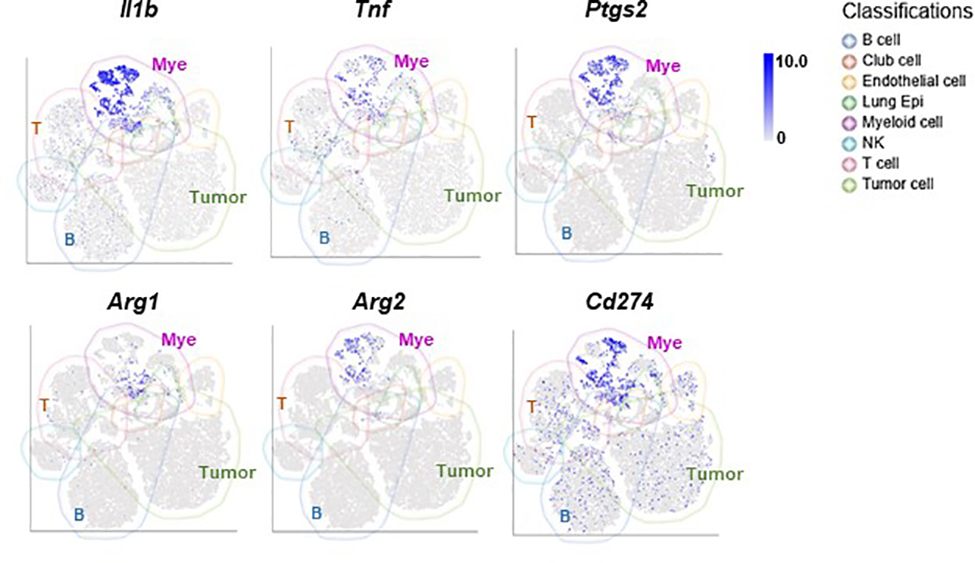
To gain insights into immunomodulatory activities of club cells and their contribution to the efficacy of combination therapy in NSCLC, we treated HKP1 mice with 4Gy-RT and α-PD1 antibody in the presence or absence of club cells as described in Fig. 4a (lower). HKP1 lungs were harvested 1 day after the last RT to eliminate the confounding effects of tumor burden. CD45+ cells were flow-sorted for scRNA-seq to enable deep characterization of the immune TME. Dimensionality reduction using Uniform Manifold Approximation and Projection (UMAP) showed distinct immune populations including B cells, T cells, NK cells, MDSCs, TAM, and other myeloid cells (Fig. 6a, Supplementary Table 1). The myeloid cells represented one of the dominant immune populations with high mRNA levels of inflammatory mediators (Il1b, Ptgs2, Tnf, etc.) and immunosuppressive molecules (Arg1, Arg2, Cd274, etc.) (Extended data Fig. 9). Indeed, autocrine TNFα and IL-1β signalings are known to drive expansion and immunosuppressive function of myeloid-derived suppressor cells51.
Figure 6. Club cells contribute to the immune landscape in HKP1 mice treated with combination therapy.
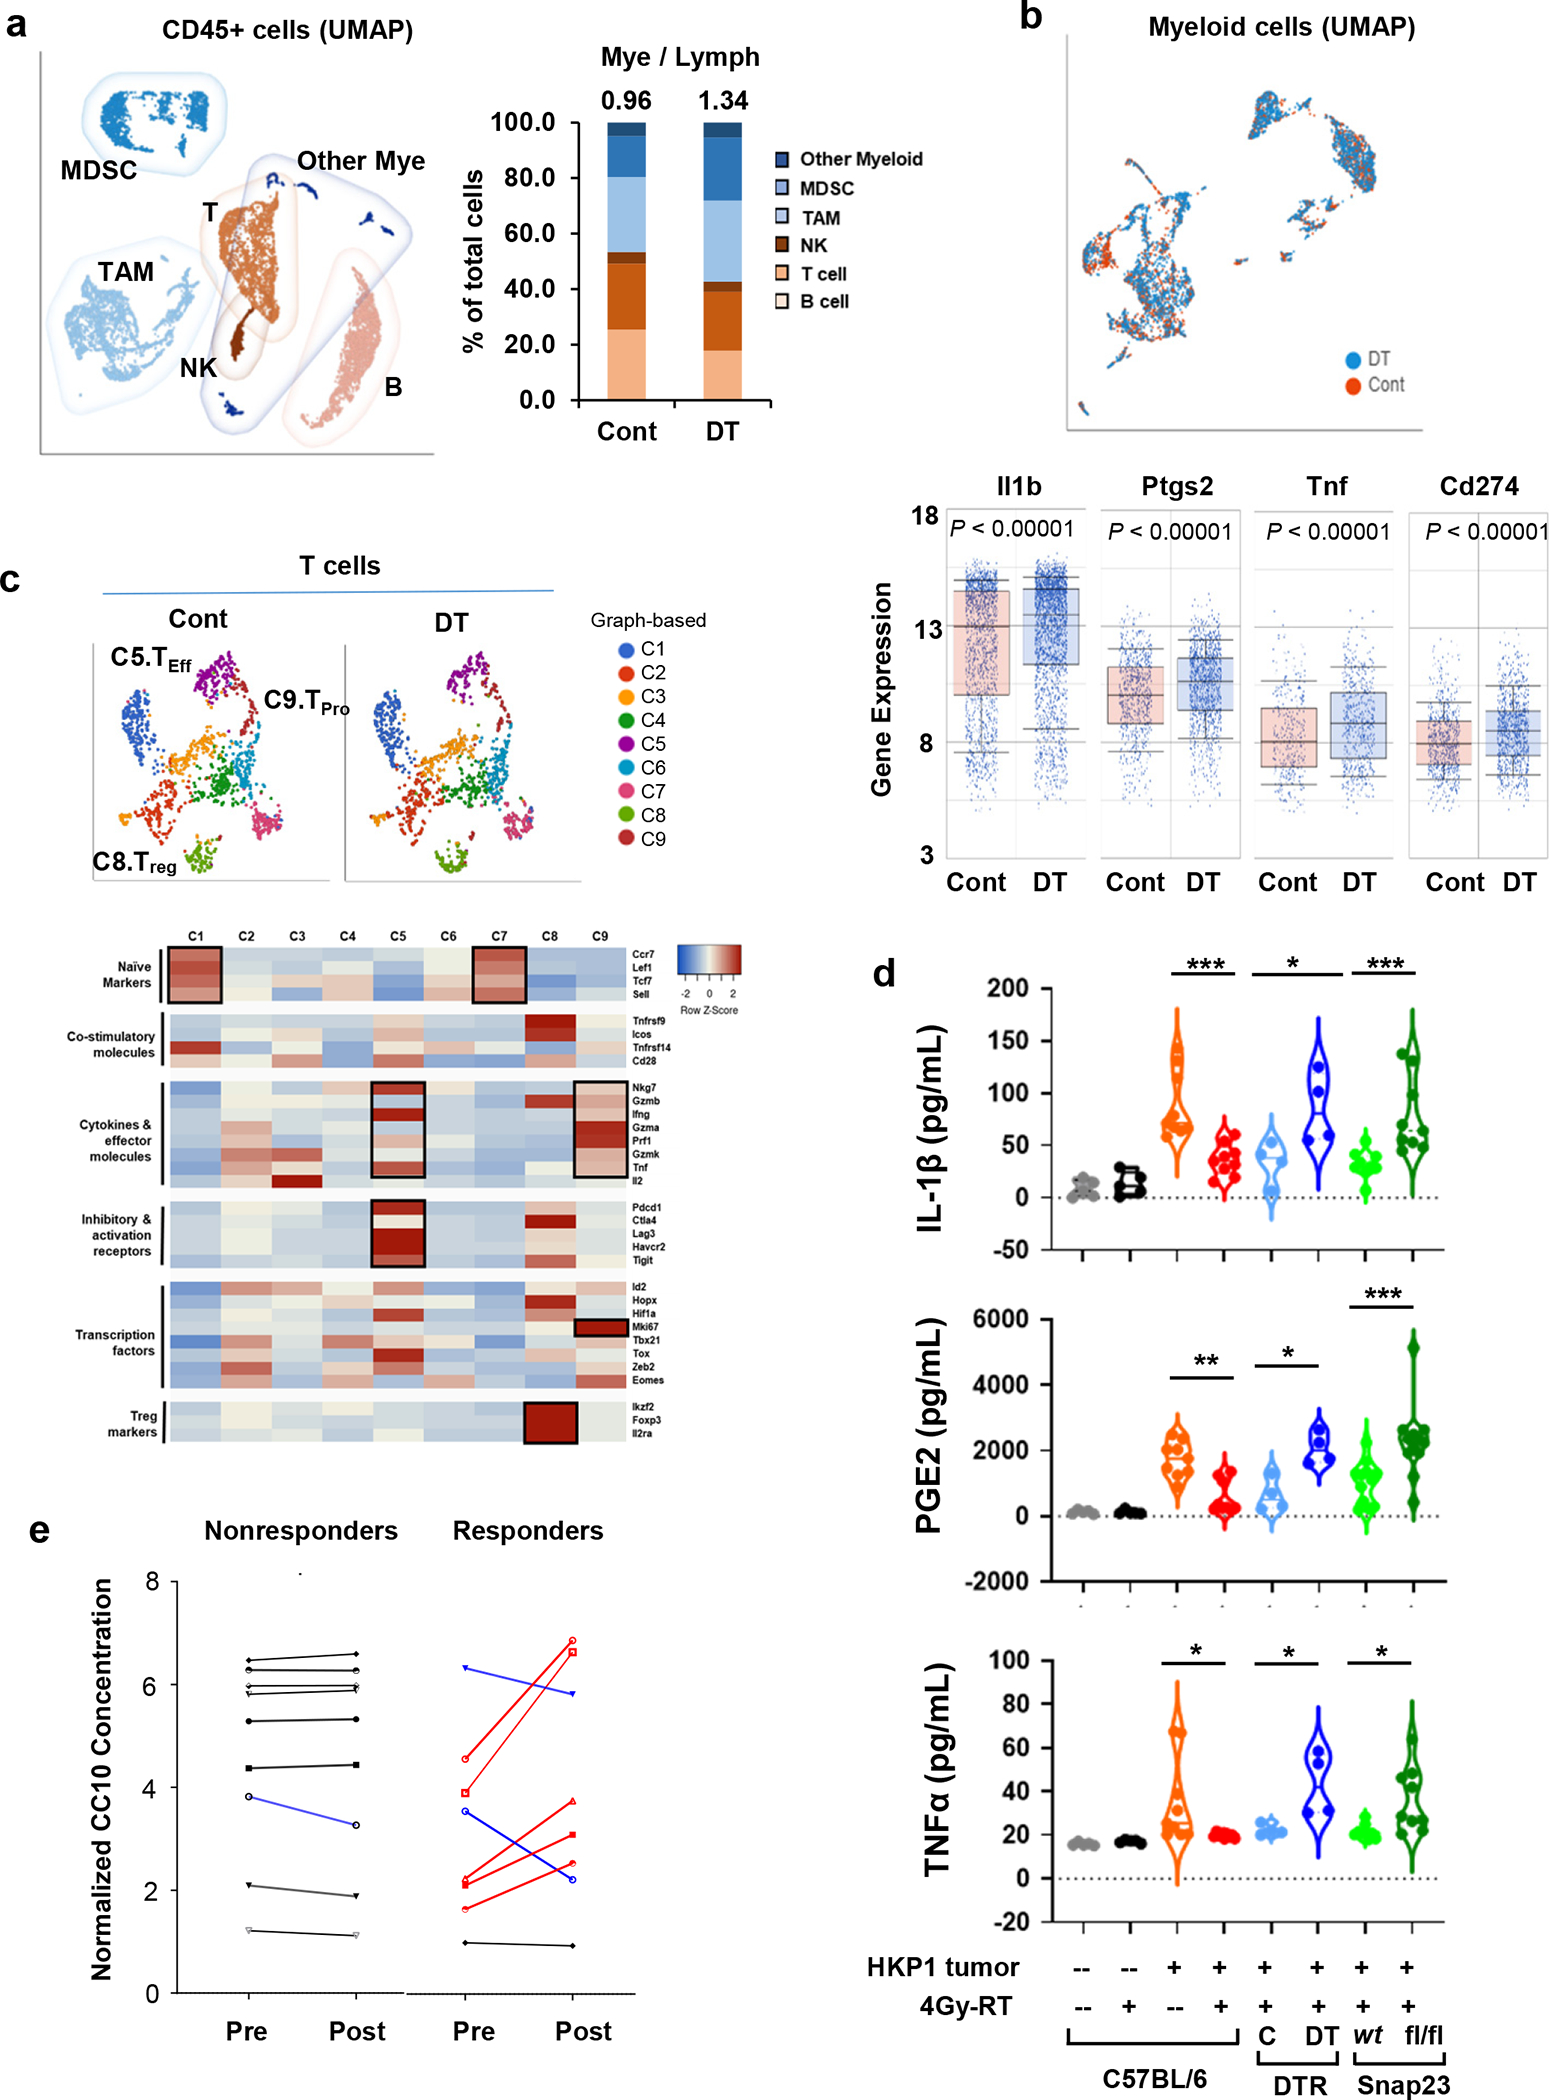
a, Left, UMAP depicting discrete clusters of CD45+ cells from PBS-(Cont) or diphtheria toxin (DT)- treated Scgb1a1Cre/iDTR HKP1 mice. Both groups received the combination therapy. Subpopulations of myeloid-derived suppressor cells (MDSCs), Tumor-associated macrophages (TAMs) and other myeloid cells, T cells (T), B cells (B), Natural killer cells (NK) are indicated. Each sample was pooled from 4 mice/group. Right, Quantification of the myeloid- and lymphoid-lineage cells as percentage of the total CD45+ cells. Numbers indicate the ratio of Mye/Lymph.
b, Upper, UMAP of the myeloid cell populations from mice described in a. Lower, the differential expression of inflammation-related genes (Il1b, Ptgs2, Tnf, and Cd274) in the myeloid compartment (n=2396 cells for cont, and n=3124 cells for DT treated sample). Center lines of box plots denote median values. Top whiskers denote 90% percentile; bottom whiskers denote 10% percentile. P< 0.0001, unpaired two-tailed Student t test.
c, Upper, t-SNE plots showing the graph-based classification of T cells from mice described in a. Lower, Heatmap showing feature genes of each T clusters. Of note, C5 (Teff) predominantly expresses the effector cytokines and T cell activation markers; C8 (Treg) shows high expression of Treg markers; and C9 (Tpro) expresses effector cytokines and Ki67. Differentially-expressed genes in each T cluster are highlighted in black boxes.
d, ELISA of inflammatory factors (IL-1β, PGE2 and TNFα) in the BALF. BALF were collected at Day 14 after tumor implantation from mice with or without 4Gy-RT and with or without functional club cells as indicated. Naïve: n=5 mice; HKP1-bearing: n=9 mice; Scgb1a1cre/iDTR: n=4 mice; Scgb1a1cre/Snap23wt or fl/fl: n=9 mice for IL-1β and TNFα, n= 12 mice for PGE2. HKP1-bearing 0Gy vs. 4Gy-RT: ***P=0.0001 (IL-1β), **P=0.0023 (PGE2) and *P=0.0206 (TNFα); Scgb1a1cre/iDTR Cont vs. DT, *P=0.0166 (IL-1β), *P=0.0159 (PGE2) and *P=0.0363 (TNFα); Scgb1a1cre/Snap23wt vs.Scgb1a1cre/Snap23 fl/fl , ***P=0.0008(IL-1β), ***P=0.0001 (PGE2) and *P=0.0264 (TNFα). One-way ANOVA with Sidak’s post-hoc test.
e, ELISA of CC10 in patients’ plasma. NSCLC patient’s blood was collected pre- and 1 day post-radiation. CC10 concentrations in plasma from the same patient were compared and correlated with pathological responses. Patients’plasma showing significant increases are highlighted in red, significant decreases are highlighted in blue. The paired fold changes, non-responders vs. responders, P=0.0301, unpaired two-tailed Student t test. Non-responder: n=9 plasma samples. Responder: n=8 plasma samples.
Club cell-deficient (DT-treated) lungs showed an increased myeloid-to-lymphocyte ratio (Mye/Lym, 0.96 and 1.34 in control and DT-treated mice respectively, Fig. 6a). Furthermore, the myeloid cells in the club cell-deficient lungs showed increased expression of inflammatory mediators, such as Il1b, Ptgs2, and Tnf (Fig. 6b), which have been reported to suppress adaptive anti-tumor immunity51–53.
We posited that these club cell-mediated alterations in TME could have affected T cell effector phenotypes. Using graph-based classification, T cells were binned into 9 clusters (Fig. 6c), and the functional status of each cluster was determined according to their feature genes (Fig. 6c, Supplementary Table 2). We observed that the effector T cell cluster (C5) showed increased expression of cytokines, effector molecules (IFNγ and TNF), and T cell activation markers (Pdcd1 and Ctla4); the proliferating T cell cluster (C9) showed Granzyme and Ki67 expression; Treg cluster (C8) was marked with Foxp3 and Il2ra expression (Fig. 6c). Importantly, club cell depletion (DT treatment) lowered the ratio of effector to proliferating T cells to Tregs [(C5+C9)/C8], when compared to the control (2.63 and 1.96 in control and DT-treated, respectively). Together, these scRNA-seq results suggest that the presence of RT-activated club cells contributes to adaptive anti-tumor immunity, presumably by restricting the myeloid-cell-mediated inflammation in HKP1 tumors.
ELISA of BALF samples showed that 4Gy-RT significantly decreased levels of IL-1β, PGE2, and TNFα in the HKP1 TME compared to 0Gy controls (Fig. 6d); however, in the absence of club cells (DT-treated Scgb1a1cre/iDTR) or their secretome (Scgb1a1cre/Snap23fl/fl), 4Gy-RT failed to reduce these inflammatory factors (Fig. 6d). To demonstrate the clinical relevance of RT-induced club cell secretome, we evaluated the plasma of NSCLC patients who received RT in combination with ICI (anti-PD-L1) in a phase II neoadjuvant clinical trial (NCT02904954)54. Plasma was collected from individual patients 1 day before the first dose of SBRT and 1 day after the last dose of SBRT. Comparison of CC10 plasma concentrations from matched patients (pre- vs. post-RT) revealed that the majority of patients who achieved pathological improvement had elevated levels of plasma CC10 after RT (5/8), in contrast to patients who did not respond (0/9, P =0.0301) (Fig. 6e), indicating that club cell activation is associated with pathological response to the combination treatment. Together, these findings suggest that RT-activated club cells thwart pro-tumor inflammation in HKP1 lungs through their secretome, resulting in enhanced adaptive anti-tumor immunity.
Club cell factors improve efficacy of PD-1 blockade.
Analysis of Scgb1a1cre/Snap23fl/fl mice suggested that the club cell secretome was essential in mediating efficacy of the combination treatment. To directly demonstrate the role of club cell secretory factors, we individually expressed 8 club cell secretory proteins that constitute the most significantly upregulated club-cell specific genes in response to 4Gy-RT (P <0.05, Fold change > 2) (Extended data Fig. 10a). These included SP-A, SP-B, SP-D, Haptoglobin, Secretoglobin family proteins (1A member 1, 3A member 1, 3A member 2, and 1C member 1)30,31. Expression of each protein was confirmed by immunoblotting against the common Flag tag (Extended data Fig. 10b). These proteins were pooled to generate a “club cocktail”.
We first determined the effect of the club cocktail in overcoming immunosuppressive activity of myeloid-derived suppressor cells (MDSCs) (Extended data Fig. 10c). Activations of the Janus kinase/Signal transducer and activator of transcription (Jak1/Stat3) and MAPK pathways induced by GM-CSF/IL-6 are known to contribute to MDSCs expansion and immunosuppressive functions55,56. HKP1 supernatant maintained the activation of Jak1/Stat3 and MAPK pathways in MDSCs (Fig. 7a). In contrast to controls, MDSCs treated with club cocktail (4ng/ml/factor) exhibited significantly lower levels of phosphor-Jak1, Stat3, and Erk, recapitulating treatment with BALF-derived from HKP1 lungs that received 4Gy-RT (Fig. 7a). Importantly, the impeded Jak1/Stat3 and MAPK signaling was associated with the concomitant decrease in expression of downstream inflammatory and immunosuppressive mediators, including Ptgs2, Il1b, Tnf, CD274, Arg1/2, Nos2, and Il6 (Fig. 7b). Consistently, immunofluorescence staining confirmed that the club cocktail had reduced the expression of Arg1 and iNOS in MDSCs (Extended data Fig. 10d).
Figure 7. Club secretory proteins reduce immunosuppressive functions of MDSCs.
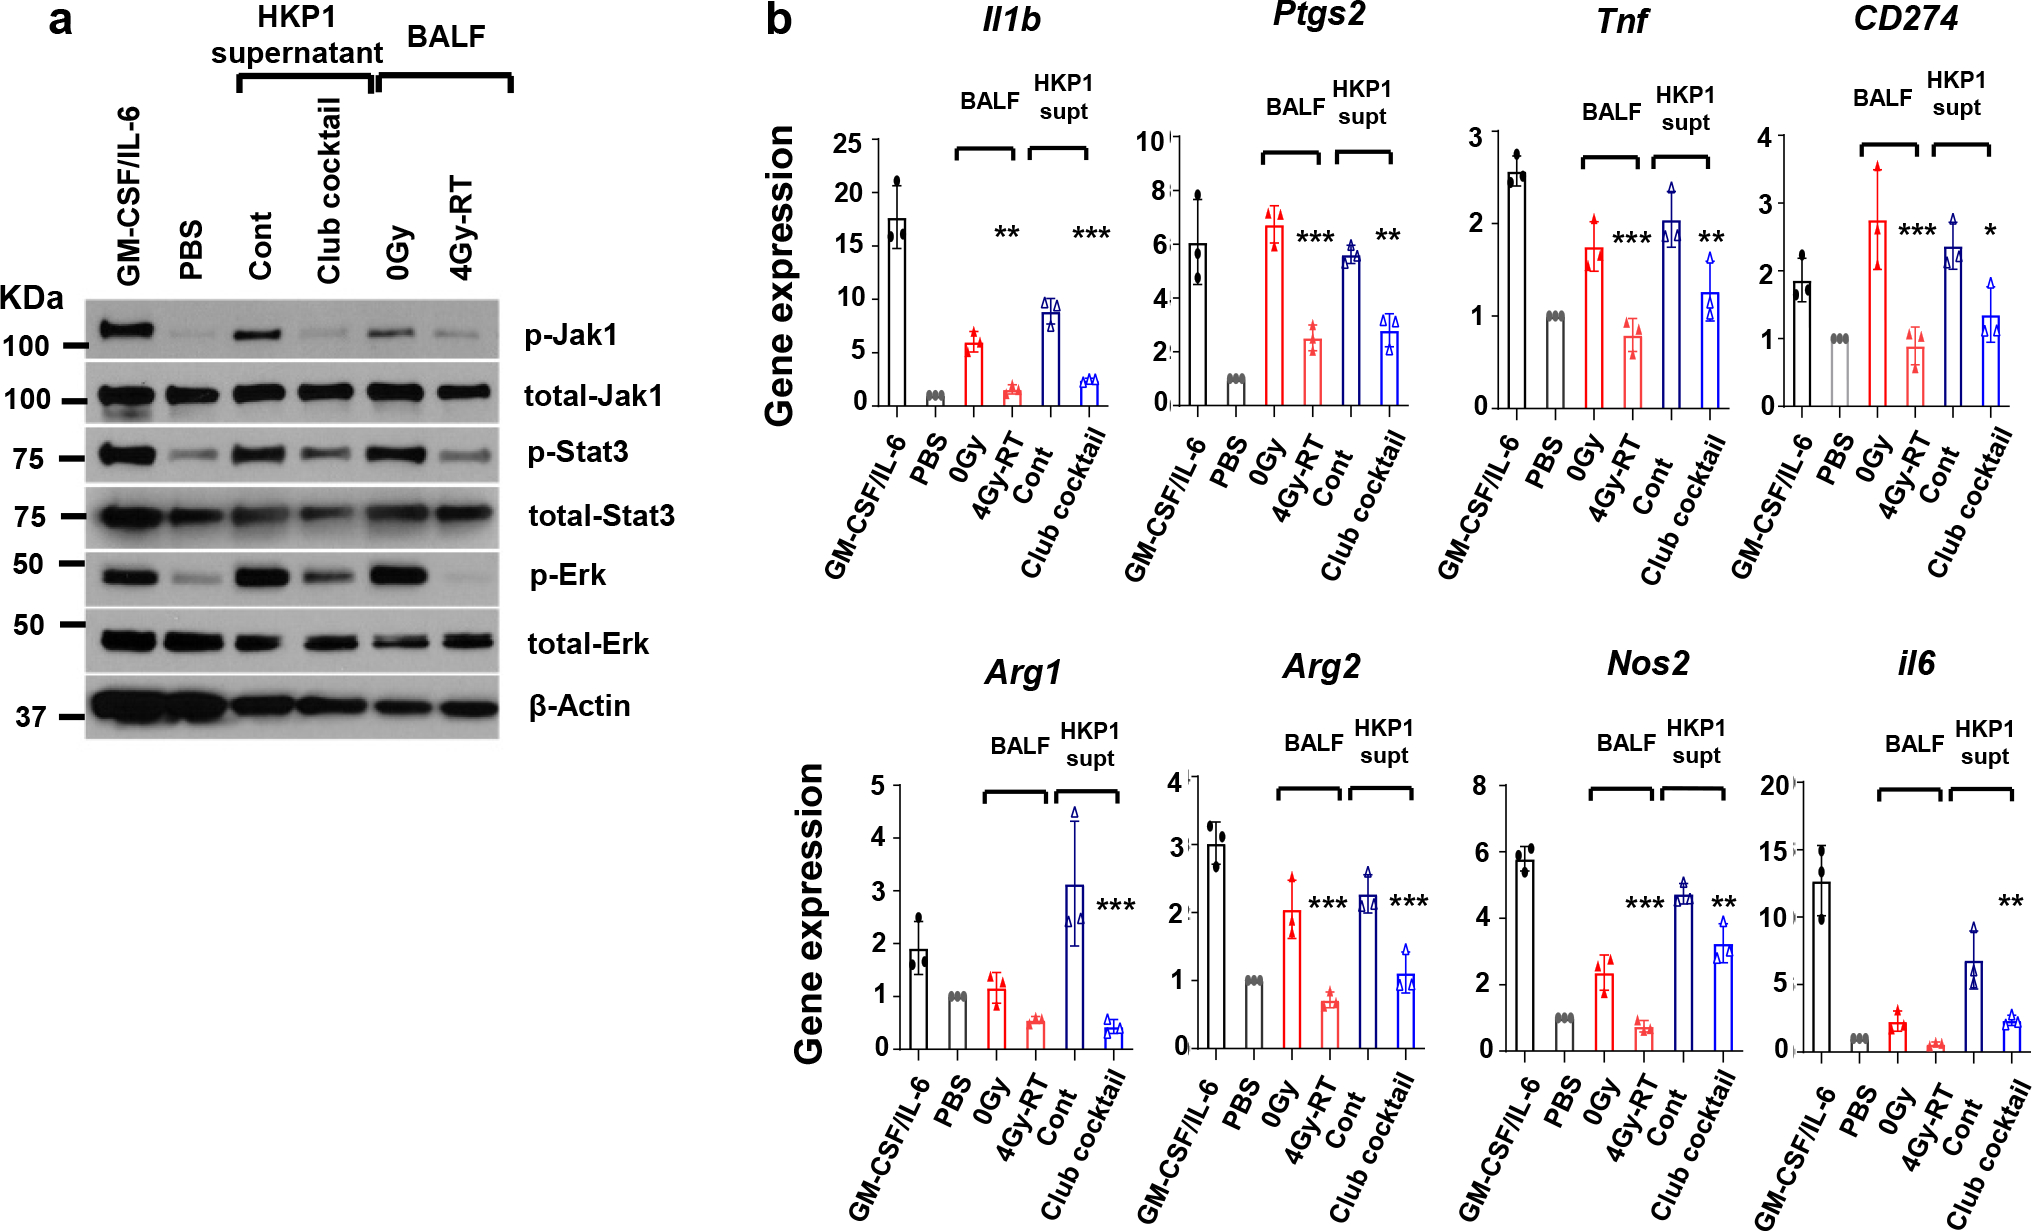
a. Western blot analyses of Jak-Stat and Ras/MAPK signaling in MDSCs in response to club secretory proteins. BM-derived MDSCs were treated with GM-CSF/IL-6 (positive control), PBS (negative control), HKP1 supernatant with and without Club cocktail, or BALF collected from 0Gy- or 4Gy-RT-treated HKP1 lungs. a representative blot of n = 2 independent repeats with similar results.
b. RT-PCR analyses of MDSC immunosuppressive and inflammatory mediators. MDSCs were treated as described in a. n=3 independent experiments. Data are mean ± SEM. one-way ANOVA with Sidak’s post-hoc test. For 0Gy vs. 4Gy-RT comparison: **P=0.0055 (Il1b); ***P < 0.0001 (Ptgs2); ***P=0.0008 (Tnf); ***P=0.0004 (Cd274); P=0.47 (Arg1); ***P=0.0002 (Arg2); ***P=0.0007 (Nos2); P=0.44 (Il6). For cont vs. club cocktail comparison: ***P=0.0003 (Il1b); **P= 0.0026 (Ptgs2); **P= 0.0045 (Tnf); *P= 0.031 (Cd274); ***P=0.0002 (Arg1); ***P=0.0008 (Arg2); **P=0.0014 (Nos2); ***P=0.0007 (Nos2); **P=0.0069 (Il6).
These in vitro findings led us to investigate whether the club cocktail could mirror the effects of 4Gy-RT in improving PD-1 blockade in vivo. We intranasally administered club cocktail (20ng/protein/mouse) to HKP1 mice per day for 3 days (Day 11–13) in combination with α-PD-1 antibody (Fig. 8a). Remarkably, club cocktail treatment in combination with α-PD-1 antibody elicited significant tumor control and improved survival of HKP1 mice compared to mock controls (Fig. 8b–c). Similar to 4Gy-RT, BALF analyses showed lower levels of TNFα, PGE2, and IL-1β in club cocktail-treated mice compared to the controls (Fig. 8d). Finally, to determine if combination treatment of club cocktail and α-PD-1 antibody resulted in durable anti-tumor immunity, we performed a tumor re-challenge experiment. Indeed, the surviving mice cleared the tumor cells in lungs within 3–5 days compared to naive controls (Extended data Fig. 10e). Together, these findings suggest that club secretory proteins improve efficacy of PD-1 blockade by inhibiting immunosuppressive MDSCs and enhancing T cell functions.
Figure 8. Intranasal administration of club cocktail improves therapeutic efficacy of α-PD-1 antibody in vivo.
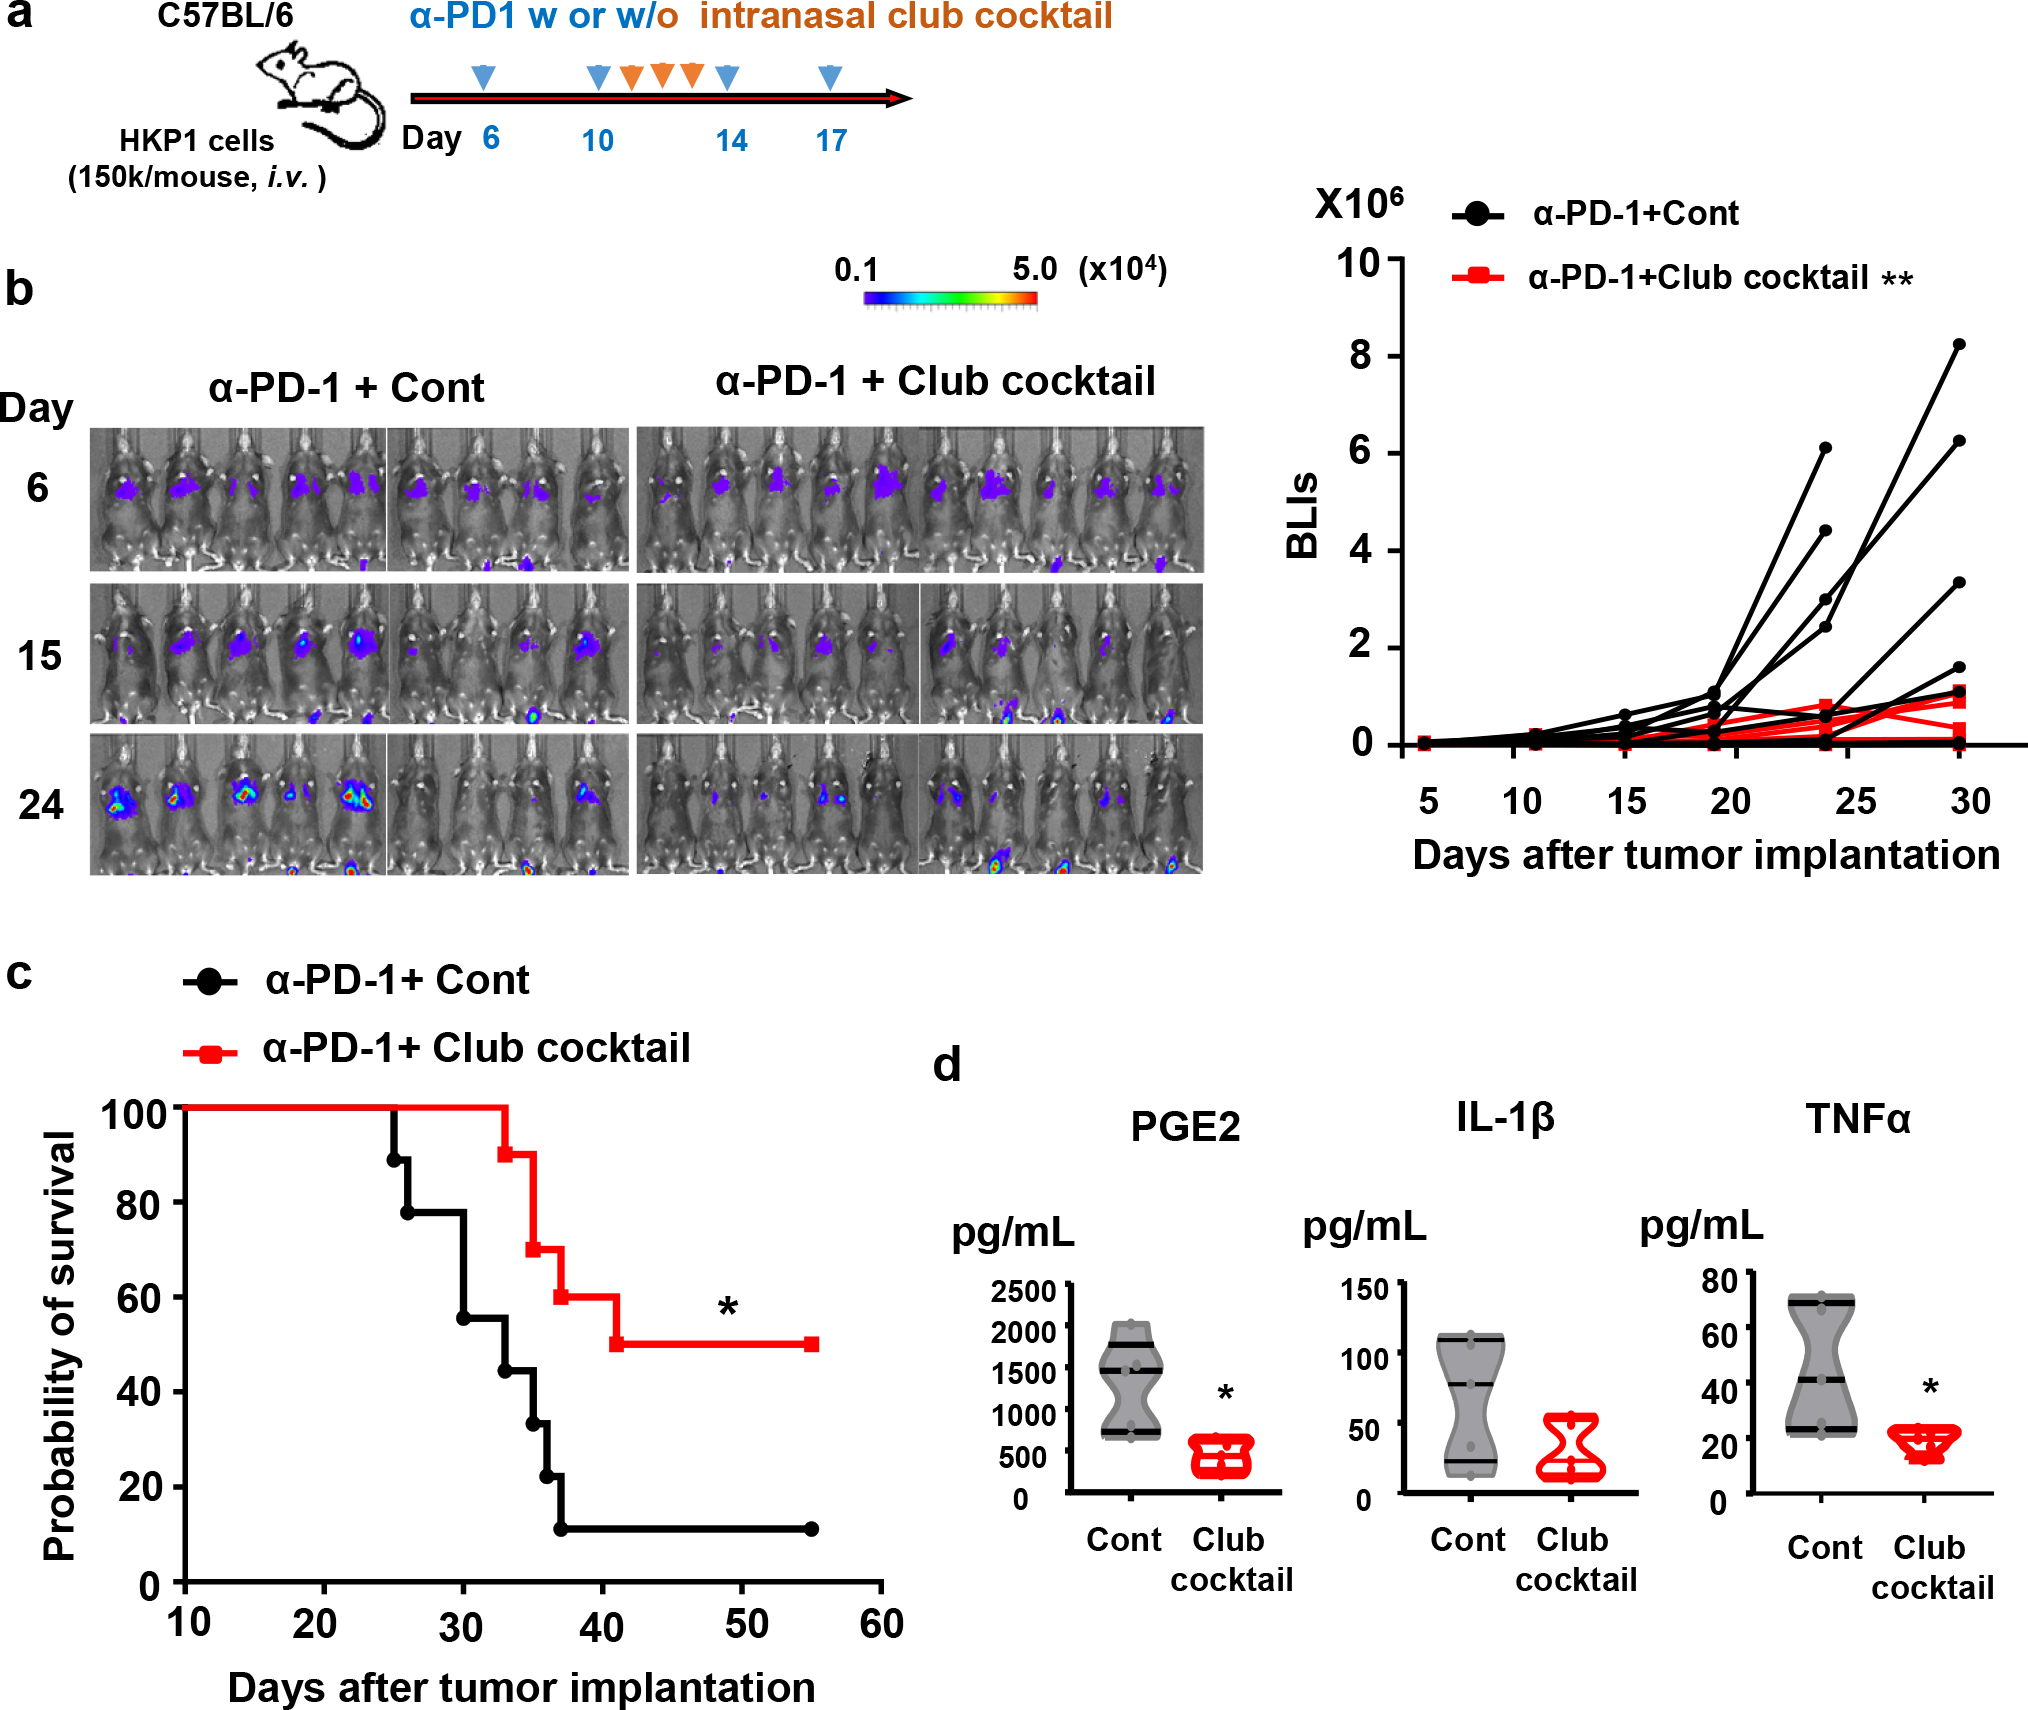
a. Schematic depicting treatment strategies. HKP1-bearing mice were treated with α-PD1 antibody (0.25mg/mouse, i.p.) at day 6, 10, 14, and 17. Mice also intranasally received a mock control or the club cocktail at day 11, 12 and 13, 20ng/protein/mouse.
b, Reduced tumor burden in mice receiving club cocktail. Left : Bioluminescent images (BLIs) of HKP1 mice treated with α-PD-1+Cont (n=9 mice) or α-PD-1+ Club Cocktail (n=10 mice). Right: tumor growth curves of HKP1 mice described in the left panel, **P = 0.0053, two-way ANOVA with Sidak’s post-hoc test. This experiment was repeated, and similar trends were observed.
c, Kaplan-Meier survival curves of HKP1 mice receiving α-PD-1 together with a mock control (n=9 mice) or the club cocktail (n=10 mice), *P = 0.0175, Two-tailed logrank test with Bonferroni method.
d. ELISA of inflammatory factors (IL-1β, PGE2, and TNFα) in the BALF. BALF were collected at Day 14 from mice intranasally treated with the mock control or club cocktail at day 11, 12, and 13, 20ng/protein/mouse. n=5 BALF samples from 5 mice, unpaired two-tailed Student’s t test. PGE2: *P=0.0118; IL-1β: P=0.1218; TNFα: *P=0.037.
Discussion
Our observations are consistent with the prevailing notion that RT in combination with ICI elicits anti-tumor responses57–59. Importantly, our study offers a mechanism by which radiation induced secretome of lung resident Scgb1a1+ club cells enhance the therapeutic efficacy of ICI in NSCLC. Growing evidence suggests that an immunosuppressive microenvironment associated with tumor-promoting inflammation constitutes a major barrier to the success of cancer immunotherapy60–62, and targeting inflammation to improve the efficacy of ICI has been proposed63,64. Consistent with the reported anti-inflammatory role of club cells in allergy, asthma, and COPD49,65, we show an intriguing role of RT-activated club secretory proteins that counteract multiple immunosuppressive mediators in NSCLC and enhance adaptive anti-tumor immunities.
Insights from our studies have marked potential for clinical translation. Currently, there is a lack of a standard to translate RT dose from animal models to human and vice versa, due to the species-specific radiation sensitivity, difference in target volumes, etc66,67. However, our study suggests that future human NSCLC clinical trials should consider optimizing RT dose that can effectively mediate activation of lung resident club cells. Currently, there is a lack of pharmacological or genetic approaches to activate club cells without compromising the integrity of lung epithelia. The demonstration that administration of the club cocktail enhanced the efficacy of ICI has immense potential in developing these factors as therapeutic modalities in NSCLC. Further development necessitates to determine the optimal composition of the secretory factors that elicit robust therapeutic benefit. Importantly, the finding that SBRT increased CC10 levels in NSCLC patients who responded to neoadjuvant SBRT+ICI treatment suggests that RT-induced club cell secreted factors in the plasma may have the potential to serve as non-invasive biomarkers of response/no response to SBRT/ICI treatment. In summary, insights from our studies have the potential to inform future clinical trials in maximizing the effectiveness of the radiation-immunotherapy combination to increase pathological response rates and improve survival in NSCLC.
Methods
Animals.
All animal related work was conducted following protocols and ethical guidelines approved by the Institutional Animal Care and Use Committee at Weill Cornell Medicine. Wild type C57BL/6 mice, Scgb1a1-CreER™ (CC10-Cre, Stock# 016225), ROSA26iDTR (Stock# 007900) were obtained from The Jackson Laboratory (Bar Harbor, Maine). The Snap23flox/flox mouse was a kind gift from Dr. Jeffrey E. Pessin at Albert Einstein College of Medicine, Bronx, New York, USA. Double transgenic mice were generated by breeding specific strains. Genotyping for each transgenic line was performed following the standardized protocols as described by the Jackson Laboratory. Genotyping for Snap23flox/flox mouse was performed as reported by Dr. Jeffrey E. Pessin42. Experimental cohorts were age- and sex-matched. Wild type controls (Scgb1acre/Snap23wt) for Scgb1acre/Snap23fl/fl were littermates from the same breeding cages with wild type genotype for Snap23 gene.
HKP1 and CMT-167 cancer models.
HKP1 lung cancer cells expressing mCherry-Luciferase were derived from spontaneous KrasLSL-G12D/+; p53flox/flox (KP) as described previously21, and orthotopic tumors in the lungs were generated via tail vein injection of 1.5 ×10⁵ HKP1 cells in 100 μL of sterile PBS into 8-week-old female C57BL6/J mice. CMT-167 (Sigma Cat# 10032302, 8×10⁵ cells/mouse) cells expressing mCherry-Luciferase were used to generate orthotopic lung tumors as described19. To generate flank tumor, 6×10⁵ HKP1 cells in serum-free DMEM media were injected subcutaneously to 8-week-old female C57BL6/J mice. The progression of tumors in the lungs was monitored by bioluminescent imaging (BLI) every 4–5 days. Briefly, mice were anesthetized with isoflurane and administered 75mg/kg D-luciferin (Promega) retro-orbitally. Images were taken on the Xenogen IVIS system coupled with analysis software (Living Image; Xenogen). For BLI plots, photon counts were calculated for each mouse by using the same circular region of interest encompassing the thorax of the mouse. The maximal tumour size is 2cm in diameter as permitted by ACUC committee at WCM, which was not exceeded.
Animal treatments.
On day 6 post-administration of HKP1 cells, BLI data were collected and mice were grouped such that each treatment cohort possessed similar mean tumor burdens. Cohorts of mice were treated with anti–PD-1 (clone RMP1–14, BioXCell, Supp. Table 3) or IgG2a control (clone 2A3, BioXCell, Supp. Table 3) (250 μg/mouse, i.p.) antibodies at days 6, 10, 13, and 17. For radiation therapy (RT), mice were anaesthetized for the duration of treatment. Before RT, CBCT using 60 kVp and 0.8 mA photons was performed on mouse to visualize the lung. Mice were irradiated using a 5×5 mm collimator with three beams. The setting for each beam were Couch at 90, 0, and 0 degree, Gantry at −26, 6 and −174 degree, respectively. The Small Animal Radiation Research Platform (SARRP) Dose Planning System (Xstrahl, USA) was used to precisely target the left lobe. RT with different doses (0, 0.5, 4, or 8 Gy) for 3 consecutive days from day 10 to 12. Molecular analyses following RT were performed at 24 to 48 hours after the last day of RT (described as Day1) or 7 days after the last Day of RT (described as Day7). For depletion of the club cells, mice were treated with naphthalene (200mg/kg in corn oil, i.p.) one day before receiving RT, or with 2 doses of diphtheria toxin (600ng/mouse, i.p.) at day 8 and 9. To induce Cre activity in the Scgb1a1Cre/RosaiDTR and Scgb1a1Cre/Snap23fl/fl mice, Tamoxifen (2 mg/20g in corn oil) was administrated via i.p. for 5 days as indicated. Club cocktail containing 8 club secretory proteins (20ng/protein) was prepared before treatment, and 25μl was administered intranasally per day for 3 days (Day 11–13). Tumor growth was monitored by BLI every 4–5 days. The HKP1 tumor-bearing lungs were collected at different time points as indicated for IF, flow cytometry, RNA-Seq, sc RNA-seq analyses.
Tissue processing, Immunofluorescence, and Microscopy.
Tissues were fixed in 4% paraformaldehyde overnight, followed by desiccation in 30% sucrose for 2 days. Serial sections (10–20 μm) were prepared from O.C.T. embedded blocks. Immunofluorescent staining was performed following standard protocols. Antibodies were listed in the following table. Fluorescent images were obtained using a Zeiss fluorescent microscope (Axiovert 200M) fitted with an apotome and an HRM camera.
Flow cytometry.
For T cell assays, tissues were grinded mechanically and stimulated with ionomycin and PMA as described previously22. For club cell assays, lungs were minced and digested in a collagenase IV (1 mg/mL), hyaluronidase (50 units/mL), and DNase I (0.1 mg/mL) in Hank’s Balanced Salt Solution containing calcium (HBSS, Gibco) at 37°C for 20–30 minutes on a rotator. Tissue digestion was terminated by adding cold DMEM/F12 media containing 10% FBS (1:10 dilution). Single cell suspension was prepared by passing through a 70 μm cell strainer, followed by a red blood cell lysis. Cells were then washed twice with FACS buffer and stained with various antibodies (Supp Table 3) against surface markers on ice for 45 minutes. For internal staining, cells were further fixed in fixation/permeabilization buffer (eBioscience) at 4°C for 30 mins, followed by 2 washes with permeabilization buffer (eBioscience) and incubation with internal antibody in permeabilization buffer for 30 min on ice. Stained cells were washed once with permeabilization buffer and suspended in PBS for analysis. Samples were analyzed via LSRII flow cytometer (BD Biosciences) and FlowJo 10 software (FlowJo, LLC).
Enzyme-linked immunosorbent assay (ELISA).
BALF samples from mice, patients’ sera and supernatants were collected and stored at −80 °C until analyses. Plasma samples were diluted with PBS (10x) prior to ELISA. ELISA was performed according to the manufacturer’s instructions. Briefly, the plates were coated with capture antibody at 4 °C overnight. The coated plate was then blocked with assay diluent for 1h at room temperature (RT), followed by sample incubation for 2 h, and detection antibody for 2 h. Avidin-HRP and TMB substrate were employed for the detection of the signal. The reaction was terminated with the Stop solution. The plates were read for absorbance at 450 nm with 570nm as the referring wavelength within 30 min. ELISA kits were purchased from various merchants as listed below: mouse CC10/CC16 (MyBiosource.inc), Human Uteroglobin DuoSet Elisa, mouse IL-1beta and mouse TNF-alpha (R&D system), mouse PGE2 (Enzo Life Sciences).
RNA-sequencing analysis.
Total RNA extracted from the bulk lung tissue from animals with the RNeasy plus Kit (Qiagen). RNA-Seq libraries were constructed and sequenced following protocols of TruSeq Stranded mRNA Library Preparation (Poly-A selection and Stranded RNA-Seq, Illumina) at the Genomics and Epigenetics Core Facility of WCM. RNA-seq data were analyzed with customized Partek Flow software (Partek Inc). In brief, the RNA-seq data were aligned to the mouse transcriptome reference (mm10) by STAR after pre-alignment QA/QC control. Quantification of gene expression was performed with the annotation model (PartekE/M), and normalized to counts per million (CPM). Differential gene expression was performed with Gene Specific Analysis (GSA) algorithm, which applied multiple statistical models to each individual gene to account for each gene’s varying response to different experimental factors and different data distribution. Multiple test correction based on FDR step-up was included in the algorithm. For heatmap visualizations, Z scores were calculated based on normalized per-gene counts. Gene Set Enrichment Assay (GSEA) was performed using software from http://www.broad.mit.edu/gsea with weighted enrichment statistic and Signal2Noise method (Metric for ranking genes). The specific gene sets of lung cells were obtained from LUNGENs (https://research.cchmc.org/pbge/lunggens/).
Single-cell RNA-sequencing (scRNA-seq) analysis.
Single-cell suspension was prepared following protocols from 10X Genomics. CD45− and CD45+ cells were sorted by flow cytometry and cells with >70% viability were submitted for sc-RNAseq. Single cell libraries were generated using 10X Genomics Chromium Single-cell 3’ Library RNA-Seq Assays protocols and ~6,000 cells from each fraction were sequenced on the NovaSeq sequencer (Illumina). The scRNA-seq data were analyzed with the custom Partek Flow software (Partek Inc), utilizing the Seurat R package68. The raw sequencing data were aligned to the mouse transcriptome reference (mm10) by STAR after Triming the tag sequences. The deduplication of UMIs, filtering of noise signals, and quantification of cell barcodes were performed to generate the single cell counts data of each sample. Single-cell QA/QC was then controlled by the total number of genes (≤ ~6,000), UMIs (≤ ~40,000), and the percentage of mitochondria genes (≤ 10%) according to each sample. The top 10–15 principal components (PC) were used for tSNE/UMAP visualization. The GSA and ANOVA analyses that were embedded in the Partek Flow software were used for differential gene analysis, and cluster features gene identification.
Data availability.
Bulk RNA–sequencing and single-cell RNA-sequencing data that support the findings of this study have been deposited in the Gene Expression Omnibus (GEO) under accession code GSE157883. Source data have been provided as Source Data files. All other data supporting the findings of this study are available from the corresponding author on reasonable request.
Club cell cocktail.
Expression constructs (pCMV6-entry vector) containing Sftpa1, Sftpb, Sftpd, Hp, Scgb1a1, Scgb3a1, Scgb3a2, Scgb1c1, and control empty vector were obtained from ORIGENE. HEK293T cells were transfected with the individual plasmids using calcium phosphate transfection method. 12hr post-transfection, HEK293T cells were gently washed with warm PBS, and then kept in serum-free, phenol red-free DMEM media with 2mM L-glutamine. Supernatants of transfected HEK293T cells were collected at 48hr and 72hr after transfection. The supernatants from 2 time points were combined and filtered through 0.45μM pore-sized membrane (VWR). To remove the non-target proteins with high molecular weights and non-target molecules with low molecular weights, the supernatants were further subject to centrifugation-filtration through cellulose membrane with molecular weight cut-off of 50KD and 3KD sequentially (Ultracel-50 and Ultrcel-3. Millipore Sigma). Western blots against Flag (the common tag of expressed secretory club proteins) were performed to evaluate the expression and concentration of each protein in the post-centrifugation supernatants (Extended data Fig. 10b). ELISA was performed to determine the concentration of CC10. The concentrations of the other proteins were calculated by comparing intensities of their western bands with CC10 band on the same western membrane (ImageJ). Supernatant collected from HEK293T cells transfected with an empty pCMV6-entry vector was also collected and subjected to same processes applied to supernatants containing club secretory proteins.
MDSC generation from bone marrow cells.
Bone marrow aspirates from C57B/6 mice were processed for RBC lysis and single cell suspension. 1.5×10⁶ cells were plated into 10 cm petri dishes with recombinant mouse GM-CSF (40ng/mL) and mouse IL-6 (40ng/mL) in DMEM with 10% FBS for 5 days (Extended data Fig. 10c)69. The generation of MDSCs was confirmed by flow cytometry analysis of CD11b and Gr1 markers. For downstream assays, MDSCs were re-plated at 1.5×10⁵/well, followed by treatments as indicated.
Western blot analysis.
For expressed club secretory proteins, 1μL of each concentrated supernatant was mixed with 10μL western lysis buffer. Antibodies used in the experiment are listed in Supp Table 3. For evaluating signaling transduction in MDSCs, 24hrs after treatments as indicated, MDSCs was washed with ice-old PBS and immediately lysed with western lysis buffer containing phosphatase-inhibitors (Pierce phosphatase inhibitor tablet, ThermoFisher Scientific). Western samples were boiled for 5min and loaded to 4–15% gradient SDS-PAGE gel. Standard Western blotting was subsequently performed.
RT-PCR analysis:
Total RNA was extracted using the RNeasy plus Kit (Qiagen) and converted to cDNA using qScriptTM_cDNA_SuperMix (Quanta Biosciences). PCR was performed with primers and iQTM SYBER Green master mix on a CFX96 System (Bio-Rad) by a standardized protocol.
Primers used for specific genes are listed in Supp Table 4.
Patient samples.
Patient samples from the neoadjuvant clinical trial (NCT02904954) of SBRT and ICI were obtained using Thoracic Surgery Biobank Protocol (#1008011221) under the Institutional Review Board approval at WMC. Patient identity remained anonymous in this study. Whole blood was drawn both before and 1 day after the last dose of RT. Plasma was collected via Ficoll gradient centrifugation and stored at −80°C until analysis.
Statistics and Reproducibility.
For experiments, no statistical method was used to predetermine sample size. The Investigators were not blinded to allocation during experiments and outcome assessment, or otherwise stated. The statistics analyses were performed by using the GraphPad Prism. P values of less than 0.05 were considered significant. In Fig. 6e, a fold change of 1.00736 was identified as an optimal separator of responders and non-responders with the minimized average adjustment being only 0.033039. The fold-change separator was calculated through an optimization scheme (modified support vector machine). The objective was to minimize the total lateral adjustment needed for the original fold changes to fall into their designated halves.
Further information on research design is available in the Nature Research Reporting Summary linked to this article.
Extended Data
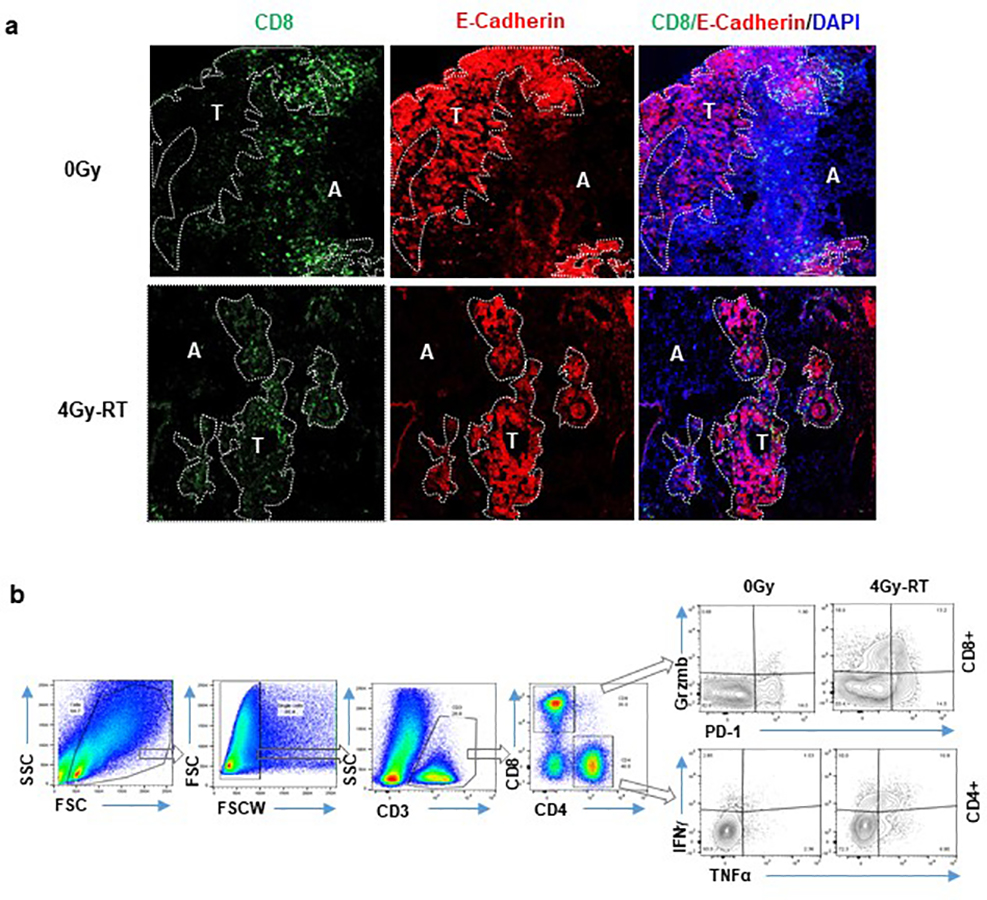
Extended Data Fig. 1. Representative tiled immunofluorescent images of HKP1 lungs.
1a, Stitched microscopy images (10x) showing impact of 4Gy-RT on the infiltration of CD8+ T cells in tumor islets 1 day after last dose of RT. Tiled images (1.6mm × 1.6mm) are shown. CD8 (Green) and E-cadherin (Red) were stained. Tumor (T) and Adjacent lung tissue (A) are separated by dashed lines. n=9 sections from 4 mice/treatment were evaluated. 1b. Example of gating strategy of flow cytometric analyses of T cells. Flow plots were sequentially gated as cells, single cells, CD3+ cells, CD4+ or CD8+; in CD4+ or CD8+ sub-gate, cytokine+ cells were gated based on unstained controls, followed by applying same gates to all the samples. This gating strategy was employed for Fig.2b–2f, Fig.4c (middle and right panels), Fig.5c (middle and right panels), Extended Data Fig.2e, Extended Data Fig.3c, Extended Data Fig.6d and Extended Data Fig.8d.
Extended Data Fig. 2. FTY720 abrogated immune-activating responses induced by 4Gy-RT.
a, Histogram plots (right) and quantitation (left) showing an increase in % CD3+ T cells in HKP1-bearing lungs in comparison to naïve lungs. Representative of n=3 individual mice b, Cytokine production (IFNγ and TNFα) by CD4+ T cells in TME at Day 7,13, and 21 after tumor implantation. Representative of n=3 lungs. c, Treatment and analysis scheme for HKP1 mice. d, Quantification of circulating T cells. Blood samples were obtained via submandibular bleeding, and lymph nodes collected from same mice served as controls. Cell counts/100,000 single flow events. Representative of n=3 mice. Unpaired two-tailed Student t test, ****P< 0.0001. e, Flow cytometric analyses of cytokine productions by T cells. Right, representative flow cytometric plots/histogram. Left, quantitation of % cytokine+ T cells in the HKP1 lungs. Representative of n=3 lungs. One-way ANOVA with Sidak multicomparison, ****P< 0.0001. f, Tumor growth curves of mouse cohorts treated with PBS or FTY720 as indicated. All the mice (n=5) in f were also received 4 Gy-RT and α-PD-1 antibody. Two-way ANOVA with Sidak’s post-hoc test. ****P< 0.0001.
Extended Data Fig. 3. Sustained effector phenotypes of T cells after combination treatment.
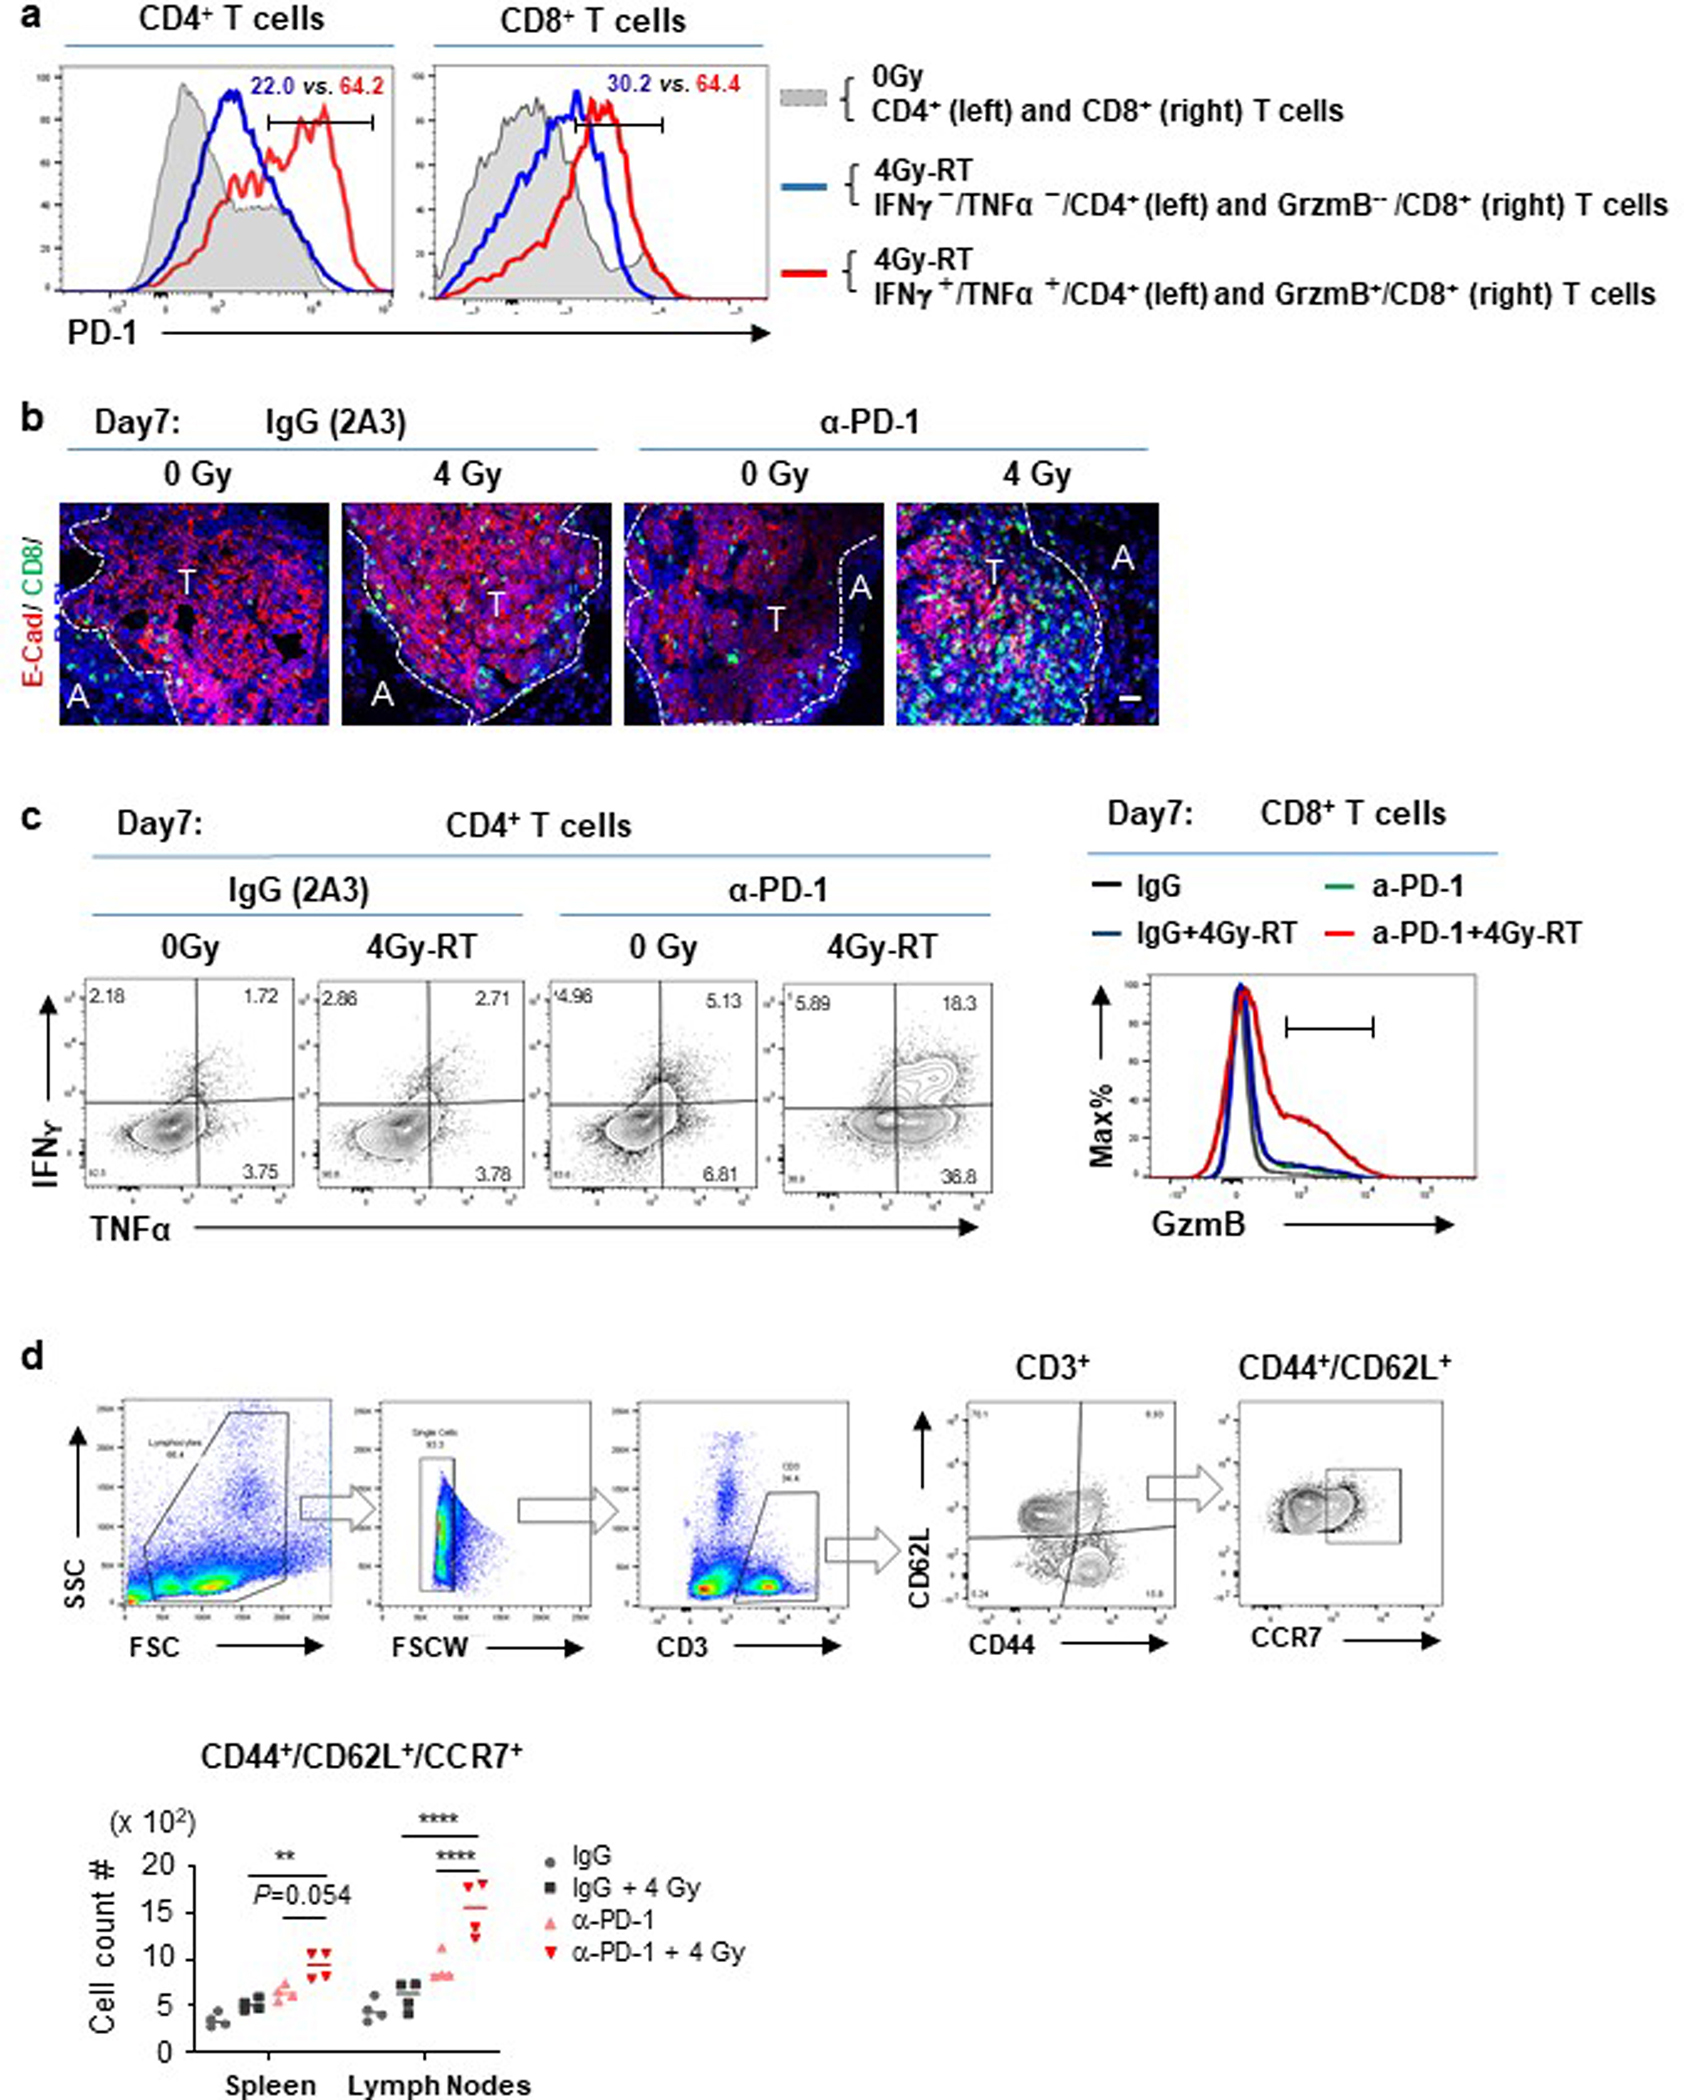
a, Histograms of PD-1 expression by cytokine+ vs. cytokine− T cells (left: CD4+ and right: CD8+) in HKP1-bearing lungs.
Representative of n=5 mice. b, Representative Immunofluorescent images of HKP1 lungs showing infiltration of CD8+ T cells into tumor islets at Day7 post-RT in combination with IgG or α-PD1 antibody. CD8 (Green) and Ecadherin (Red) were stained. Tumor (T) and Adjacent lung tissue (A) are separated by dashed lines. Scale bar: 20μM. n=9 sections from 3 mice/treatment.
c, Flow cytometry plots showing the production of IFNγ and TNFα by CD4+ T cells (left) and GzmB expression by CD8+ T cells (right) in HKP1 lungs in response to therapies at Day7 post-RT. Representative of n=5 mice. d, Flow cytometry analysis of central memory T cells in lymphoid tissues. Spleen and tumor-draining lymph nodes were collected from mice treated with mock, 4Gy-RT or 4Gy-RT in combination with α-PD1 antibody. Cells were stained with a-CD44, a-CD62L and a-CCR7 antibodies for central memory T cells. Upper:Flow events were gated sequentially as cells, single cells, CD3+, CD44+/CD62L+, and CCR7+. Lower: Data presented as cell counts/100,000 single flow events.
Represetative of n=4 mice. **P=0.0039, ****P<0.0001. Two-way ANOVA with Tukey’s post-hoc test.
Extended Data Fig. 4. 4Gy-RT elicited neither extensive tumor cell death nor increased cross-presenting DCs in bronchial lymph nodes.
a. Representative tiled immunofluorescent images of radiated HKP-1 lungs showing the impact of various doses of RT on tumor cell death. Cleaved caspase-3 (white) and E-cadherin+ tumor islets (red) were stained. Scale Bar: 100μM. Right panel: quantification of total fluorescence arear of cleaved caspase3. (n = 6 lung sections from 3 mice/treatment. Data are mean ± SEM. ns: non-significant, **** P ≤ 0.0001. One-way ANOVA with Sidak’s post-hoc test.
b. Representative flow-cytometric plots showing the impact of 4Gy-RT on CD103+ DCs in bronchial lymph nodes (BrLNs). BrLNs were collected, processed to single cell suspension, and stained with antibodies as indicated. Flow events were gated as cells, single cells, Epcam−/CD3−, CD8a+, and MHCII+. Flow contour plots were representative of 2 independent experiments. Data are pooled sample from 3 mice/treatment.
Extended Data Fig. 5. Differential gene expression in the HKP1 lungs receiving various doses of RT with or without α-PD1 antibody.
a. 144 genes specifically upregulated by 4Gy-RT. b. Volcano plots showing genes upregulated by 4Gy-RT when compared to 0Gy and 8Gy-RT in both the IgG (left) and α-PD1 antibody cohort (right) (P<0.01, Fold change≥2, LSMean≥5). c. RT-PCR analyses of club cell feature genes. Different cellular compartments, immune (CD45+), tumor (cherry+), club (EpcamhighCD24low) and other stromal (CD45−Epcam−) cells were sorted by flow cytometry. Expression of club cell feature genes (Scgb1a1, Scgb3a1, Cyp2f2, Hp and Scgb3a2) were analyzed by RT-PCR. CD45+ cells served as control and was set as 1. Data are mean ± SEM. n=4 mice.0Gy vs. 4Gy-RT (Relative expression in club cells): *P= 0.0102 (Scgb1a1); **P= 0.0036 (Scgb1c1); *P= 0.0328 (Cyp2f2); *P= 0.0492 (Hp); *P= 0.0156 (Scgb3a2).two-way ANOVA with Sidak’s post-hoc test.
Extended Data Fig. 6. 4Gy-RT activates club cells to mediate immune activation.
a, Flow cytometry analysis of club cells (CD45−/Epcamhi/CC10+) in naive lungs after different doses of RT. Flow events were gated sequentially as cells and single cells first as described in Extended data Fig.1b. Representative of n = 5 mice. b, Club cell counts/100,000 single cell events. n=5 mice, ****P< 0.0001, one-way ANOVA with Tukey’s post-hoc test. c, Representative histograms showing the increased proliferation rate (Ki67+) of club cells after 4Gy-RT.
Representative of n = 5 mice. d. Cytokine production by T cells in response to 4 Gy-RT relied on club cells. Representative flow cytometry plots showing the IFNγ+/TNFα+/CD4+ T cells and GzmB+/CD8+ T cells upon 4Gy-RT in HKP1-bearing lungs of mice that were pharmacologically (naphthalene) or genetically (DT) depleted of club cells. Representative of n = 4 mice. 0Gy- and vehicle-treated mice served as controls.
Extended Data Fig. 7. 4Gy-RT enhances efficacy of PD-1 inhibition by activating club cells.
a, Upper: schematic depicting treatment strategy. CMT-167bearing mice were treated with IgG or α-PD1 antibody (0.1 mg/mouse, i.p.) at day 11, 14, and 17. Mice also received mock RT or 4Gy-RT at day 11,12 and 13. Lower: tumor growth curves of CMT-167 mice described in upper panel. n=5 mice. IgG vs.4Gy-RT+ α-PD1: P=0.019; IgG vs.α-PD1: NS; IgG vs.4Gy-RT: NS. two-way ANOVA with Tukey’s post-hoc test. b, Upper: schematic depicting treatment strategy. CMT-167bearing mice were treated with naphthalene (200mg/kg, i.p.) at Day 10 to deplete club cells before radiation. From Day11, mice were treated as described in a. lower: tumor growth curves of CMT-167 mice described in upper panel. Vehicle (n=5 mice) vs. naphthalene (n=4 mice): **P=0.0031. Two way ANOVA with Holm-Sidak’s multiple comparisons test.
c. Upper: schematic depicting treatment strategy. Mice bearing HKP1 subcutaneous tumor were treated with IgG or αPD1 antibody (0.2 mg/mouse, i.p.) at day 14, 17, and 21. Mice also received mock RT or 4Gy-RT at day 14,15 and 16. Lower: tumor growth curves of HKP-1 mice described in upper panel. Data are mean ± SEM. n=5 mice. α-PD1 vs.4Gy-RT+ α-PD1: P=0.99, ns, non-significant. Two-way ANOVA with Tukey’s post-hoc test.
d, HKP1 subcutaneous tumor weights. HKP1 subcutaneous tumors were dissected at Day30. Data are mean ± SEM. IgG and 4Gy-RT: n=4; α-PD1 and 4Gy-RT+α-PD1: n=5 mice. α-PD1 vs.4Gy-RT+α-PD1: P=0.99(ns). One way ANOVA with Sidak’s multiple comparison test.
Extended Data Fig. 8. Analyses of radiationactivated club cells and the role of their secretion.
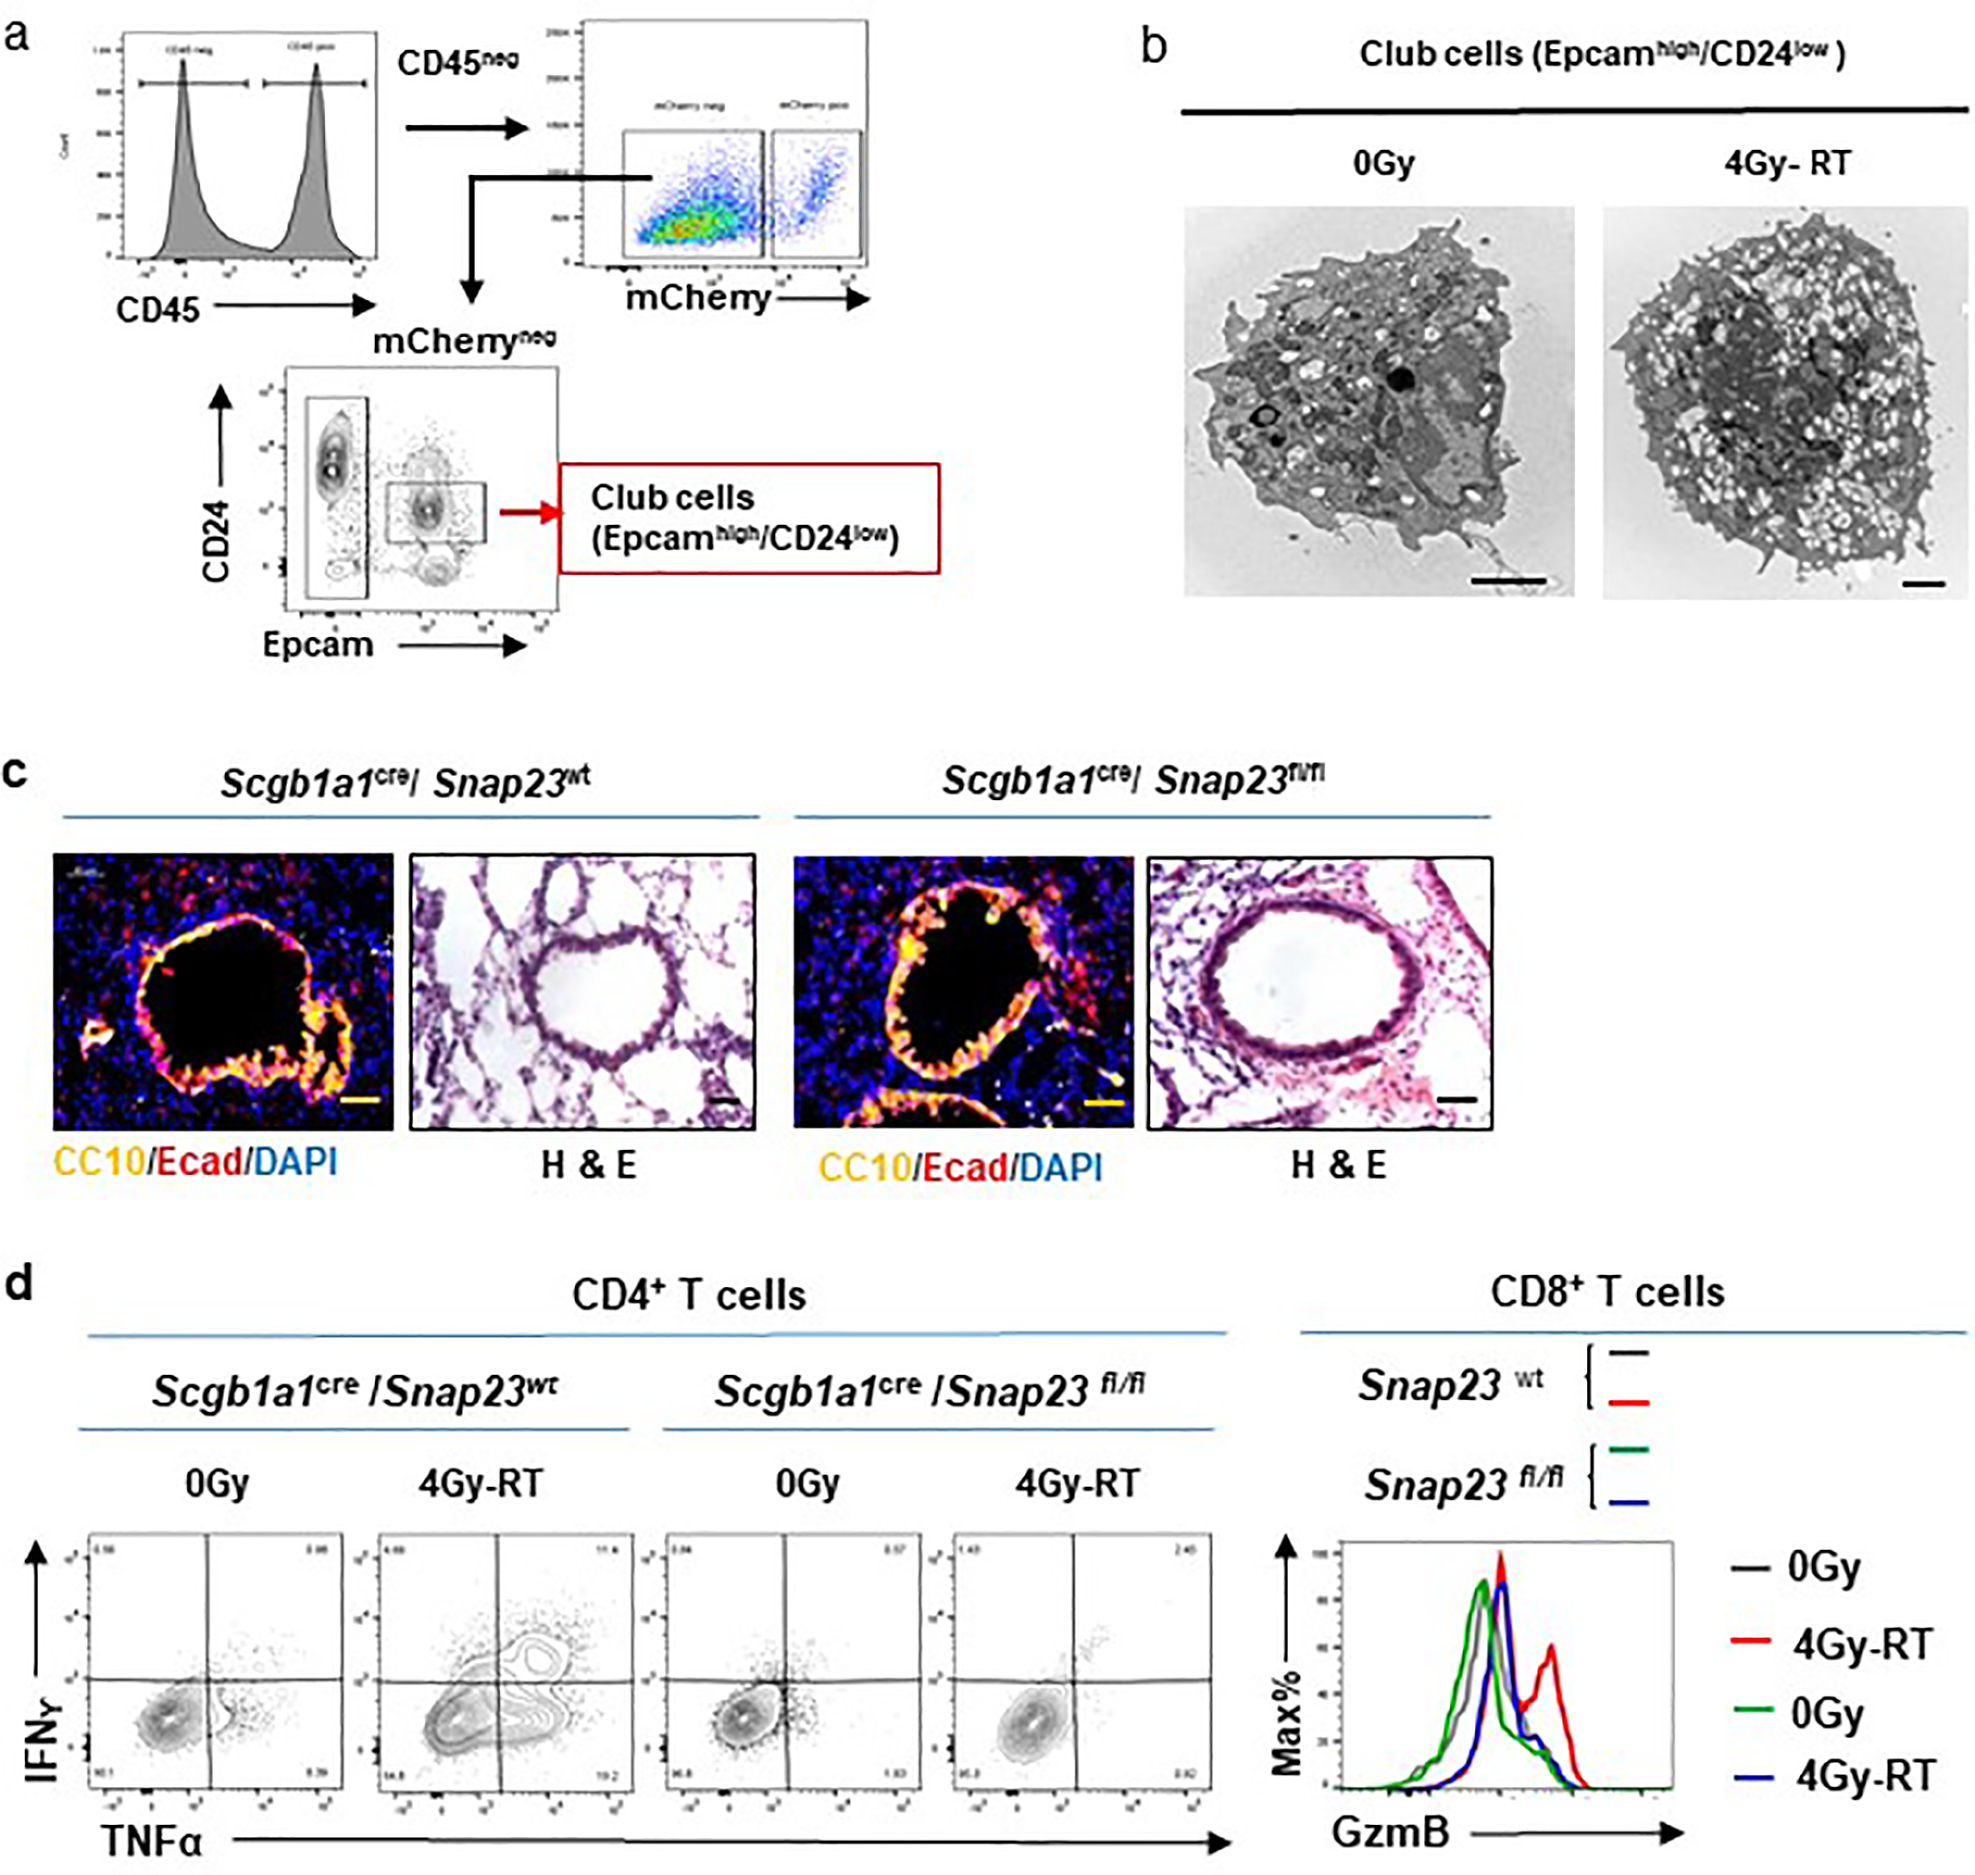
a, Flow cytometry sorting strategy of club cells. Single cell suspensions were prepared from HKP1-bearing lungs of animals treated with or without 4Gy-RT. Flow events were gated sequentially as cells and single cells as described in Extended data Fig. 1b. Club cells (Epcamhigh/CD24low) were sorted by flow cytometry.
b, Representative electron microscopy images of club cells, n= 29 cells. Significant increase of secreting vesicles were observed in 4Gy-RT treated-club cells when compared to 0Gy control. Scale bar, 2μM.
c, Lung sections stained for Ecadherin (red) and CC10 (yellow), or Haemotoxylin and Eosin (H&E). Representative images of n=10 sections from 3 mice/treatment.
d. Cytokine production by T cells in response to 4Gy-RT relies on the secretory function of club cells. Representative flow cytometry plots showing IFNγ+/TNFα+/CD4+ T cells and GzmB+/CD8+ T cells in 0Gy- or 4Gy-RT-treated HKP1 lungs of Snap23-wt and Snap23-fl/fl mice. Representative of n = 6 mice.
Extended Data Fig. 9. The t-SNE plots of scRNA-seq of HKP1-bearing lungs.
The mean expression values of the genes encoding inflammatory and immunosuppressive mediators are highlighted in various cell clusters. (data are pooled samples from 4 mice).
Extended Data Fig. 10. Expression of club secretory proteins and evaluation of their immunomodulatory functions.
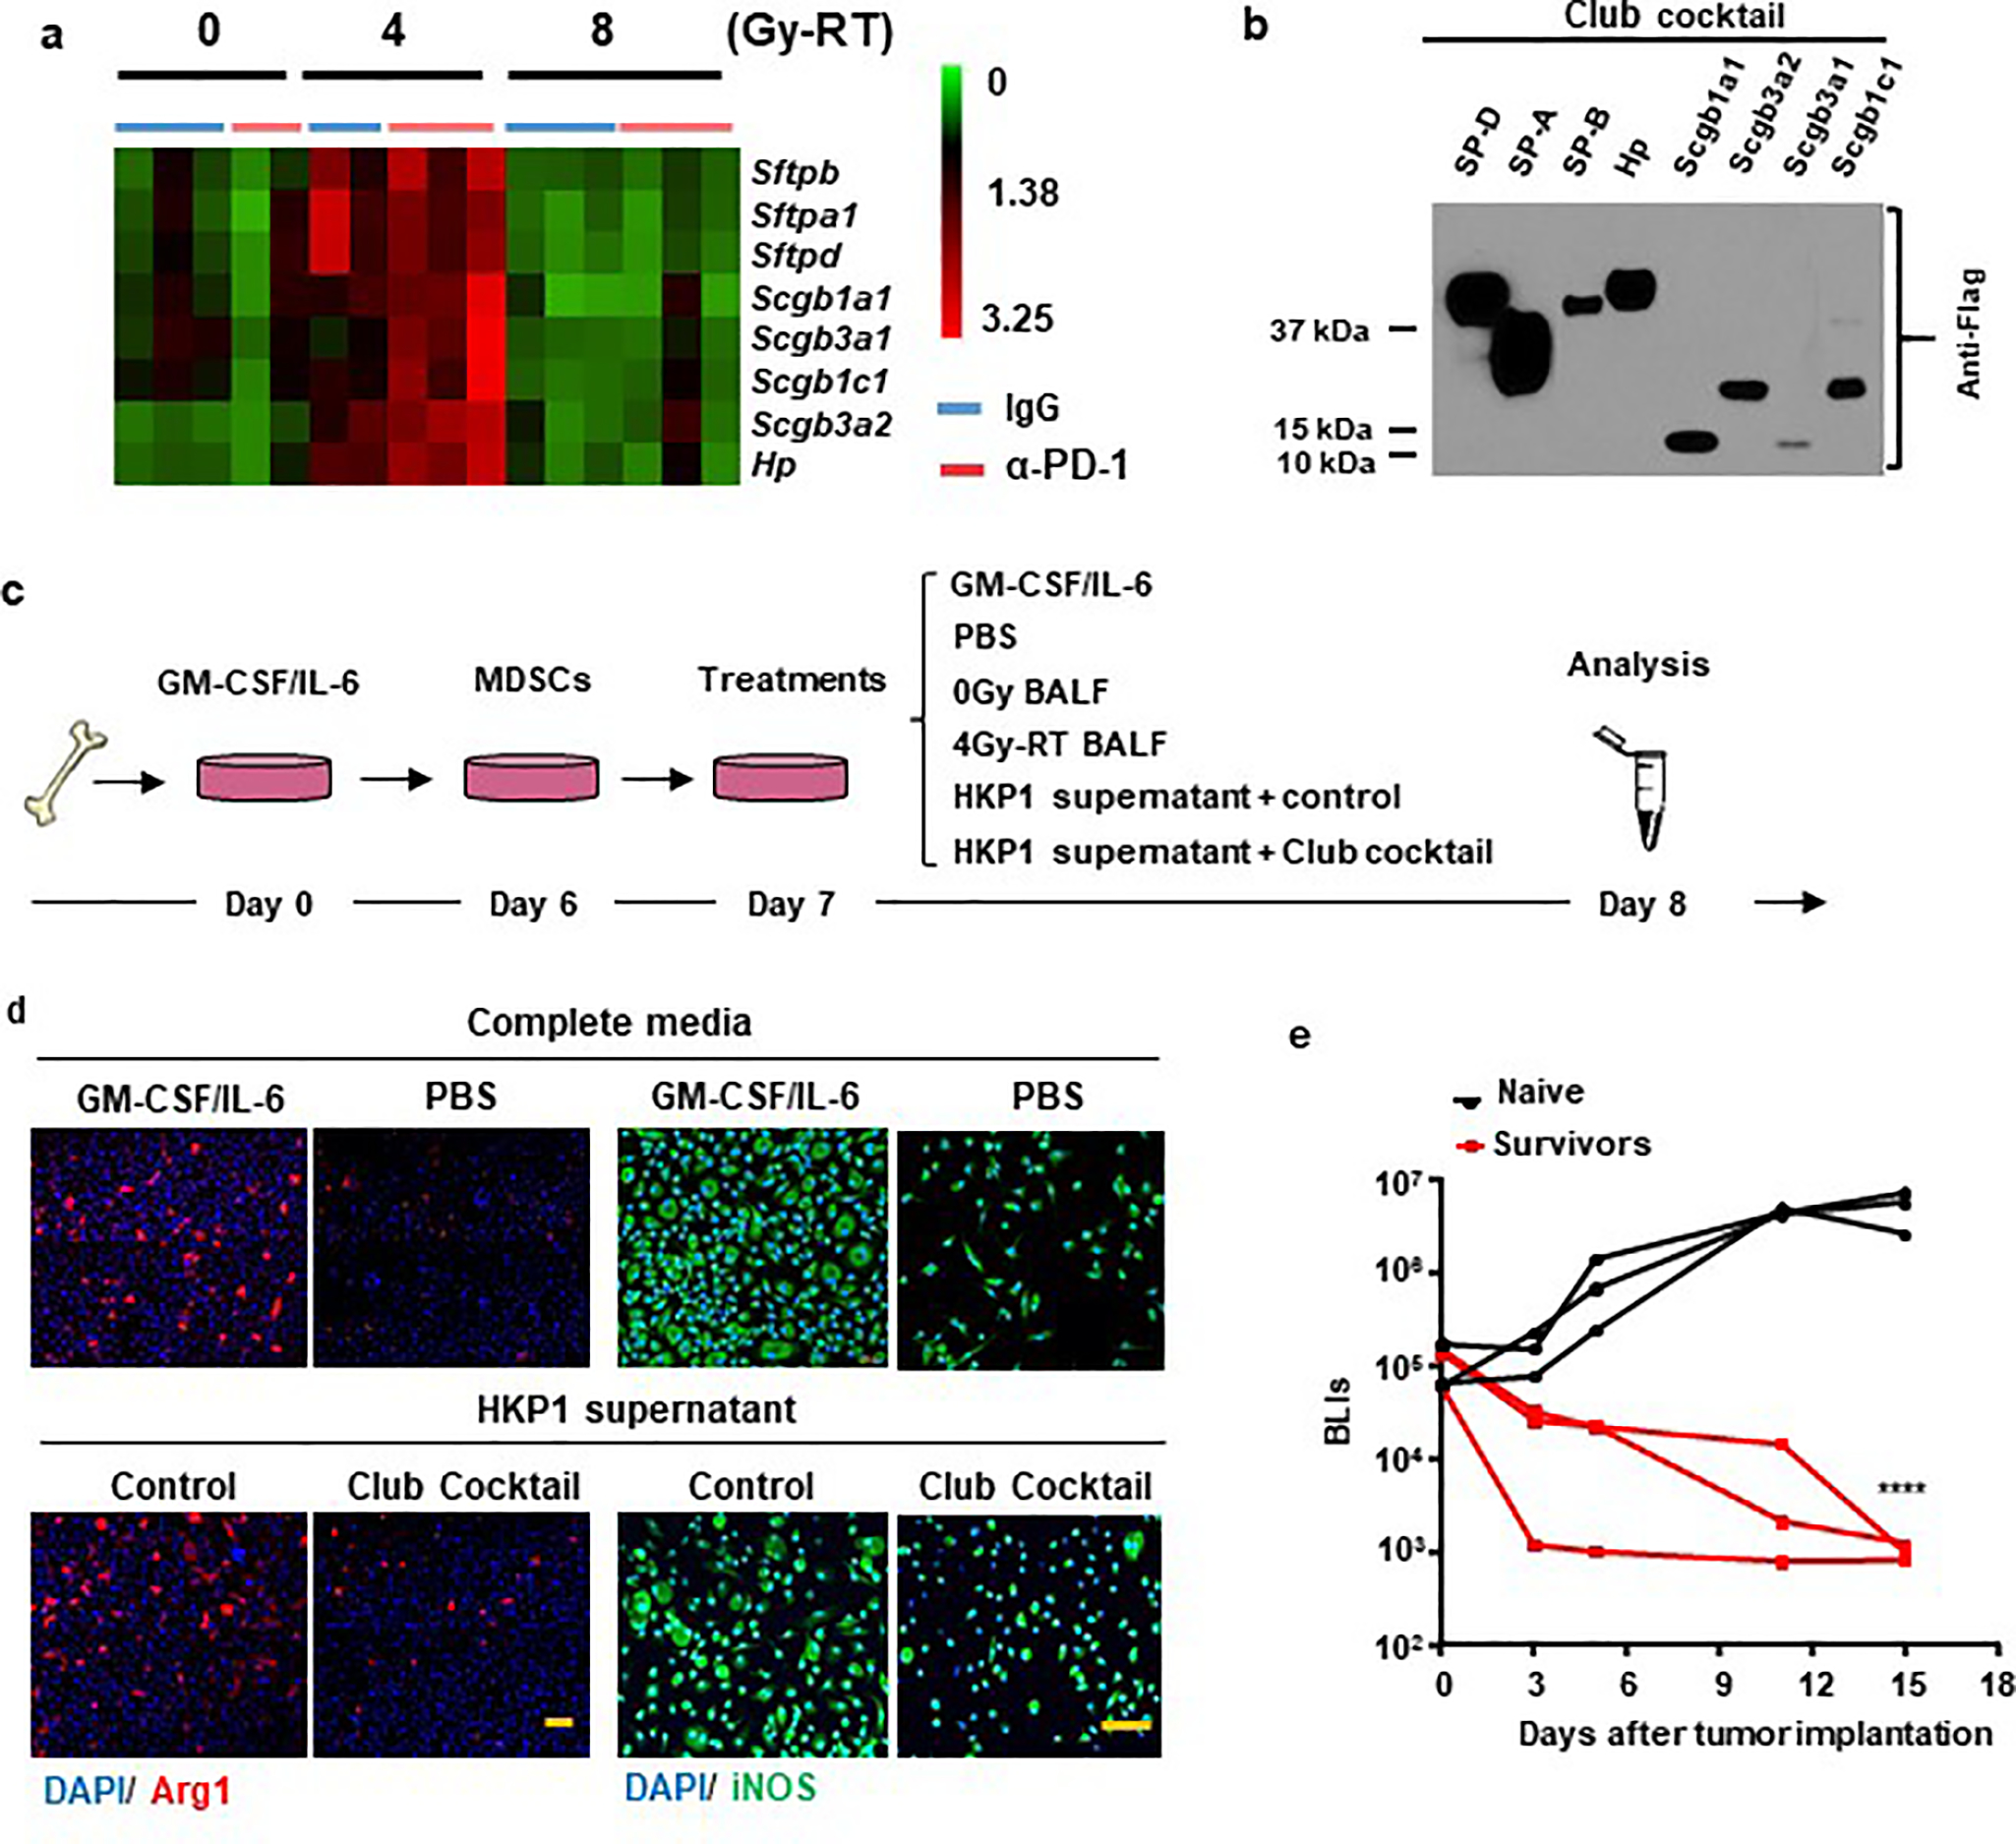
a. RNA-seq heatmap showing the top 8 candidate genes. RNAseq analyses of HKP1 lungs treated with RT or RT combined with α-PD1 antibody (each sample pooled from 3 mice, 5–6 samples/RT dose).Top genes upregulated specifically by 4Gy-RT (compared to 0Gy and 8Gy-RT) and encoding club secretory proteins were showed in the heatmap (two-sided adjusted P value <0.05, Fold change ≥ 2).
b. Western blot analyses of 8 secretory club proteins. HEK293T cells were transfected individually with pCMV6 plasmid containing cDNA of Sftpd, Sftpa1, Sftpb, Hp, Scgb1a1, Scgb3a1, Scgb3a2, and Scgb1c1. 2μL of concentrated supernatant were subject to immunoblotting against their common Flag tag. Representative of n = 3 independent experiment.
c. Schematic depicting MDSC culture and treatment strategies.
d. Suppression of secretory club proteins on expression of Arg1 and iNOS in MDSCs. Representative IF images of Arg1 (left) and iNOS (right) of MDSCs treated with GM-CSF/IL-6 (positive control), PBS (negative control) or HKP1 supernatant with mock or club cocktail. n=3 field of 2 independent experiments, Scale Bar: 50μM.
e. Tumor growth curves of mice which had survived HKP1 tumor upon the combination therapy of club cocktail and αPD1 antibody. Naïve mice served as controls. n=3 mice.
****P<0.0001. Two-way ANOVA Šídák’s multiple comparisons test.
Supplementary Material
Acknowledgments
We thank Dr. Jenny Xiang of the Genomics Resources Core Facility and Jason McCormick of the Flow Cytometry Core Facility for their professional advice. We thank the Formenti and Demaria labs for allowing us to use their small animal radiation core. We thank Cathy Spinelli, Joyce Gakuria, Abu Nasar, and Murtaza Malbari for clinical data support. We also thank Dr. Xiaodong Lin of Rutgers University for statistical consultation. This work was supported in part by National Cancer Institute (NCI) Grant NIH U01 CA188388 (V.M. and S.T.W.), 1UG3 CA244697 (V.M and N.K.A). Y.B. was supported by NIH R01 CA244413. G.J.M. was supported by postdoctoral fellowships of NCI T32 CA203702, NIH CTSC KL2-TR-002385, and PhRMA Foundation 2020 Postdoctoral fellowship in Translational Medicine. This work was also supported by funds from The Neuberger Berman Foundation Lung Cancer Research Center; a generous gift from Jay and Vicky Furman; and generous funds donated by patients in the Division of Thoracic Surgery to N.K.A. The funding organizations played no role in experimental design, data analysis, or manuscript preparation.
Footnotes
Competing financial interests: The authors declare no competing financial interests.
The authors declare no potential conflicts of interest
References
- 1.Herbst RS, Morgensztern D & Boshoff C The biology and management of non-small cell lung cancer. Nature 553, 446–454, doi: 10.1038/nature25183 (2018). [DOI] [PubMed] [Google Scholar]
- 2.Altorki NK et al. The lung microenvironment: an important regulator of tumour growth and metastasis. Nat Rev Cancer 19, 9–31, doi: 10.1038/s41568-018-0081-9 (2019). [DOI] [PMC free article] [PubMed] [Google Scholar]
- 3.Sharma P & Allison JP Immune checkpoint targeting in cancer therapy: toward combination strategies with curative potential. Cell 161, 205–214, doi: 10.1016/j.cell.2015.03.030 (2015). [DOI] [PMC free article] [PubMed] [Google Scholar]
- 4.Brahmer JR Immune checkpoint blockade: the hope for immunotherapy as a treatment of lung cancer? Semin Oncol 41, 126–132, doi: 10.1053/j.seminoncol.2013.12.014 (2014). [DOI] [PMC free article] [PubMed] [Google Scholar]
- 5.Sharma P, Hu-Lieskovan S, Wargo JA & Ribas A Primary, Adaptive, and Acquired Resistance to Cancer Immunotherapy. Cell 168, 707–723, doi: 10.1016/j.cell.2017.01.017 (2017). [DOI] [PMC free article] [PubMed] [Google Scholar]
- 6.Bernstein MB, Krishnan S, Hodge JW & Chang JY Immunotherapy and stereotactic ablative radiotherapy (ISABR): a curative approach? Nat Rev Clin Oncol 13, 516–524, doi: 10.1038/nrclinonc.2016.30 (2016). [DOI] [PMC free article] [PubMed] [Google Scholar]
- 7.Frey B et al. Induction of abscopal anti-tumor immunity and immunogenic tumor cell death by ionizing irradiation - implications for cancer therapies. Curr Med Chem 19, 1751–1764, doi: 10.2174/092986712800099811 (2012). [DOI] [PubMed] [Google Scholar]
- 8.Formenti SC & Demaria S Systemic effects of local radiotherapy. Lancet Oncol 10, 718–726, doi: 10.1016/S1470-2045(09)70082-8 (2009). [DOI] [PMC free article] [PubMed] [Google Scholar]
- 9.Demaria S et al. Ionizing radiation inhibition of distant untreated tumors (abscopal effect) is immune mediated. International Journal of Radiation Oncology*Biology*Physics 58, 862–870, doi: 10.1016/j.ijrobp.2003.09.012 (2004). [DOI] [PubMed] [Google Scholar]
- 10.Liang H et al. Radiation-induced equilibrium is a balance between tumor cell proliferation and T cell-mediated killing. Journal of immunology (Baltimore, Md. : 1950) 190, 5874–5881, doi: 10.4049/jimmunol.1202612 (2013). [DOI] [PMC free article] [PubMed] [Google Scholar]
- 11.Vanpouille-Box C et al. DNA exonuclease Trex1 regulates radiotherapy-induced tumour immunogenicity. Nat Commun 8, 15618, doi: 10.1038/ncomms15618 (2017). [DOI] [PMC free article] [PubMed] [Google Scholar]
- 12.Formenti SC & Demaria S Combining radiotherapy and cancer immunotherapy: a paradigm shift. J Natl Cancer Inst 105, 256–265, doi: 10.1093/jnci/djs629 (2013). [DOI] [PMC free article] [PubMed] [Google Scholar]
- 13.Sharabi AB, Lim M, DeWeese TL & Drake CG Radiation and checkpoint blockade immunotherapy: radiosensitisation and potential mechanisms of synergy. Lancet Oncol 16, e498–509, doi: 10.1016/S1470-2045(15)00007-8 (2015). [DOI] [PubMed] [Google Scholar]
- 14.Tang C et al. Combining radiation and immunotherapy: a new systemic therapy for solid tumors? Cancer Immunol Res 2, 831–838, doi: 10.1158/2326-6066.CIR-14-0069 (2014). [DOI] [PMC free article] [PubMed] [Google Scholar]
- 15.Gong J, Le TQ, Massarelli E, Hendifar AE & Tuli R Radiation therapy and PD-1/PD-L1 blockade: the clinical development of an evolving anticancer combination. J Immunother Cancer 6, 46, doi: 10.1186/s40425-018-0361-7 (2018). [DOI] [PMC free article] [PubMed] [Google Scholar]
- 16.Deng L et al. Irradiation and anti-PD-L1 treatment synergistically promote antitumor immunity in mice. J Clin Invest 124, 687–695, doi: 10.1172/JCI67313 (2014). [DOI] [PMC free article] [PubMed] [Google Scholar]
- 17.Weichselbaum RR, Liang H, Deng L & Fu YX Radiotherapy and immunotherapy: a beneficial liaison? Nat Rev Clin Oncol 14, 365–379, doi: 10.1038/nrclinonc.2016.211 (2017). [DOI] [PubMed] [Google Scholar]
- 18.Takamori S et al. Combination Therapy of Radiotherapy and Anti-PD-1/PD-L1 Treatment in Non-Small-cell Lung Cancer: A Mini-review. Clin Lung Cancer 19, 12–16, doi: 10.1016/j.cllc.2017.06.015 (2018). [DOI] [PubMed] [Google Scholar]
- 19.Herter-Sprie GS et al. Synergy of radiotherapy and PD-1 blockade in Kras-mutant lung cancer. JCI Insight 1, e87415, doi: 10.1172/jci.insight.87415 (2016). [DOI] [PMC free article] [PubMed] [Google Scholar]
- 20.Garon EB et al. Pembrolizumab for the treatment of non-small-cell lung cancer. N Engl J Med 372, 2018–2028, doi: 10.1056/NEJMoa1501824 (2015). [DOI] [PubMed] [Google Scholar]
- 21.Choi H et al. Transcriptome analysis of individual stromal cell populations identifies stroma-tumor crosstalk in mouse lung cancer model. Cell Rep 10, 1187–1201, doi: 10.1016/j.celrep.2015.01.040 (2015). [DOI] [PubMed] [Google Scholar]
- 22.Markowitz GJ et al. Immune reprogramming via PD-1 inhibition enhances early-stage lung cancer survival. JCI Insight 3, doi: 10.1172/jci.insight.96836 (2018). [DOI] [PMC free article] [PubMed] [Google Scholar]
- 23.Ko EC, Raben D & Formenti SC The Integration of Radiotherapy with Immunotherapy for the Treatment of Non-Small Cell Lung Cancer. Clin Cancer Res 24, 5792–5806, doi: 10.1158/1078-0432.CCR-17-3620 (2018). [DOI] [PubMed] [Google Scholar]
- 24.Dewan MZ et al. Fractionated but not single-dose radiotherapy induces an immune-mediated abscopal effect when combined with anti-CTLA-4 antibody. Clin Cancer Res 15, 5379–5388, doi: 10.1158/1078-0432.CCR-09-0265 (2009). [DOI] [PMC free article] [PubMed] [Google Scholar]
- 25.Hellevik T & Martinez-Zubiaurre I Radiotherapy and the tumor stroma: the importance of dose and fractionation. Front Oncol 4, 1, doi: 10.3389/fonc.2014.00001 (2014). [DOI] [PMC free article] [PubMed] [Google Scholar]
- 26.Garris CS, Blaho VA, Hla T & Han MH Sphingosine-1-phosphate receptor 1 signalling in T cells: trafficking and beyond. Immunology 142, 347–353, doi: 10.1111/imm.12272 (2014). [DOI] [PMC free article] [PubMed] [Google Scholar]
- 27.Klebanoff CA et al. Central memory self/tumor-reactive CD8+ T cells confer superior antitumor immunity compared with effector memory T cells. Proceedings of the National Academy of Sciences of the United States of America 102, 9571–9576, doi: 10.1073/pnas.0503726102 (2005). [DOI] [PMC free article] [PubMed] [Google Scholar]
- 28.Sharabi AB et al. Stereotactic Radiation Therapy Augments Antigen-Specific PD-1-Mediated Antitumor Immune Responses via Cross-Presentation of Tumor Antigen. Cancer Immunol Res 3, 345–355, doi: 10.1158/2326-6066.CIR-14-0196 (2015). [DOI] [PMC free article] [PubMed] [Google Scholar]
- 29.Gupta A et al. Radiotherapy promotes tumor-specific effector CD8+ T cells via dendritic cell activation. J Immunol 189, 558–566, doi: 10.4049/jimmunol.1200563 (2012). [DOI] [PubMed] [Google Scholar]
- 30.Du Y, Guo M, Whitsett JA & Xu Y ‘LungGENS’: a web-based tool for mapping single-cell gene expression in the developing lung. Thorax 70, 1092–1094, doi: 10.1136/thoraxjnl-2015-207035 (2015). [DOI] [PMC free article] [PubMed] [Google Scholar]
- 31.Du Y et al. Lung Gene Expression Analysis (LGEA): an integrative web portal for comprehensive gene expression data analysis in lung development. Thorax 72, 481–484, doi: 10.1136/thoraxjnl-2016-209598 (2017). [DOI] [PMC free article] [PubMed] [Google Scholar]
- 32.Treutlein B et al. Reconstructing lineage hierarchies of the distal lung epithelium using single-cell RNA-seq. Nature 509, 371–375, doi: 10.1038/nature13173 (2014). [DOI] [PMC free article] [PubMed] [Google Scholar]
- 33.Chen H et al. Airway epithelial progenitors are region specific and show differential responses to bleomycin-induced lung injury. Stem cells (Dayton, Ohio) 30, 1948–1960, doi: 10.1002/stem.1150 (2012). [DOI] [PMC free article] [PubMed] [Google Scholar]
- 34.Stripp BR & Reynolds SD Maintenance and repair of the bronchiolar epithelium. Proc Am Thorac Soc 5, 328–333, doi: 10.1513/pats.200711-167DR (2008). [DOI] [PMC free article] [PubMed] [Google Scholar]
- 35.Reynolds SD & Malkinson AM Clara cell: progenitor for the bronchiolar epithelium. Int J Biochem Cell Biol 42, 1–4, doi: 10.1016/j.biocel.2009.09.002 (2010). [DOI] [PMC free article] [PubMed] [Google Scholar]
- 36.McQualter JL Endogenous lung stem cells for lung regeneration. Expert Opin Biol Ther 19, 539–546, doi: 10.1080/14712598.2019.1596256 (2019). [DOI] [PubMed] [Google Scholar]
- 37.Rawlins EL et al. The role of Scgb1a1+ Clara cells in the long-term maintenance and repair of lung airway, but not alveolar, epithelium. Cell Stem Cell 4, 525–534, doi: 10.1016/j.stem.2009.04.002 (2009). [DOI] [PMC free article] [PubMed] [Google Scholar]
- 38.Yokoyama T et al. Depletion of club cells attenuates bleomycin-induced lung injury and fibrosis in mice. J Inflamm (Lond) 14, 20, doi: 10.1186/s12950-017-0168-1 (2017). [DOI] [PMC free article] [PubMed] [Google Scholar]
- 39.Stripp BR, Maxson K, Mera R & Singh G Plasticity of airway cell proliferation and gene expression after acute naphthalene injury. American Journal of Physiology-Lung Cellular and Molecular Physiology 269, L791–L799, doi: 10.1152/ajplung.1995.269.6.L791 (1995). [DOI] [PubMed] [Google Scholar]
- 40.Li HY et al. The Tumor Microenvironment Regulates Sensitivity of Murine Lung Tumors to PD-1/PD-L1 Antibody Blockade. Cancer Immunol Res, doi: 10.1158/2326-6066.CIR-16-0365 (2017). [DOI] [PMC free article] [PubMed] [Google Scholar]
- 41.DuPage M, Dooley AL & Jacks T Conditional mouse lung cancer models using adenoviral or lentiviral delivery of Cre recombinase. Nat Protoc 4, 1064–1072, doi:nprot.2009.95 [pii] 10.1038/nprot.2009.95 (2009). [DOI] [PMC free article] [PubMed] [Google Scholar]
- 42.Feng D et al. SNAP23 regulates BAX-dependent adipocyte programmed cell death independently of canonical macroautophagy. J Clin Invest 128, 3941–3956, doi: 10.1172/JCI99217 (2018). [DOI] [PMC free article] [PubMed] [Google Scholar]
- 43.Spella M et al. Club cells form lung adenocarcinomas and maintain the alveoli of adult mice. Elife 8, doi: 10.7554/eLife.45571 (2019). [DOI] [PMC free article] [PubMed] [Google Scholar]
- 44.Nagaraj AS et al. Cell of Origin Links Histotype Spectrum to Immune Microenvironment Diversity in Non-small-Cell Lung Cancer Driven by Mutant Kras and Loss of Lkb1. Cell Rep 18, 673–684, doi: 10.1016/j.celrep.2016.12.059 (2017). [DOI] [PubMed] [Google Scholar]
- 45.Gardai SJ et al. By binding SIRPalpha or calreticulin/CD91, lung collectins act as dual function surveillance molecules to suppress or enhance inflammation. Cell 115, 13–23, doi: 10.1016/s0092-8674(03)00758-x (2003). [DOI] [PubMed] [Google Scholar]
- 46.Johnston CJ, Mango GW, Finkelstein JN & Stripp BR Altered pulmonary response to hyperoxia in Clara cell secretory protein deficient mice. Am J Respir Cell Mol Biol 17, 147–155, doi: 10.1165/ajrcmb.17.2.2676 (1997). [DOI] [PubMed] [Google Scholar]
- 47.Miele L, Cordella-Miele E, Facchiano A & Mukherjee AB Novel anti-inflammatory peptides from the region of highest similarity between uteroglobin and lipocortin I. Nature 335, 726–730, doi: 10.1038/335726a0 (1988). [DOI] [PubMed] [Google Scholar]
- 48.Yoneda M et al. Secretoglobin Superfamily Protein SCGB3A2 Alleviates House Dust Mite-Induced Allergic Airway Inflammation in Mice. Int Arch Allergy Immunol 171, 36–44, doi: 10.1159/000450788 (2016). [DOI] [PMC free article] [PubMed] [Google Scholar]
- 49.Roth FD et al. Restoration of the normal Clara cell phenotype after chronic allergic inflammation. Int J Exp Pathol 94, 399–411, doi: 10.1111/iep.12041 (2013). [DOI] [PMC free article] [PubMed] [Google Scholar]
- 50.Long XB et al. Clara cell 10-kDa protein gene transfection inhibits NF-κB activity in airway epithelial cells. PLoS One 7, e35960, doi: 10.1371/journal.pone.0035960 (2012). [DOI] [PMC free article] [PubMed] [Google Scholar]
- 51.Zhao X et al. TNF signaling drives myeloid-derived suppressor cell accumulation. J Clin Invest 122, 4094–4104, doi: 10.1172/JCI64115 (2012). [DOI] [PMC free article] [PubMed] [Google Scholar]
- 52.Kaplanov I et al. Blocking IL-1beta reverses the immunosuppression in mouse breast cancer and synergizes with anti-PD-1 for tumor abrogation. Proc Natl Acad Sci U S A 116, 1361–1369, doi: 10.1073/pnas.1812266115 (2019). [DOI] [PMC free article] [PubMed] [Google Scholar]
- 53.Wang D & DuBois RN An inflammatory mediator, prostaglandin E2, in colorectal cancer. Cancer J 19, 502–510, doi: 10.1097/PPO.0000000000000003 (2013). [DOI] [PMC free article] [PubMed] [Google Scholar]
- 54.Altorki NK et al. Neoadjuvant durvalumab with or without stereotactic body radiotherapy in patients with early-stage non-small-cell lung cancer: a single-centre, randomised phase 2 trial. Lancet Oncol, doi: 10.1016/S1470-2045(21)00149-2 (2021). [DOI] [PubMed] [Google Scholar]
- 55.Gabrilovich DI & Nagaraj S Myeloid-derived suppressor cells as regulators of the immune system. Nat Rev Immunol 9, 162–174, doi: 10.1038/nri2506 (2009). [DOI] [PMC free article] [PubMed] [Google Scholar]
- 56.Trikha P & Carson WE 3rd. Signaling pathways involved in MDSC regulation. Biochim Biophys Acta 1846, 55–65, doi: 10.1016/j.bbcan.2014.04.003 (2014). [DOI] [PMC free article] [PubMed] [Google Scholar]
- 57.Wei S, Egenti MU, Teitz-Tennenbaum S, Zou W & Chang AE Effects of tumor irradiation on host T-regulatory cells and systemic immunity in the context of adoptive T-cell therapy in mice. J Immunother 36, 124–132, doi: 10.1097/CJI.0b013e31828298e6 (2013). [DOI] [PMC free article] [PubMed] [Google Scholar]
- 58.Dovedi SJ et al. Acquired resistance to fractionated radiotherapy can be overcome by concurrent PD-L1 blockade. Cancer Res 74, 5458–5468, doi: 10.1158/0008-5472.CAN-14-1258 (2014). [DOI] [PubMed] [Google Scholar]
- 59.Wang X et al. Suppression of Type I IFN Signaling in Tumors Mediates Resistance to Anti-PD-1 Treatment That Can Be Overcome by Radiotherapy. Cancer Res 77, 839–850, doi: 10.1158/0008-5472.CAN-15-3142 (2017). [DOI] [PMC free article] [PubMed] [Google Scholar]
- 60.Gomes M, Teixeira AL, Coelho A, Araujo A & Medeiros R The role of inflammation in lung cancer. Adv Exp Med Biol 816, 1–23, doi: 10.1007/978-3-0348-0837-8_1 (2014). [DOI] [PubMed] [Google Scholar]
Additional references:
- 61.Greten FR & Grivennikov SI Inflammation and Cancer: Triggers, Mechanisms, and Consequences. Immunity 51, 27–41, doi: 10.1016/j.immuni.2019.06.025 (2019). [DOI] [PMC free article] [PubMed] [Google Scholar]
- 62.Shalapour S & Karin M Pas de Deux: Control of Anti-tumor Immunity by Cancer-Associated Inflammation. Immunity 51, 15–26, doi: 10.1016/j.immuni.2019.06.021 (2019). [DOI] [PMC free article] [PubMed] [Google Scholar]
- 63.Macciò A & Madeddu C Blocking inflammation to improve immunotherapy of advanced cancer. Immunology 159, 357–364, doi: 10.1111/imm.13164 (2020). [DOI] [PMC free article] [PubMed] [Google Scholar]
- 64.Nakamura K & Smyth MJ Targeting cancer-related inflammation in the era of immunotherapy. Immunol Cell Biol 95, 325–332, doi: 10.1038/icb.2016.126 (2017). [DOI] [PubMed] [Google Scholar]
- 65.Sagiv A et al. p53 in Bronchial Club Cells Facilitates Chronic Lung Inflammation by Promoting Senescence. Cell Rep 22, 3468–3479, doi: 10.1016/j.celrep.2018.03.009 (2018). [DOI] [PubMed] [Google Scholar]
- 66.Diatloff-Zito C, Deschavanne PJ, Loria E, Malaise EP & Macieira-Coelho A Comparison between the radiosensitivity of human, mouse and chicken fibroblast-like cells using short-term endpoints. Int J Radiat Biol Relat Stud Phys Chem Med 39, 419–430, doi: 10.1080/09553008114550511 (1981). [DOI] [PubMed] [Google Scholar]
- 67.Ghandhi SA, Smilenov L, Shuryak I, Pujol-Canadell M & Amundson SA Discordant gene responses to radiation in humans and mice and the role of hematopoietically humanized mice in the search for radiation biomarkers. Scientific Reports 9, 19434, doi: 10.1038/s41598-019-55982-2 (2019). [DOI] [PMC free article] [PubMed] [Google Scholar]
- 68.Butler A, Hoffman P, Smibert P, Papalexi E & Satija R Integrating single-cell transcriptomic data across different conditions, technologies, and species. Nature biotechnology 36, 411–420, doi: 10.1038/nbt.4096 (2018). [DOI] [PMC free article] [PubMed] [Google Scholar]
- 69.Parker KH et al. HMGB1 enhances immune suppression by facilitating the differentiation and suppressive activity of myeloid-derived suppressor cells. Cancer Res 74, 5723–5733, doi: 10.1158/0008-5472.CAN-13-2347 (2014). [DOI] [PMC free article] [PubMed] [Google Scholar]
Associated Data
This section collects any data citations, data availability statements, or supplementary materials included in this article.
Supplementary Materials
Data Availability Statement
Bulk RNA–sequencing and single-cell RNA-sequencing data that support the findings of this study have been deposited in the Gene Expression Omnibus (GEO) under accession code GSE157883. Source data have been provided as Source Data files. All other data supporting the findings of this study are available from the corresponding author on reasonable request.


