Abstract
Introduction: Diabetes mellitus causes a major burden on healthcare systems all around the world. It has been documented that type 2 diabetes mellitus (T2DM) is associated with long-term vascular complications including micro-vascular, macro-vascular, and mixed-vascular disorders. Several studies have concluded that the increment of arterial wall stiffness is correlated with an increase in the risk of cardiovascular adverse events and the mortality associated with it.
Aims: This study purposed to evaluate the arterial stiffness measurements, using Cardio-Ankle Vascular Index (CAVI), in T2DM patients, and the relationship with the fasting blood glucose (FBG), hemoglobin A1c (HbA1c), and other factors that may increase the risk of elevated arterial stiffness in T2DM patients.
Methodology: A total of 200 patients were recruited from the outpatient setting at King Fahd Hospital of the University, Al Khobar. A total of 181 patients fit the inclusion criteria. The charts of the patients who fit the inclusion criteria were reviewed and data related to age, gender, body mass index, smoking history, FBG, HbA1c levels, blood pressure (mmHg) measurements, and CAVI scores were collected.
Results: The elevation in CAVI readings was noted to be more prominent in the senior age group. Hypertensive patients also showed a significant increase in CAVI readings. In addition, higher CAVI readings were more associated with the male gender rather than females. All of which showed a significant correlation. Furthermore, although it was not significant, higher FBG levels and HbA1c readings were correlated with higher CAVI readings.
Conclusion: The results of the study suggest that factors like age, smoking status, gender, and the increase in blood pressure as well as the increase in blood glucose levels are correlated with higher CAVI readings in T2DM patients. This demonstrates their important effect on arterial wall stiffness while showing that CAVI can be used in predicting the prognosis of arterial wall health in patients with diabetes.
Keywords: diabetes mellitus type 2, cavi, cardiovascular prevention, atherosclerosis, arterial stiffness
Introduction
Arterial stiffness is independently associated with the increased risk of cardiovascular events. It is affected by a wide variety of factors such as age, gender, smoking, body mass index (BMI), and multiple metabolic and cardiovascular factors. Lifestyle and habits like smoking were found to be associated with a higher incidence of arterial stiffness [1]. In addition, several chronic conditions are also associated with arterial stiffness. One of the most important metabolic disorders is type 2 diabetes mellitus (T2DM), which has deleterious consequences on the whole body system. The cardiovascular system is no exception as both macrovascular and microvascular involvements are major complications in patients suffering from T2DM. These complications account for around 70% of deaths in people with T2DM as they have a four times higher risk of developing serious cardiovascular events [2].
Arterial stiffness can be measured using different means; cardio-ankle vascular index (CAVI) is a new means of arterial wall stiffness assessment that can detect changes in arterial wall stiffness shortly after changes in circulation happen. It measures arterial wall stiffness in several different arteries. It can be calculated by recording the distance from the level of the aortic valve to a different measuring site and the time delay between the closure of the aortic valve to the detected difference in arterial pressure wave at the target measurement site. The distinctive features in CAVI are that it changes in a short time period in response to changes in the circulation, and it reflects the condition of smooth muscles contraction rather than the blood pressure (BP). So, it is not affected by the changes in BP levels [2,3].
Recent studies have demonstrated that changes in CAVI are associated with plasma glucose levels. It is higher in patients who have diabetes when compared with subjects that do not have it. Since the disturbance in the glucose levels in diabetic patients can bring about vascular complications, which may result in serious cardiovascular events, this study is conducted to review the correlation between arterial stiffness assessed by CAVI with fasting blood glucose (FBG) and hemoglobin A1c (HbA1c) levels in patients with T2DM [4].
Materials and methods
Subjects
A total of 200 patients were approached and 188 patients achieved the inclusion criteria. Therefore, they were included in the study. All patients were diagnosed with T2DM for five years or more. The study collected data regarding FBG, HbA1c, and lipid profile as total cholesterol, low-density lipoprotein (LDL), high-density lipoprotein (HDL), and triglycerides (TRG) were noted at the time of CAVI measurement ± three months. We also considered the history of hypertension and dyslipidemia based on whether they are diagnosed with hypertension or dyslipidemia or not in the King Fahd Hospital of the University (KFHU) database.
The recent diagnostic criteria were published by the American Diabetes Association (ADA), which documented that diabetes disease is confirmed when a patient has an FBG of 126 mg/dL or more, HbA1c of 6.5% or more, two hours postprandial blood glucose of 200 mg/dL or more, or any patient with classical symptoms of hyperglycemia or hyperglycemic crisis with random plasma glucose of 200 mg/dL or more [5]. According to the Japan Society for Vascular Failure, CAVI readings below 8 are considered normal, CAVI readings equal to 8 and less than 9 are considered borderline, and CAVI readings more than 9 are considered abnormal [6].
Inclusion Criteria
Patients with T2DM who satisfied the aforementioned ADA diagnostic criteria of T2DM and attended the Diabetic Care Centre at KFHU were included in the study. In addition, they must have been diagnosed with T2DM for at least five years.
Exclusion Criteria
Patients who did not meet the ADA criteria for T2DM were excluded from the study. Patients who have been diagnosed with diabetes for less than five years and those who have been diagnosed with other types of diabetes were excluded.
Sample size and sampling technique
The data of 200 patients were collected from the medical records stored in the KFHU database (QuadraMed). A total of 188 patients met the inclusion criteria and 12 were excluded. A patient was considered diabetic if found and documented in the database as being diabetic, and all patients who met the inclusion criteria were included in this study.
The data collection sheet was created by the study authors. It included the patient’s demographic data, risk factors of T2DM including smoking, hypertension, and dyslipidemia, brachial and ankle CAVI measurements for both right and left sides, and laboratory results involving HbA1c, FBG, and lipid profile.
Data analysis
Data gathering was established in Microsoft Excel (Microsoft Corporation, Redmond, WA) and was analyzed using Statistical Package for the Social Sciences (SPSS) version 23 (IBM SPSS Statistics, Armonk, NY) with a 95% confidence interval. The quantitative variables were reported using average and standard deviation. Qualitative variables were recorded by using frequency and percentage. The study analysis utilized cross-tabulation and graphs. For inferential statistics, the normality of the data was tested first by using the Shapiro-Wilk test. Also, the Mann-Whitney U test was used to compare means in the comparison of dichotomous variables. For correlation between two continuous variables, Spearman’s correlation test was used. One-way analysis of variance (ANOVA) was also applied to compare means between three groups or more. The level of significance was set at 0.05.
Results
A total of 188 participants were included in this study. The results show that the average age of the study participants was 54.99 years. The average body weight was 89.1 kg and the average height was 163.47 cm. Furthermore, the results reveal that the average BMI is more towards the obese side with an average score of 33.29 kg/m2. In regards to gender, the majority of the study participants were males (61.1%) compared to the females who make up 38.9% of the study sample. Regarding BMI, it can be noted that 9.0% of the study participants were in the normal BMI range while 30.3% of the participants were overweight, whereas the obese participants make up the majority of the sample (60.6%). In terms of smoking, most of the participants were smokers (73.8%) compared to 26.2% non-smokers. Moreover, 64.3% of the study participants were diagnosed with hypertension. And in regards to dyslipidemia, a total of 137 (72.8%) of the participants have dyslipidemia, compared to 37.2% who do not. Table 1 presents the sociodemographic characteristics of the study participants.
Table 1. Sociodemographic characteristics of participants (n = 188).
| Characteristics | Average ± SD |
| Age | 54.99 ± 11.4 |
| Weight | 89.1 ± 19.67 |
| Height | 163.47 ± 9.14 |
| BMI | 33.29 ± 7.33 |
| Characteristics | Frequency (percentage) |
| Gender | |
| Male | 115 (61.1%) |
| Female | 73 (38.9%) |
| BMI category | |
| Normal | 17 (9.04%) |
| Overweight | 57 (30.31%) |
| Obese | 114 (60.63%) |
| Smoking | |
| Yes | 136 (73.8%) |
| No | 52 (26.2%) |
| Hypertension | |
| Yes | 121 (64.3%) |
| No | 67 (35.7%) |
| Dyslipidemia | |
| Yes | 137 (72.8%) |
| No | 51 (37.2%) |
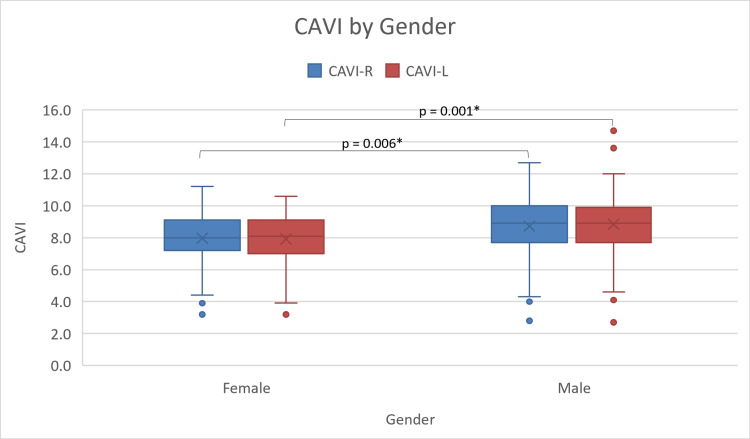
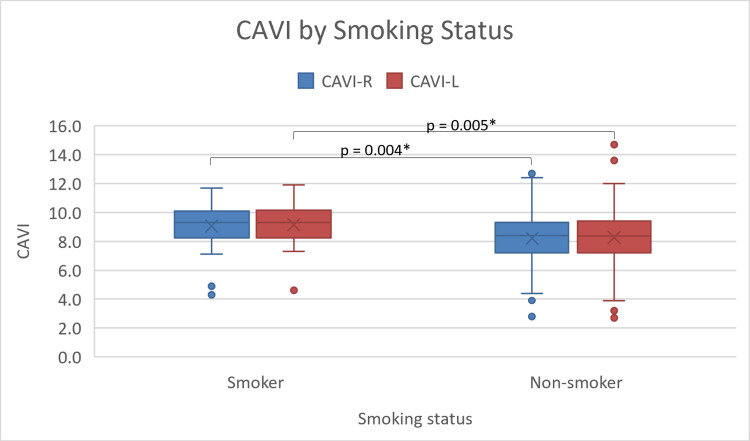
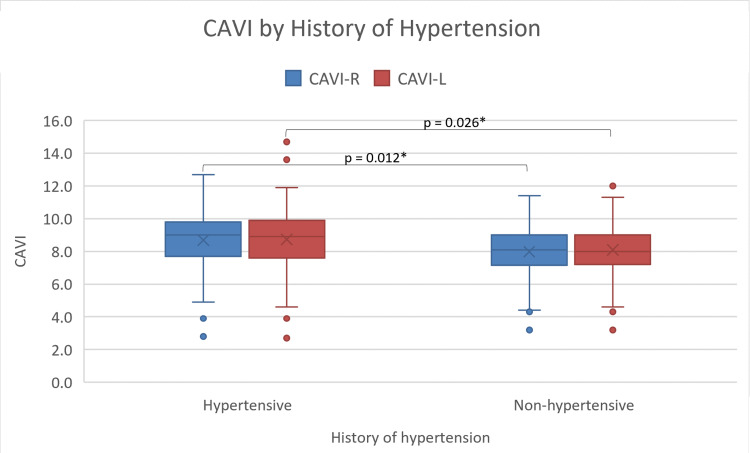
Regarding the scores of CAVI, the results reveal that the male CAVI scores are significantly (p = 0.001) higher than female scores with male and female CAVI mean scores of 8.81 ± 1.8 and 7.88 ± 1.6, respectively (Figure 1). The results further demonstrate that the average CAVI scores for patients who smoke (9.1 ± 1.5) are higher than those of non-smokers (8.35 ± 1.8), with a p-value of 0.03 (Figure 2). In addition, hypertensive participants (8.69 ± 1.79) show higher CAVI scores compared to non-hypertensive ones (8.00 ± 1.71; p = 0.01) (Figure 3). Also, participants who are considered normal and overweight have higher average CAVI scores (9.2 ± 1.96 and 9.08 ± 1.56, respectively) than those of the obese participants (8.09 ± 1.82) with a p-value < 0.001. Table 2 compares the average CAVI scores for the sample characteristics.
Table 2. Results of CAVI average scores according to the selected variables (n = 188).
* P-value of 0.05 or less is statistically significant.
| Variable | Average ± SD | p-value |
| Gender | ||
| Male | 8.81 ± 1.8 | 0.001* |
| Female | 7.88 ± 1.6 | |
| BMI | ||
| Normal | 9.2 ± 1.96 | 0.001* |
| Overweight | 9.08 ± 1.56 | |
| Obese | 8.09 ± 1.82 | |
| Smoking status | ||
| Smoker | 9.1 ± 1.5 | 0.03* |
| Non-smoker | 8.35 ± 1.8 | |
| Hypertension | ||
| Yes | 8.69 ± 1.79 | 0.01* |
| No | 8.00 ± 1.71 | |
| Dyslipidemia | ||
| Yes | 8.53 ± 1.91 | 0.37 |
| No | 8.26 ± 1.39 | |
Figure 1. Box and whiskers plots of right and left CAVI averages by gender.
CAVI: cardio-ankle vascular index; CAVI-R: right cardio-ankle vascular index; CAVI-L: left cardio-ankle vascular index.
* P-value of 0.05 or less is statistically significant.
Figure 2. Box and whiskers plot of right and left CAVI by smoking status.
CAVI: cardio-ankle vascular index; CAVI-R: right cardio-ankle vascular index; CAVI-L: left cardio-ankle vascular index.
* P-value of 0.05 or less is statistically significant.
Figure 3. Box and whiskers plot of right and left CAVI by the history of hypertension.
CAVI: cardio-ankle vascular index; CAVI-R: right cardio-ankle vascular index; CAVI-L: left cardio-ankle vascular index.
* P-value of 0.05 or less is statistically significant.
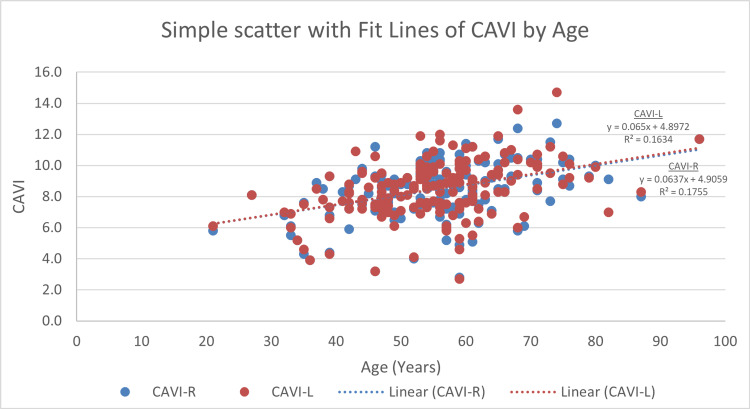
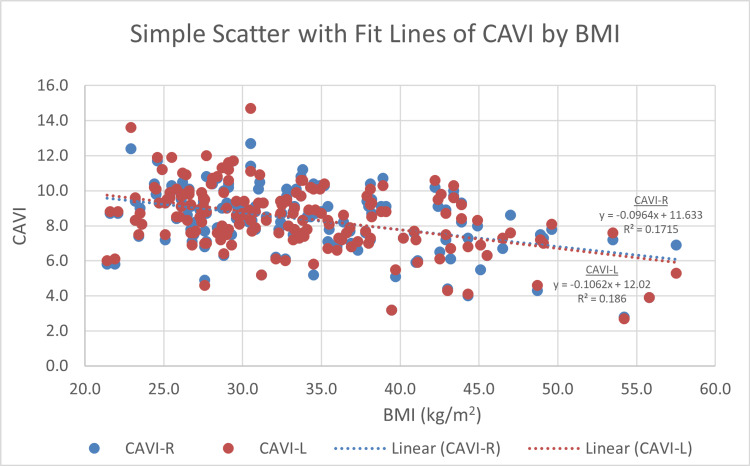
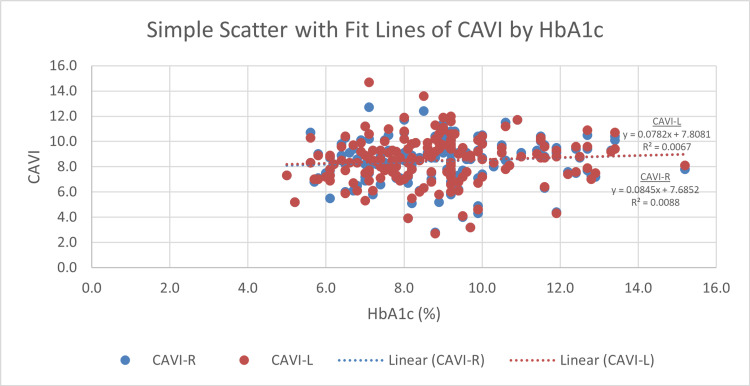
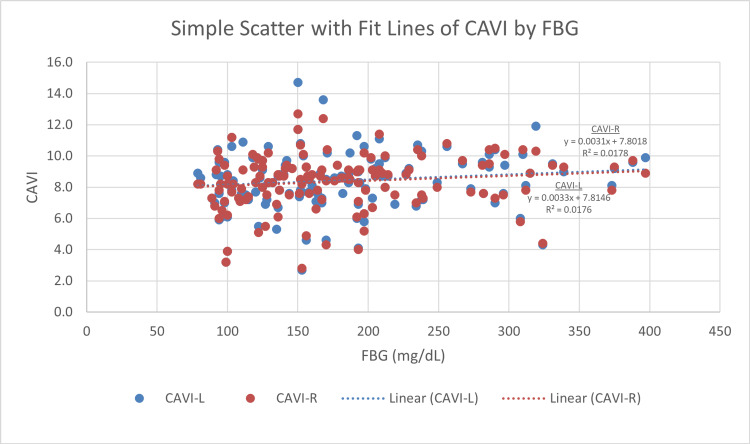
Right CAVI and left CAVI measures display a significant correlation with age. The more senior participants have statistically significant higher CAVI scores (r = 0.417, p < 0.001 and r = 0.405, p < 0.001, respectively) (Figure 4). BMI displays an inverse correlation with both right and left CAVI readings (r = −0.411, p < 0.001 and r = −0.425, p < 0.001, respectively) (Figure 5). For blood glucose levels, although the findings are not significant, right and left CAVI scores are higher in participants with higher HbA1c and FBG (Figures 6, 7). Table 3 describes the correlation of right and left CAVI readings with the study variables.
Table 3. Clinical characteristics of the study sample and bivariate analysis with right CAVI and left CAVI (n = 188).
BMI: body mass index; LDL: low-density lipoprotein; HDL: high-density lipoprotein; BUN: blood urea nitrogen; CAVI: cardio-ankle vascular index; HbA1c: hemoglobin A1c; FBG: fasting blood glucose.
* P-value of 0.05 or less is statistically significant.
| Variable | Right CAVI | Left CAVI |
| Physical constitution | ||
| Age (years) | r = 0.417 (p < 0.001*) | r = 0.405 (p < 0.001*) |
| Weight (kg) | r = −0.345 (p < 0.001*) | r = −0.341 (p < 0.001*) |
| Height (cm) | r = 0.118 (p = 0.124) | r = 0.150 (p = 0.048*) |
| BMI (kg/m2) | r = −0.411 (p < 0.001*) | r = −0.425 (p < 0.001*) |
| Blood chemistry | ||
| HbA1c (%) | r = 0.092 (p = 0.228) | r = 0.082 (p = 0.284) |
| FBG (mg/dL) | r = 0.146 (p = 0.084) | r = 0.138 (p = 0.104) |
| Total cholesterol (mg/dL) | r = −0.147 (p = 0.084) | r = −0.113 (p = 0.186) |
| LDL (mg/dL) | r = 0.079 (p = 0.358) | r = −0.061 (p = 0.476) |
| HDL (mg/dL) | r = −0.114 (p = 0.182) | r = −0.108 (p = 0.208) |
| Triglycerides (mg/dL) | r = −0.112 (p = 0.19) | r = 0.052 (p = 0.548) |
| Hemodynamics | ||
| Left systolic blood pressure (mmHg) | r = −0.14 (p = 0.855) | r = −0.29 (p = 0.766) |
| Left diastolic blood pressure (mmHg) | r = 0.025 (p = 0.742) | r = 0.043 (p = 0.575) |
| Left mean arterial pressure (mmHg) | r = −0.07 (p = 0.86) | r = 0.26 (p = 0.16) |
| Left pulse pressure (mmHg) | r = −0.031 (p = 0.683) | r = −0.022 (p = 0.778) |
Figure 4. Scatter plot of right and left CAVI scores by age.
CAVI: cardio-ankle vascular index; CAVI-R: right cardio-ankle vascular index; CAVI-L: left cardio-ankle vascular index.
Figure 5. Scatter plot of right and left CAVI scores by body mass index.
CAVI: cardio-ankle vascular index; CAVI-R: right cardio-ankle vascular index; CAVI-L: left cardio-ankle vascular index.
Figure 6. Scatter plot of right and left CAVI scores by HbA1c.
CAVI: cardio-ankle vascular index; CAVI-R: right cardio-ankle vascular index; CAVI-L: left cardio-ankle vascular index; HbA1c: hemoglobin A1c.
Figure 7. Scatter plot of right and left CAVI scores by fasting blood glucose.
FBG: fasting blood glucose; CAVI: cardio-ankle vascular index; CAVI-R: right cardio-ankle vascular index; CAVI-L: left cardio-ankle vascular index.
Discussion
In this study, we aimed to assess the relationship of different metabolic measures with hemodynamic measures. Owing to the fact that CAVI is not the standard modality of arterial wall stiffness assessment in KFHU, it was difficult to find an adequate number of pre-existing charts for CAVI readings for patients with T2DM. Thus, a larger sample size could not be achieved with the available charts. The study is also limited by the lack of longer-term follow-up with the sample population.
The significant findings of the study are the relationship between gender, age, and history of hypertension with CAVI measurements. CAVI readings are inversely correlated with BMI. As for glucose levels, we found an insignificant positive correlation of CAVI scores with HbA1c and FBG.
Arterial wall stiffness is defined as dysfunction of the arterial elastic capacity that leads to abnormal increases in the systolic blood pressure and decreases in diastolic blood pressure. A stiff arterial wall will require more pressure from the heart to overcome arterial dysfunction and stiffness. Increased heart pressure will increase the arterial pressure and therefore affect the volume by reducing it since the arterial wall cannot recoil properly. Clinical manifestations of arterial stiffness include stroke and left ventricle enlargement as a result of increased blood pressure. Chronic exposure to elevated levels of blood pressure could result in heart failure, a condition in which the heart cannot meet the body’s demands [7].
Multiple studies concluded that there is a correlation between increased arterial stiffness in patients with T2DM [8,9]. Also, the presence of diabetes mellitus increased the risk of microvascular and macrovascular complications such as arterial stiffness [10-14]. Pulse wave velocity (PWV) is a known tool for estimating arterial stiffness. A study done by Elias et al. based on a prospective analysis of the Maine-Syracuse study to link T2DM and arterial stiffness came to an interesting effect of diabetes on the PWV and thus, the arterial stiffness, in which they found that PWV readings were significantly higher in individuals with T2DM than healthy individuals. In addition to this conclusion, they also compared diabetics with controlled and uncontrolled glycemic levels. The uncontrolled group had more than three times the risk of having elevated PWV than the controlled group. Furthermore, comparing the uncontrolled to the non-diabetic group found more than eight times the risk of having a high PWV, which lead ultimately to linking diabetes to arterial stiffness, and more so in uncontrolled diabetes. In addition, patients with T2DM were found to have elevated pulse pressure (PP) and it has been found that elevated PP is predictive of future cardiovascular attacks [15-17].
The main measurement tool used in the data collected was CAVI, which is a noninvasive test used to estimate arterial stiffness by measuring brachial and ankle blood pressure, PP, and mean arterial pressure for both right and left sides. It is well understood that certain metabolic diseases can affect the health of the arterial wall, leading to arterial dysfunction and arterial stiffness [15]. CAVI measurement has been reported as a predictor of prognosis of the patients with cardiovascular disease [18]. Also, it has been reported that CAVI measurements are highly associated with blood glucose and HbA1c levels. Patients with elevated FBG and HbA1c tend to have higher CAVI measurements in relation to the normal population. Moreover, previous studies demonstrated that high levels of HbA1c are associated with increased lipid profile such as triglyceride and low-density lipoprotein levels, which eventually could precipitate the cardio-vascular events and nephropathies [19,20].
The results of this study display further emphasis on the relationship between glucose levels and arterial wall health.
Conclusions
Although not statistically significant, CAVI had a linear association with blood glucose readings. This study yields that there is evidence suggesting that abnormally elevated blood chemistry, blood glucose levels, and blood pressure measurements are linked with higher CAVI scores, demonstrating their important effect on arterial wall stiffness while showing that CAVI can be used in predicting the prognosis of arterial wall health in patients with diabetes.
More studies are needed with a larger sample size to identify the major risks of developing arterial stiffness, and longer follow-up with the patients' data recording could yield more accurate results.
The content published in Cureus is the result of clinical experience and/or research by independent individuals or organizations. Cureus is not responsible for the scientific accuracy or reliability of data or conclusions published herein. All content published within Cureus is intended only for educational, research and reference purposes. Additionally, articles published within Cureus should not be deemed a suitable substitute for the advice of a qualified health care professional. Do not disregard or avoid professional medical advice due to content published within Cureus.
The authors have declared that no competing interests exist.
Human Ethics
Consent was obtained or waived by all participants in this study. Imam Abdulrahman Bin Faisal University IRB issued approval IRB-USG-2020-01-420. The application was reviewed and approved at Imam Abdulrahman Bin Faisal University IRB through an Expedited Review on Monday, December 28, 2020. Approval is given for one year from the date of approval. Projects, which have not commenced within six months of the original approval, must be re-submitted to the University Institutional Review Board (IRB) Committee. If you are unable to complete your research within the validation period, you will be required to request an extension from the IRB Committee. On completion of the research, the Principal Investigator is required to advise the Institutional Review Board if any changes are made to the protocol, a revised protocol must be submitted to the Institutional Review Board for reconsideration. Approval is given on the understanding that the "Guidelines for Ethical Research Practice" are adhered to. Where required, a signed written consent form must be obtained from each participant in the study group.
Animal Ethics
Animal subjects: All authors have confirmed that this study did not involve animal subjects or tissue.
References
- 1.Associations between smoking and alcohol use and arterial elasticity in patients with newly diagnosed essential hypertension: a cross-sectional study. Jatoi NA, Al-Baker WI, Al-Muhanna A, Al-Muhanna F, Kyvelou SM, Sharif F. https://doi.org/10.1016/j.artres.2017.10.196 Artery Res. 2017;20:12–18. [Google Scholar]
- 2.Diabetes-related microvascular and macrovascular diseases in the physical therapy setting. Cade WT. Phys Ther. 2008;88:1322–1335. doi: 10.2522/ptj.20080008. [DOI] [PMC free article] [PubMed] [Google Scholar]
- 3.Clinical value of aortic pulse-wave velocity measurement. Lehmann ED. Lancet. 1999;354:528–529. doi: 10.1016/S0140-6736(99)00179-8. [DOI] [PubMed] [Google Scholar]
- 4.2017 ACC/AHA/AAPA/ABC/ACPM/AGS/APhA/ASH/ASPC/NMA/PCNA guideline for the prevention, detection, evaluation, and management of high blood pressure in adults: a report of the American College of Cardiology/American Heart Association Task Force on Clinical Practice Guidelines. Whelton PK, Carey RM, Aronow WS, et al. Hypertension. 2018;71:0–115. [Google Scholar]
- 5.2. Classification and diagnosis of diabetes: standards of medical care in diabetes-2018. American Diabetes Association. Diabetes Care. 2018;41:0–27. doi: 10.2337/dc18-S002. [DOI] [PubMed] [Google Scholar]
- 6.Official announcement of physiological diagnostic criteria for vascular failure from the Japanese Society for Vascular Failure. Tanaka A, Tomiyama H, Maruhashi T, et al. 2018;2:59–60. doi: 10.1161/HYPERTENSIONAHA.118.11554. [DOI] [PubMed] [Google Scholar]
- 7.Vlachopoulos C, O'Rourke M, Nichols WW. London, UK: CRC Press; 2011. McDonald's Blood Flow in Arteries: Theoretical, Experimental and Clinical Principles. [Google Scholar]
- 8.Correlation between the intima-media thickness of the carotid artery and aortic pulse-wave velocity in patients with type 2 diabetes. Vessel wall properties in type 2 diabetes. Taniwaki H, Kawagishi T, Emoto M, et al. Diabetes Care. 1999;22:1851–1857. doi: 10.2337/diacare.22.11.1851. [DOI] [PubMed] [Google Scholar]
- 9.Impaired fasting glucose is associated with increased arterial stiffness in elderly people without diabetes mellitus: the Rotterdam study. van Popele NM, Elizabeth Hak A, Mattace-Raso FU, et al. J Am Geriatr Soc. 2006;54:397–404. doi: 10.1111/j.1532-5415.2005.00614.x. [DOI] [PubMed] [Google Scholar]
- 10.Diabetes mellitus and renal failure: effects on large artery stiffness. Aoun S, Blacher J, Safar ME, Mourad JJ. J Hum Hypertens. 2001;15:693–700. doi: 10.1038/sj.jhh.1001253. [DOI] [PubMed] [Google Scholar]
- 11.Augmentation of central arterial pressure as a marker of atherosclerosis in patients with type 2 diabetes. Fukui M, Kitagawa Y, Nakamura N, et al. Diabetes Res Clin Pract. 2003;59:153–161. doi: 10.1016/s0168-8227(02)00204-8. [DOI] [PubMed] [Google Scholar]
- 12.Regional arterial stiffness in patients with type 2 diabetes and chronic kidney disease. Kimoto E, Shoji T, Shinohara K, et al. J Am Soc Nephrol. 2006;17:2245–2252. doi: 10.1681/ASN.2005101038. [DOI] [PubMed] [Google Scholar]
- 13.Estimated glomerular filtration rate and urinary albumin excretion are independently associated with greater arterial stiffness: the Hoorn study. Hermans MM, Henry R, Dekker JM, et al. J Am Soc Nephrol. 2007;18:1942–1952. doi: 10.1681/ASN.2006111217. [DOI] [PubMed] [Google Scholar]
- 14.Association of brachial-ankle pulse wave velocity with cardiovascular risk factors in systemic lupus erythematosus. Tso TK, Huang WN, Huang HY, Chang CK. Lupus. 2005;14:878–883. doi: 10.1191/0961203305lu2234oa. [DOI] [PubMed] [Google Scholar]
- 15.Associations between type 2 diabetes mellitus and arterial stiffness: a prospective analysis based on the Maine-Syracuse study. Elias MF, Crichton GE, Dearborn PJ, Robbins MA, Abhayaratna WP. Pulse (Basel) 2018;5:88–98. doi: 10.1159/000479560. [DOI] [PMC free article] [PubMed] [Google Scholar]
- 16.Insulin resistance and hypertension in Japanese. Iimura O. Hypertens Res. 1996;19:0–8. doi: 10.1291/hypres.19.supplementi_s1. [DOI] [PubMed] [Google Scholar]
- 17.Diabetes, pulse pressure and cardiovascular mortality: the Hoorn study. Schram MT, Kostense PJ, Van Dijk RA, et al. J Hypertens. 2002;20:1743–1751. doi: 10.1097/00004872-200209000-00017. [DOI] [PubMed] [Google Scholar]
- 18.Pulse pressure predicts cardiovascular risk in patients with type 2 diabetes mellitus. Cockcroft JR, Wilkinson IB, Evans M, et al. Am J Hypertens. 2005;18:1463–1467. doi: 10.1016/j.amjhyper.2005.05.009. [DOI] [PubMed] [Google Scholar]
- 19.Brachial-ankle pulse wave velocity, cardio-ankle vascular index, and prognosis. Ato D. Vasc Health Risk Manag. 2018;14:321–348. doi: 10.2147/VHRM.S179366. [DOI] [PMC free article] [PubMed] [Google Scholar]
- 20.The association of cardio-ankle vascular index and ankle-brachial index with macroangiopathy in patients with type 2 diabetes mellitus. Niwa H, Takahashi K, Dannoura M, Oomori K, Miyoshi A, Inada T, Miyoshi H. J Atheroscler Thromb. 2019;26:616–623. doi: 10.5551/jat.45674. [DOI] [PMC free article] [PubMed] [Google Scholar]


