

Abstract
Background
Rates of fatal opioid overdose in Massachusetts (MA) and Rhode Island (RI) far exceed the national average. Community-based opioid education and naloxone distribution (OEND) programs are effective public health interventions to prevent overdose deaths. We compared naloxone distribution and opioid overdose death rates in MA and RI to identify priority communities for expanded OEND.
Methods
We compared spatial patterns of opioid overdose fatalities and naloxone distribution through OEND programs in MA and RI during 2016 to 2019 using public health department data. The county-level ratio of naloxone kits distributed through OEND programs per opioid overdose death was estimated and mapped to identify potential gaps in naloxone availability across geographic regions and over time.
Results
From 2016 to 2019, the statewide community-based naloxone distribution to opioid overdose death ratio improved in both states, although more rapidly in RI (from 11.8 in 2016 to 35.6 in 2019) than in MA (from 12.3 to 17.2), driven primarily by elevated and increasing rates of naloxone distribution in RI. We identified some urban/non-urban differences, with higher naloxone distribution relative to opioid overdose deaths in more urban counties, and we observed some counties with high rates of overdose deaths but low rates of naloxone kits distributed through OEND programs.
Conclusions
We identified variations in spatial patterns of opioid overdose fatalities and naloxone availability, and these disparities appeared to be widening in some areas over time. Data on the spatial distribution of naloxone distribution and opioid overdose deaths can inform targeted, community-based naloxone distribution strategies that optimize resources to prevent opioid overdose fatalities.
Keywords: community-based opioid education and naloxone distribution, opioid overdose death, descriptive analysis, spatial patterns
Introduction
The drug overdose crisis in the United States is escalating and rapidly evolving. In 2019 (the most recent year for which federal data is available), 70,630 drug overdose deaths were recorded (Hedegaard, Miniño, & Warner, 2020). Prior to the COVID-19 pandemic, drug overdoses were the leading cause of death among adults aged 25 to 44 years (Faust, et al., 2021). Among these drug overdose deaths, about 70% (46,802) involved opioids, two-thirds of which involved synthetic opioids, such as fentanyl (Wilson, 2020). Opioid overdose deaths were responsible for a total of 1,681,359 years of life lost (5.2 per 1,000 population) in the US in 2016 (Gomes, Tadrous, Mamdani, Paterson, & Juurlink, 2018). The New England region of the United States has been particularly hard hit. In 2018, the rate of opioid overdose deaths reached 29.3 per 100,000 in Massachusetts and 25.9 per 100,000 in Rhode Island—both far exceeding the national average of 14.6 per 100,000 (KFF, 2020; Wilson, 2020). Between 2000 and 2016, rates of fatal overdose more than tripled in the majority of New England counties (Manchester & Sullivan, 2019). The ongoing COVID-19 crisis presents additional challenges for individuals with opioid use disorders (OUD) and others who are at risk of opioid overdose. Emerging evidence indicates that opioid overdoses are surging during the pandemic, which was likely caused by a continuation of the infiltration of fentanyl into the illicit drug supply, disruptions in the delivery of harm reduction services and medications for OUD during the pandemic, and worsening social isolation and concomitant mental health challenges among people who use substances (Alexander, Stoller, Haffajee, & Saloner, 2020; Becker & Fiellin, 2020; CDC, 2020; Ciccarone, 2021; Khatri & Perrone, 2020; Slavova, Rock, Bush, Quesinberry, & Walsh, 2020). In this context, effective public health responses (including increased, and more efficient naloxone distribution efforts) are urgently needed to address opioid overdose and prevent deaths among those at greatest risk.
Naloxone distribution is an effective strategy to reduce opioid overdose deaths, and has been endorsed as one of the top three strategies for addressing the opioid crisis by the US Department of Health and Human Services’ Opioid Initiative (CDC, 2020; US Department of Health & Human Services, 2015). Respiratory depression caused by opioid overdose can be reversed by naloxone, a safe and effective opioid antagonist that requires minimal training to use. Community-based opioid education and naloxone distribution (OEND) programs, which provide overdose recognition, response training and naloxone to people at risk of overdose and to persons in their social networks, are an effective, evidence-based approach to reduce opioid overdose deaths (Bird, McAuley, Perry, & Hunter, 2016; Clark, Wilder, & Winstanley, 2014; Giglio, Li, & DiMaggio, 2015; McDonald & Strang, 2016; Walley, et al., 2013). The cost-effectiveness of OEND programs has been evidenced by several modeling studies (Acharya, Chopra, Hayes, Teeter, & Martin, 2020; Coffin & Sullivan, 2013; Townsend, et al., 2020). Both Massachusetts and Rhode Island have passed legislation that confers immunity from liability for possessing or administering naloxone.
Expanding the availability and use of naloxone is an essential component of the public health responses to the opioid overdose crisis. According to a multi-sample capture-recapture analysis, the prevalence of OUD (including those with known and unknown OUD) in Massachusetts was estimated to be 4.6% among people aged 12 years and older (Barocas, et al., 2018). The prevalence was found to be 5.2% in Rhode Island based on a statewide cross-sectional assessment of the OUD cascade of care (Yedinak, et al., 2019). According to 2018 census data (American Community Survey, 2018a, 2018b), the prevalence corresponds to a total of 277,089 and 48,380 people who are at risk for or with OUD in Massachusetts and Rhode Island, respectively. With such large at-risk populations, strategies to optimize the distribution of naloxone through community-based programs are needed to reduce preventable deaths. Given that the extend and magnitude of the opioid epidemic—and thus the demand for naloxone—may vary across geographic regions and is constantly evolving, naloxone distribution strategies should be carefully and strategically implemented to ensure this life-saving medication is reaching the populations who need it most. Previous studies have revealed regional variation in naloxone access but focused on pharmacy-based naloxone only (Antoniou, et al., 2020; Dodson, Enki Yoo, Martin-Gill, & Roth, 2018). In this context, an in-depth examination of overdose deaths and naloxone availability across jurisdictions is indicated for optimizing priority setting in naloxone distribution. We aimed to describe the spatial patterns of opioid overdose fatalities and community-based naloxone distribution in the states of Massachusetts and Rhode Island. In the analysis, we also explored the use of a metric based on the ratio of naloxone kits per opioid overdose death in the assessment of naloxone availability and identifying priority communities for expanded OEND.
Methods
Mapping opioid overdose deaths and naloxone distribution
We created maps to contrast geographic distributions of fatal opioid overdoses and naloxone kits distributed through OEND programs during January 2016 to December 2019 by an annual rate per 100,000 residents to ensure comparability across jurisdictions. We defined the geographic unit as county in Massachusetts (N=14) and Rhode Island (N=5). Given the proximity and small population size (and small counts of opioid overdose deaths and naloxone kits distributed) of Dukes County and Nantucket County in Massachusetts, we grouped these together as one area in our analysis. Opioid overdose deaths in Massachusetts were extracted from the Registry of Vital Statistics and the Office of the Chief Medical Examiner, which were reported to Massachusetts Department of Public Health (MDPH) and published for each city/town annually. In Rhode Island, the annual number of opioid overdose deaths was obtained from the Office of State Medical Examiners at the Rhode Island Department of Health (RIDOH). Opioid overdose deaths included deaths in which heroin, fentanyl, opioid-based prescription medications, and/or other unspecified opioids were listed as contributing to the cause of death. In Rhode Island, only unintentional (accidental) opioid overdose deaths were reported and included for analysis, whereas intentional (suicide) cases were also included in Massachusetts.
To determine the number of naloxone kits distributed in each county, we compiled community OEND data collected by MDPH and RIDOH. MDPH collects individual-level data from all OEND sites across the state of Massachusetts at the time they enroll participants, as well as when recipients return for additional naloxone kits. The sites include syringe services programs, substance use treatment programs, post-overdose outreach programs, support groups for families of people who use opioids, medical sites, and other community programs. In Rhode Island, community-based naloxone kits are distributed by a similar set of programs/organizations where information is collected through a statewide, standardized reporting form for each individual receiving naloxone kit(s) from any OEND programs in the state. Pharmacy-provided naloxone kits and those distributed through hospitals and emergency departments were not included in either states’ OEND counts and are excluded from this analysis.
The annual number of opioid overdose deaths was aggregated at the county level according to the city/town of residence of the deceased individual, while the annual number of naloxone kits was aggregated according to the city/town (in Rhode Island) or ZIP Code (in Massachusetts) of residence of the individuals receiving each naloxone kit. We focused on the number of naloxone kits that were received by residents of each county rather than the number of kits distributed through organizations operating in each jurisdiction, and we excluded those received by persons from outside the state. However, there existed cases where information for recipients’ residence was missing, accounting for 5.5% of all kits distributed through OEND programs in Massachusetts and 13.3% in Rhode Island after excluding those received by residents from other states. Observations with complete information were used to impute the delivery location for kits with missing information on residence. For Massachusetts, given that ZIP codes for the distribution organization of each naloxone kit were unavailable in the dataset, we allocated those with unknown residence proportionally to the annual number of naloxone kits (with complete data) received in each ZIP code. For Rhode Island, we created a matrix to track the annual percentages of naloxone kits distributed from all OEND programs operating in a given city/town to residents in each city/town using data with complete information, and we assumed kits with missing residence followed the same movement patterns.
We then used the county-level population size to estimate the rate of opioid overdose deaths and rate of naloxone kits distributed through OEND programs per 100,000 residents (all population) in each county. We calculated the correlation between these two rates and generated scatter plots to display the relationship between these rates during each year of the observation period. We also compared the rate of opioid overdose deaths in each county in the prior year with the rate of naloxone kits distributed through OEND programs in the next year and vice versa to account for any time-lag effects. The rationale for considering these alternatives is that newly distributed naloxone kits may not be immediately used (next year effect), while the amount of naloxone distributed may be a response to data on overdoses that occurred in the previous year (past year effect). In addition, we used the estimated size of prevalent individuals with OUD (in Introduction) to calculate the number of naloxone kits received per individual with OUD per annum in each state.
Naloxone kits per opioid overdose death ratio
At present, there are few established measures for assessing the level of naloxone availability to guide localized naloxone distribution strategies (Lambdin, et al., 2020). In suggesting a performance measure for Scotland’s take-home naloxone policy, Bird et al. recommended a target level of annual provision of naloxone kits that should be at least 20 times the number of opioid overdose deaths per year based on the lethality of heroin overdoses in Scotland (Bird, Parmar, & Strang, 2015). Based on this literature, we calculated the ratio between the number of naloxone kits received by county residents in a given year and the number opioid overdose deaths that occurred in the same area and year as an indicator for naloxone availability. Deaths from opioid overdoses were presumed to be a reliable metric of the epidemic given its standardized disease classification and surveillance reporting system (Jalal, et al., 2018). Using the same data that informed our maps of naloxone distribution and fatal overdoses, we calculated the naloxone kits per opioid overdose death ratio for each year between 2016 and 2019 and created heatmaps to analyze the longitudinal and geographic dynamics of naloxone availability in both states. These maps can help identify key naloxone “deserts” where community-based naloxone distribution is lacking relative to opioid overdose deaths.
This study was deemed exempt by Brown University, RIDOH, Boston University Medical Campus, and MDPH Institutional Review Boards, as this work involved analysis of aggregate and/or publicly available data.
Results
From 2016 to 2019, 121,638 and 23,210 naloxone kits were distributed through OEND programs in Massachusetts and Rhode Island, respectively. We estimated that, on average, 0.11 and 0.12 naloxone kits were received per individual with OUD per annum (based on the estimated number of at-risk people) in Massachusetts and Rhode Island, and 14.9 and 23.6 naloxone kits were distributed per opioid overdose death in the two states, respectively.
The average annual rate of opioid overdose death per 100,000 residents was estimated to be higher in Massachusetts (state-level rate: 29.7, county-level range: [17.4-42.6]) than in Rhode Island (state-level rate: 23.2, county-level range: [13.9-26.8]) between 2016 and 2019 (Figure 1A, Appendix Table A1). The three counties with the highest opioid overdose rates were in Massachusetts (MA): Hampden (34.8), Essex (36.2), and Bristol (42.6). Conversely, the three counties with the lowest overdose death rate were in Rhode Island (RI): Newport (16.4), Washington (15.5) and Bristol (13.9).
Figure 1. Average annual rate of opioid overdose deaths and naloxone kits distributed through OEND programs per 100,000 residents, Massachusetts and Rhode Island, 2016-2019.
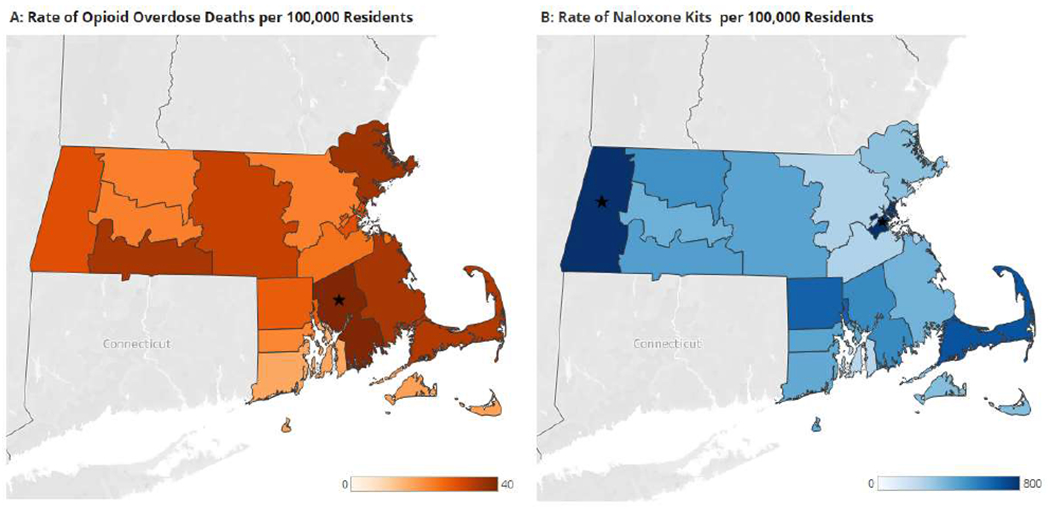
Range for the rate of opioid overdose deaths: 13.9-42.6; range for the rate of naloxone kits: 235-1178. Stars represent counties whose rate of opioid overdose death rate were over 40 per 100,000 residents or whose rate of naloxone kits distributed were over 800 per 100,000 residents
We found the average annual rate of naloxone kits distributed through OEND programs per 100,000 residents to be higher in Rhode Island (state-level rate: 548, county-level range: [235-650]) than in Massachusetts (state-level rate: 441, county-level range: [257-1178]) during years 2016-2019 (Figure 1B, Appendix Table A1). The three counties with the lowest rate of naloxone kits distributed through OEND programs were Middlesex, MA (262), Norfolk, MA (257), and Newport, RI (235), while the three highest rates were found in Barnstable, MA (695), Suffolk, MA (854), and Berkshire, MA (1178) counties. In general, we found a steady increase in the number of naloxone kits distributed across most counties in both states during 2016 to 2019, while the increase was more substantial in RI, in particular in 2018 (an 87% increase from the previous year) (Appendix Table A1). The increase was usually associated with the establishment of new OEND programs (or operating sites), or increased volume of naloxone kits distributed from existing programs. The scatter plots indicated a general lack of significant correlations between the rate of opioid overdose death and the rate of naloxone kits distributed by OEND programs in most of the same-year (Figure 2) and time-lagged (Figure A1) analyses, with no discernible changes over time. However, we identified potential weak positive correlations between the two rates in 2016 and between the rate of opioid overdose death in 2016 and rate of naloxone kits in 2017, which suggests that the observed amount of opioid overdose fatalities might, to some extent, have impacted naloxone distribution in initial years of the observation period.
Figure 2. Scatter plot comparing the annual rate of naloxone kits distributed through OEND programs and rate of opioid overdose deaths per 100,000 residents in the same year in Massachusetts and Rhode Island, 2016-2019.
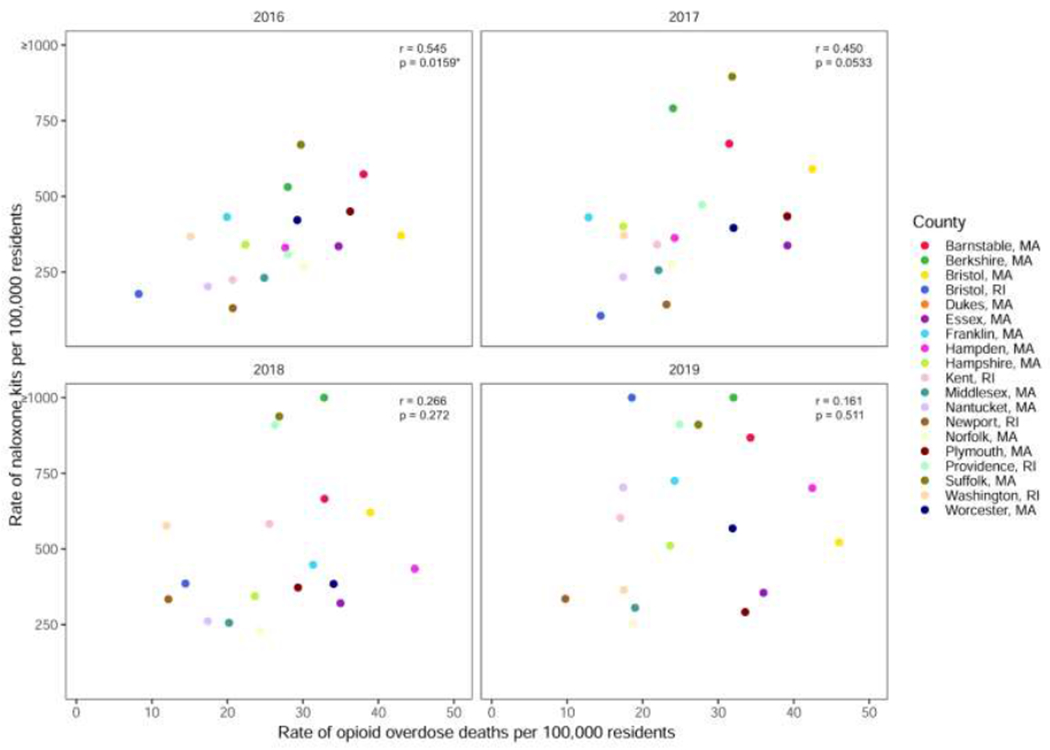
r: Pearson correlation coefficient; p: p-value for Pearson correlation coefficient. Rates of naloxone kits greater than 1,000 per 100,000 residents were censored at 1,000. Correlation analysis was based on uncensored data.
Figure 3 shows the dynamics and geographic variations in the estimated ratio of naloxone kits distributed through OEND programs per opioid overdose deaths. The overall ratio was found to be relatively higher and improving more rapidly in Rhode Island over time (from 11.8 in 2016 to 35.6 in 2019), whereas the ratio in Massachusetts was estimated to be lower and improving more moderately throughout the state (from 12.3 to 17.2), driven primarily by the slower increase in naloxone kits distributed. The three counties with the lowest naloxone kits per opioid overdose death ratio were Plymouth (from 12.4 to 8.7), Norfolk (from 8.8 to 13.6), and Essex (from 9.7 to 9.9), all in Massachusetts, while the ratio was highest in Suffolk, MA (from 22.6 to 33.3), Washington, RI (from 24.3 to 20.8) and Berkshire, MA (from 18.9 to 49.2) counties. While most counties present an upward trend in the ratio, there were some counties with declining or constant ratios over time, including Essex, MA (from 9.7 to 9.9), Plymouth, MA (from 12.4 to 8.7), and Washington, RI (from 24.3 to 20.8). We also identified potential urban/non-urban disparities in the naloxone kits per overdose death ratio, where the ratio remained relatively higher in Suffolk and Providence, counties encompassing the two major urban cities (Boston and Providence) in the two states (three-year average: 29.5 and 24.3, respectively), in comparison to the remainder of Massachusetts and Rhode Island (three-year average: 13.3). In 2019, 7 out of 19 counties, all in Massachusetts, had a naloxone kits to overdose deaths ratio below 20.
Figure 3. Dynamics of the ratio of naloxone kits distributed through OEND programs to opioid overdose deaths over time, Massachusetts and Rhode Island, 2016-2019.
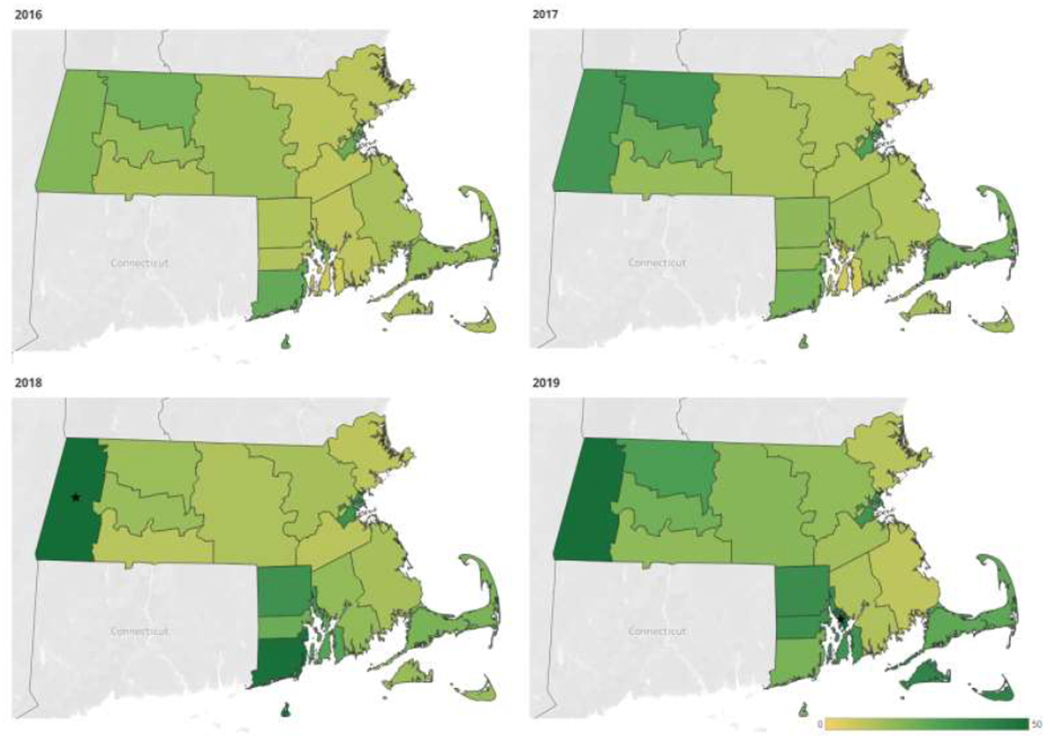
Range for the ratio: 6.2-56.2. Stars represent counties whose naloxone kits to opioid overdose deaths ratio are over 50.
Discussion
By mapping the rate of naloxone kits distributed through community-based OEND and opioid overdose deaths, as well as the ratio between the two, we identified differences in spatial patterns of naloxone availability and opioid overdose deaths, and these differences appeared to be widening in some counties between 2016 and 2019. The lack of a consistent association between the two rates may indicate that the current OEND naloxone distribution strategies may not fully correspond to the burden of opioid overdose deaths except in the initial years of our observation period. This is likely due to the constantly evolving opioid epidemic, and in particular the surge in fentanyl-involved overdoses in recent years, which may require new measures to help identify and address the emerging “hotspot” communities. Using community-based naloxone and opioid overdose death data in Massachusetts and Rhode Island, we presented a case for identifying target communities for expanded OEND based on a metric of the ratio of naloxone kits per opioid overdose death.
Massachusetts and Rhode Island have made substantial progress in increasing access to naloxone. Both states have among the highest rates of naloxone dispensation in the country (Guy Jr, et al., 2019), and both have long histories of community-based OEND programs. In 2006, Massachusetts and Rhode Island were among the first states in the US to establish pilot community-based OEND programs (Clark, et al., 2014; Doe-Simkins, Walley, Epstein, & Moyer, 2009; Walley, et al., 2013; Yokell, Green, Bowman, McKenzie, & Rich, 2011). As of 2021, there are 21 agencies providing community-based OEND programs across Massachusetts in over 40 municipalities and all counties (Massachusetts Department of Public Health), and 15 across Rhode Island (PreventOverdoseRI). Several of the states’ community-based OEND programs are peer-based or offer recovery services. Progressive state legislation has also facilitated the scale-up of naloxone distribution in both states, including naloxone dispensation under standing orders, pharmacy-based naloxone access, and Good Samaritan Laws (McClellan, et al., 2018; Pollini, et al., 2020). Community-based OEND programs in the two states serve a variety of population groups, including individuals and their families who are affected by or at risk for HIV infection, individuals with substance use disorder, incarcerated individuals, individuals accessing syringe service programs, and those within the broader social network (Bagley, Forman, Ruiz, Cranston, & Walley, 2018; Doe-Simkins, et al., 2009; Lim, et al., 2019; Walley, et al., 2013). While existing OEND programs have been highly successful—distributing several thousand naloxone doses each year and documenting hundreds of overdose rescues—the results of this analysis shows that even in states with robust, longstanding OEND programs, the needs of some communities may be insufficiently addressed. Additional analytical tools that leverage the best available data to inform targeted naloxone distribution strategies are needed and should be used to complement existing strategies to optimize OEND program resource allocation and impact.
The ratio of naloxone kits distributed through OEND programs per opioid overdose death might serve as a key indicator for naloxone availability in a given region and guide OEND naloxone distribution efforts. For settings with more frequent and timely data collection, this ratio can also be calculated on a monthly or quarterly basis to facilitate more rapid response to any emerging trends, although any underlying seasonal variations should also be accounted for. We note that in interpreting the results, the ratio itself does not provide any explicit criteria for what constitutes an optimal level for naloxone distribution; however, the relative differences between regions can help identify geographic gaps, while the directionality of the metric over time can serve as indicators of improvement or deterioration, in that higher ratios indicate greater naloxone distribution, fewer opioid overdose deaths, or a combination of both. Finally, one notable strength of this approach is that the data used to calculate the ratio are routinely collected in many settings, and the calculation is conceptually intuitive and easy to implement. However, a few limitations of this ratio-based approach should be noted for future investigation. First, this ratio may only reflect overall naloxone availability, neglecting to capture the actual demand within given subpopulations or overdose settings, and thus, this approach is unable to inform detailed recommendations for resource allocation, such as which distribution programs to expand or which sociodemographic populations to target. This limitation is particularly important to explore further to ensure equitable naloxone access for historically-excluded racial and ethnic groups, which have been disproportionately affected by heroin overdose deaths, and more recently, the surge in fentanyl-involved overdose deaths (Lippold & Ali, 2020). Second, a combined ratio of community program naloxone and retail pharmacy naloxone to overdose deaths should be examined. Community- and pharmacy-distributed naloxone are allocated to overlapping yet distinct populations, with community-based programs likely serving individuals at greater overdose risk. Nonetheless, both settings have the potential to increase overdose rescues, and the ratio-based approach outlined herein may be strengthened by considering both naloxone distribution sources. Third, we do not yet know the optimal ratio of naloxone kits distributed to opioid overdose deaths. While Bird et al. have recommended a target ratio of 20 (Bird, et al., 2015), this target was based on the lethality of heroin overdoses in Scotland, whereas in Massachusetts and Rhode Island, fentanyl is the primary driver of overdose deaths in recent years. Illicitly manufactured fentanyl may be more potent than heroin and appears at variable potency in powder and pill forms in the drug supply presently. Moreover, the chemical properties of illicitly manufactured fentanyl and some fentanyl analogs suggest that more naloxone (i.e., higher doses or administered over a longer period of observation) may be required to prevent fatal opioid overdose.(Carpenter, et al., 2020) Therefore, a higher naloxone distribution target, compared to that for Scotland, may be warranted. Alternatively, the target could be based on the prevalence of OUD, such as one kit per person with OUD per year; this would translate to approximately 5,000 kits per 100,000 population in Massachusetts and Rhode Island given the estimated 5% prevalence of OUD. However, this target relies on estimates for OUD prevalence that are sometimes unavailable, does not capture other populations at risk for opioid overdose (e.g., persons using fentanyl-contaminated stimulants), and may be influenced by variation in data quality and estimation methods.
Developing more sophisticated decision-analytical tools beyond this ratio may be needed to address challenges that are inherent to changing dynamics of the opioid overdose epidemic and other local initiatives. Simulation models can quantify the potential public health and economic effects of multiple health interventions, accounting for local context and heterogeneity across populations and program settings (Zang, et al., 2020). A simulation modeling approach would allow investigators to evaluate both the epidemiological and economic impact of a variety of existing OEND program types. This approach could be particularly useful in providing objective, localized evidence to prioritize future OEND program expansions by exploring varied resource allocation schemas according to the greatest public health and health equity benefits. Additionally, simulation modeling can permit evaluation of effectiveness in combination with other initiatives that decrease fatal opioid overdoses, such as expanded access to medications for OUD, safer consumption spaces, and pharmacy-based naloxone distribution programs to inform more comprehensive overdose reduction solutions (Linas, et al., 2021). However, developing and implementing simulation modeling to explore optimal community-level naloxone distribution strategies may require a greater amount and variety of data, which could pose challenges for settings with limited resources.
This study may have several additional limitations. First, we used the number of fatal opioid overdoses (rather than all fatal and non-fatal opioid overdoses, or the population at risk for overdose) as an indicator for naloxone demand in assessing naloxone availability. Non-fatal opioid overdoses are typically underreported or unavailable at the local level (Keen, et al., 2021); meanwhile, data on the prevalence of OUD are often estimated only at the state level, and are not regularly updated. Second, we aggregated data for naloxone distribution and opioid overdose deaths according to the individual’s county of residence, whereas the use of a naloxone kit or an overdose death could occur in a different location. Meanwhile, increased naloxone distribution in one area does not always translate to increased naloxone use in a witnessed overdose event. These may contribute to biases in the estimation of naloxone availability in a region. Developing more effective OEND strategies should target individuals at high risk of experiencing or witnessing an overdose (Wood, et al., 2021). Third, the two states differed in the inclusion of intentional opioid overdose deaths, but intentional cases made up less than 5% of all opioid overdose deaths (Hempstead & Phillips, 2019; Olfson, Rossen, Wall, Houry, & Blanco, 2019) and should not significantly affect the findings of this study. Forth, the ongoing COVID-19 pandemic may have profoundly impacted the opioid epidemic but was not captured in our analysis due to data unavailability during 2020. Fifth, to avoid small (or zero) counts in less populated regions and associated biases, we aggregated data at the county level; however, county-level aggregation may fail to capture the correlation between opioid overdose deaths and naloxone kits at smaller geographical units (i.e., the city/town level). Sixth, this study focused on community-based naloxone distribution only while pharmacy and hospital-provided naloxone kits were excluded from this analysis. This may result in an underestimated availability of all naloxone rescue kits to laypeople. Last, although we have no reason to expect that the quality and consistency of the naloxone data reporting would differ across the two states, it is possible that such differences, if present, may have affected our results.
In summary, we found variations in spatial patterns of opioid overdose fatalities and naloxone distribution and identified several key areas with low naloxone availability based on ratios of naloxone rescue kits per opioid overdose death. Developing and deploying decision-analytic models to inform more meticulous naloxone distribution decisions will be critical to optimize resources to prevent opioid overdose fatalities.
Supplementary Material
Acknowledgements
We thank Jeffrey Bratberg, Jennifer Koziol, and Audrey Lambert for providing data access and valuable feedback on the manuscript.
Funding
This work was supported by the National Institutes on Drug Abuse (grant number U01DA047408, PI: BRS and BDLM). The funder had no role in study design, data analysis, or decision to publish.
Footnotes
Publisher's Disclaimer: This is a PDF file of an unedited manuscript that has been accepted for publication. As a service to our customers we are providing this early version of the manuscript. The manuscript will undergo copyediting, typesetting, and review of the resulting proof before it is published in its final form. Please note that during the production process errors may be discovered which could affect the content, and all legal disclaimers that apply to the journal pertain.
Declaration and ethics
This study was deemed exempt by Brown University, Rhode Island Department of Health, Boston University Medical Campus, and Massachusetts Department of Public Health Institutional Review Boards, as this work involved analysis of aggregate and/or publicly available data.
Publisher's Disclaimer: Disclaimer
Data from this study were obtained through an approved data request to the Rhode Island Department of Health (RIDOH) the Massachusetts Department of Public Health (MDPH). Data was obtained from January 2016 through to December 2019. RIDOH and MDPH are not responsible for any analyses, opinions, or conclusions contained in this document. The views expressed in this report are those of the authors and do not represent the official positions or policy of the RIDOH and MDPH.
Declaration of interests
The authors have no conflicts of interest to declare
References
- Acharya M, Chopra D, Hayes CJ, Teeter B, & Martin BC (2020). Cost-Effectiveness of Intranasal Naloxone Distribution to High-Risk Prescription Opioid Users. Value in Health. [DOI] [PubMed] [Google Scholar]
- Alexander GC, Stoller KB, Haffajee RL, & Saloner B (2020). An epidemic in the midst of a pandemic: opioid use disorder and COVID-19. In: American College of Physicians. [DOI] [PMC free article] [PubMed] [Google Scholar]
- American Community Survey. Demongraphic and housing estimates, Massachusetts, 2018. Retrieved October 18 2020 from https://data.census.gov/cedsci/table?q=DP05%3A%20SELECTED%20HOUSING%20CHARACTERISTICS%20IN%20THE%20UNITED%20STATES&g=0400000US25.50015&tid=ACSDP1Y2018.DP05&hidePreview=true. [Google Scholar]
- American Community Survey. Demongraphic and housing estimates, Rhode Island, 2018. Retrieved October 18 2020 from https://data.census.gov/cedsci/table?q=DP05%3A%20SELECTED%20HOUSING%20CHARACTERISTICS%20IN%20THE%20UNITED%20STATES&g=0400000US44.50015&tid=ACSDP1Y2018.DP05&hidePreview=true. [Google Scholar]
- Antoniou T, McCormack D, Campbell T, Sutradhar R, Tadrous M, Lum-Wilson N, Leece P, Munro C, & Gomes T (2020). Geographic variation in the provision of naloxone by pharmacies in Ontario, Canada: A population-based small area variation analysis. Drug Alcohol Depend, 216, 108238. [DOI] [PubMed] [Google Scholar]
- Bagley SM, Forman LS, Ruiz S, Cranston K, & Walley AY (2018). Expanding access to naloxone for family members: The Massachusetts experience. Drug and alcohol review, 37, 480–486. [DOI] [PubMed] [Google Scholar]
- Barocas JA, White LF, Wang J, Walley AY, LaRochelle MR, Bernson D, Land T, Morgan JR, Samet JH, & Linas BP (2018). Estimated prevalence of opioid use disorder in Massachusetts, 2011–2015: A capture–recapture analysis. Am J Public Health, 108, 1675–1681. [DOI] [PMC free article] [PubMed] [Google Scholar]
- Becker WC, & Fiellin DA (2020). When Epidemics Collide: Coronavirus Disease 2019 (COVID-19) and the Opioid Crisis. Ann Intern Med, 173, 59–60. [DOI] [PMC free article] [PubMed] [Google Scholar]
- Bird SM, McAuley A, Perry S, & Hunter C (2016). Effectiveness of Scotland’s National Naloxone Programme for reducing opioid-related deaths: a before (2006–10) versus after (2011–13) comparison. Addiction, 111, 883–891. [DOI] [PMC free article] [PubMed] [Google Scholar]
- Bird SM, Parmar MK, & Strang J (2015). Take-home naloxone to prevent fatalities from opiate-overdose: protocol for Scotland’s public health policy evaluation, and a new measure to assess impact. Drugs: education, prevention and policy, 22, 66–76. [DOI] [PMC free article] [PubMed] [Google Scholar]
- Carpenter J, Murray BP, Atti S, Moran TP, Yancey A, & Morgan B (2020). Naloxone dosing after opioid overdose in the era of illicitly manufactured fentanyl. Journal of Medical Toxicology, 16, 41–48. [DOI] [PMC free article] [PubMed] [Google Scholar]
- CDC. (2020). Centers for Disease Control Prevention. Increase in fatal drug overdoses across the United States driven by synthetic opioids before and during the COVID-19 pandemic. CDC Health Alert Network. [Google Scholar]
- Ciccarone D (2021). The rise of illicit fentanyls, stimulants and the fourth wave of the opioid overdose crisis. Current Opinion in Psychiatry, 34, 344–350. [DOI] [PMC free article] [PubMed] [Google Scholar]
- Clark AK, Wilder CM, & Winstanley EL (2014). A systematic review of community opioid overdose prevention and naloxone distribution programs. Journal of addiction medicine, 8, 153–163. [DOI] [PubMed] [Google Scholar]
- Coffin PO, & Sullivan SD (2013). Cost-effectiveness of distributing naloxone to heroin users for lay overdose reversal. Ann Intern Med, 158, 1–9. [DOI] [PubMed] [Google Scholar]
- Dodson ZM, Enki Yoo E-H, Martin-Gill C, & Roth R (2018). Spatial methods to enhance public health surveillance and resource deployment in the opioid epidemic. Am J Public Health, 108, 1191–1196. [DOI] [PMC free article] [PubMed] [Google Scholar]
- Doe-Simkins M, Walley AY, Epstein A, & Moyer P (2009). Saved by the nose: bystander-administered intranasal naloxone hydrochloride for opioid overdose. American journal of public health, 99, 788–791. [DOI] [PMC free article] [PubMed] [Google Scholar]
- Faust JS, Krumholz HM, Du C, Mayes KD, Lin Z, Gilman C, & Walensky RP (2021). All-cause excess mortality and COVID-19–related mortality among US adults aged 25-44 years, March-July 2020. JAMA, 325, 785–787. [DOI] [PMC free article] [PubMed] [Google Scholar]
- Giglio RE, Li G, & DiMaggio CJ (2015). Effectiveness of bystander naloxone administration and overdose education programs: a meta-analysis. Injury epidemiology, 2, 10. [DOI] [PMC free article] [PubMed] [Google Scholar]
- Gomes T, Tadrous M, Mamdani MM, Paterson JM, & Juurlink DN (2018). The burden of opioid-related mortality in the United States. JAMA Netw Open, 1, e180217–e180217. [DOI] [PMC free article] [PubMed] [Google Scholar]
- Guy GP Jr, Haegerich TM, Evans ME, Losby JL, Young R, & Jones CM (2019). Vital signs: pharmacy-based naloxone dispensing—United States, 2012–2018. Morbidity and Mortality Weekly Report, 68, 679. [DOI] [PMC free article] [PubMed] [Google Scholar]
- Hedegaard H, Miniño AM, & Warner M Drug Overdose Deaths in the United States, 1999-2019. NCHS Data Brief, no 394. Hyattsville, MD: National Center for Health Statistics. Retrieved December 28 2020 from https://www.cdc.gov/nchs/data/databriefs/db394-H.pdf. [Google Scholar]
- Hempstead K, & Phillips J (2019). Divergence in recent trends in deaths from intentional and unintentional poisoning. Health Affairs, 38, 29–35. [DOI] [PubMed] [Google Scholar]
- Jalal H, Buchanich JM, Roberts MS, Balmert LC, Zhang K, & Burke DS (2018). Changing dynamics of the drug overdose epidemic in the United States from 1979 through 2016. Science, 361. [DOI] [PMC free article] [PubMed] [Google Scholar]
- Keen C, Kinner SA, Young JT, Snow K, Zhao B, Gan W, & Slaunwhite AK (2021). Periods of altered risk for non-fatal drug overdose: a self-controlled case series. The Lancet Public Health, 6, e249–e259. [DOI] [PubMed] [Google Scholar]
- KFF. Henry J Kaiser Family Foundation. Opioid overdose death rates and all drug overdose death rates per 100,000 population (age-adjusted). Retrieved May 12 2020 from https://www.kff.org/other/state-indicator/opioid-overdose-death-rates/?currentTimeframe=0&sortModel=%7B%22colld%22:%22Location%22,%22sort%22:%22asc%22%7D.
- Khatri UG, & Perrone J (2020). Opioid Use Disorder and COVID-19: Crashing of the Crises. Journal of addiction medicine. [DOI] [PMC free article] [PubMed] [Google Scholar]
- Lambdin BH, Bluthenthal RN, Wenger LD, Wheeler E, Garner B, Lakosky P, & Kral AH (2020). Overdose Education and Naloxone Distribution Within Syringe Service Programs—United States, 2019. Morbidity and Mortality Weekly Report, 69, 1117. [DOI] [PMC free article] [PubMed] [Google Scholar]
- Lim JK, Forman LS, Ruiz S, Xuan Z, Callis BP, Cranston K, & Walley AY (2019). Factors associated with help seeking by community responders trained in overdose prevention and naloxone administration in Massachusetts. Drug and alcohol dependence, 204, 107531. [DOI] [PubMed] [Google Scholar]
- Linas BP, Savinkina A, Madushani R, Wang J, Yazdi GE, Chatterjee A, Walley AY, Morgan JR, Epstein RL, & Assoumou SA (2021). Projected Estimates of Opioid Mortality After Community-Level Interventions. JAMA Netw Open, 4, e2037259–e2037259. [DOI] [PMC free article] [PubMed] [Google Scholar]
- Lippold K, & Ali B (2020). Racial/ethnic differences in opioid-involved overdose deaths across metropolitan and non-metropolitan areas in the United States, 1999–2017. Drug Alcohol Depend, 212, 108059. [DOI] [PubMed] [Google Scholar]
- Manchester J, & Sullivan R (2019). Exploring causes of and responses to the opioid epidemic in New England. New England Public Policy Center Policy Reports Paper. [Google Scholar]
- Massachusetts Department of Public Health. Overdose education and naloxone distribution, information and program contact sheet. Retrieved July 15 2021 from https://www.mass.gov/doc/dph-oend-programs-english-pdf/download.
- McClellan C, Lambdin BH, Ali MM, Mutter R, Davis CS, Wheeler E, Pemberton M, & Kral AH (2018). Opioid-overdose laws association with opioid use and overdose mortality. Addictive behaviors, 86, 90–95. [DOI] [PubMed] [Google Scholar]
- McDonald R, & Strang J (2016). Are take-home naloxone programmes effective? Systematic review utilizing application of the Bradford Hill criteria. Addiction, 111, 1177–1187. [DOI] [PMC free article] [PubMed] [Google Scholar]
- Olfson M, Rossen LM, Wall MM, Houry D, & Blanco C (2019). Trends in intentional and unintentional opioid overdose deaths in the United States, 2000-2017. Jama, 322, 2340–2342. [DOI] [PMC free article] [PubMed] [Google Scholar]
- Pollini RA, Joyce R, Ozga-Hess JE, Xuan Z, Green TC, & Walley AY (2020). Assessing pharmacy-based naloxone access using an innovative purchase trial methodology. Journal of the American Pharmacists Association, 60, 853–860. [DOI] [PMC free article] [PubMed] [Google Scholar]
- PreventOverdoseRI. Get Naloxone, Rhode Island. Retrieved July 22 2021 from https://preventoverdoseri.org/get-naloxone/. [Google Scholar]
- Slavova S, Rock P, Bush HM, Quesinberry D, & Walsh SL (2020). Signal of increased opioid overdose during COVID-19 from emergency medical services data. Drug Alcohol Depend, 214, 108176. [DOI] [PMC free article] [PubMed] [Google Scholar]
- Townsend T, Blostein F, Doan T, Madson-Olson S, Galecki P, & Hutton DW (2020). Cost-effectiveness analysis of alternative naloxone distribution strategies: First responder and lay distribution in the United States. International Journal of Drug Policy, 75, 102536. [DOI] [PubMed] [Google Scholar]
- US Department of Health, & Human Services. (2015). Opioid abuse in the United States and Department of Health and Human Services actions to address opioid-drug-related overdoses and deaths. Journal of pain & palliative care pharmacotherapy, 29, 133–139. [DOI] [PubMed] [Google Scholar]
- Walley AY, Xuan Z, Hackman HH, Quinn E, Doe-Simkins M, Sorensen-Alawad A, Ruiz S, & Ozonoff A (2013). Opioid overdose rates and implementation of overdose education and nasal naloxone distribution in Massachusetts: interrupted time series analysis. Bmj, 346. [DOI] [PMC free article] [PubMed] [Google Scholar]
- Wilson N (2020). Drug and Opioid-Involved Overdose Deaths—United States, 2017–2018. MMWR Morb Mortal Wkly Rep, 69. [DOI] [PMC free article] [PubMed] [Google Scholar]
- Wood CA, Green L, La Manna A, Phillips S, Werner KB, Winograd RP, & Stuckenschneider A (2021). Balancing need and risk, supply and demand: Developing a tool to prioritize naloxone distribution. Substance Abuse, 1–9. [DOI] [PubMed] [Google Scholar]
- Yedinak JL, Goedel WC, Paull K, Lebeau R, Krieger MS, Thompson C, Buchanan AL, Coderre T, Boss R, & Rich JD (2019). Defining a recovery-oriented cascade of care for opioid use disorder: A community-driven, statewide cross-sectional assessment. PLoS Med, 16, e1002963. [DOI] [PMC free article] [PubMed] [Google Scholar]
- Yokell MA, Green TC, Bowman S, McKenzie M, & Rich JD (2011). Opioid overdose prevention and naloxone distribution in Rhode Island. Medicine and Health, Rhode Island, 94, 240. [PMC free article] [PubMed] [Google Scholar]
- Zang X, Krebs E, Min JE, Pandya A, Marshall BD, Schackman BR, Behrends CN, Feaster DJ, & Nosyk B (2020). Development and calibration of a dynamic HIV transmission model for 6 US cities. Medical Decision Making, 40, 3–16. [DOI] [PMC free article] [PubMed] [Google Scholar]
Associated Data
This section collects any data citations, data availability statements, or supplementary materials included in this article.