

Summary
Secreted polypeptides represent a fundamental axis of intercellular communication. Here, we present a protocol for the cell type-specific biotinylation, enrichment, and proteomic profiling of secreted plasma proteins directly in mice. This protocol uses conditional “turn-on” adeno-associated viruses expressing an endoplasmic reticulum-targeted biotin ligase to globally biotinylate proteins of the secretory pathway in a cell type-specific manner. Biotinylated secreted proteins can be directly purified from blood plasma and analyzed by SDS-PAGE gel or shotgun proteomics.
For complete information on the generation and use of this protocol, please refer to Wei et al. (2021).
Subject areas: Cell Biology, Model Organisms, Protein Biochemistry, Proteomics, Mass Spectrometry, Systems biology, Biotechnology and bioengineering
Graphical abstract

Highlights
-
•
Protocol for cell type-specific biotinylation of secreted proteins directly in mice
-
•
Secreted proteins can be directly enriched from blood and profiled by proteomics
-
•
This protocol is applicable to any cell type for which a Cre mouse line is available
Secreted polypeptides represent a fundamental axis of intercellular communication. Here, we present a protocol for the cell type-specific biotinylation, enrichment, and proteomic profiling of secreted plasma proteins directly in mice. This protocol uses conditional “turn-on” adeno-associated viruses expressing an endoplasmic reticulum-targeted biotin ligase to globally biotinylate proteins of the secretory pathway in a cell type-specific manner. Biotinylated secreted proteins can be directly purified from blood plasma and analyzed by SDS-PAGE gel or shotgun proteomics.
Before you begin
This protocol below describes the specific steps for proteomic profiling of the classical secretome (e.g., proteins conventionally secreted via the ER/Golgi pathway) from hepatocytes. This protocol can also be applied to profile in vivo secretomes from other cell types by transduction of the appropriate mouse Cre driver lines with the same conditional adeno-associated virus (AAV).
Plasmid preparation and AAV production
Timing: 6–8 weeks
-
1.
Acquire plasmid pAAV-FLEX-ER-TurboID (Addgene ID 160857) or send reagent requests to the lead contact.
-
2.Prepare AAV Plasmid
-
a.Transform pAAV-FLEX-ER-TurboID plasmid into competent Top10 bacteria cells.
-
b.Incubate transformed bacteria on a shaker at 37°C overnight (12–16 h) in 500 mL LB culture supplemented with ampicillin.
-
c.Maxiprep plasmid using an endotoxin-free Qiagen Maxiprep kit (Qiagen 12362)
-
d.Confirm the coding sequence by sanger sequencing using primers pENN forward and reverse (primer sequences provided key resources table).
-
e.To confirm intact AAV plasmid, perform a double restriction digest with EcoRI/HindIII to excise the coding insert. Perform a SmaI digest to confirm intact ITRs. Also load uncut plasmid to show that more than 80% of plasmid is in supercoil form (Figure 1).
-
a.
-
3.Produce AAV expressing FLEX-ER-TurboID
-
a.Send endotoxin-free Maxiprep of pAAV-FLEX-ER-TurboID to the Penn Vector Core for production of AAV (serotype AAV8, small scale). This scale should be sufficient to produce a virus for ∼100 mice.
-
b.Upon receipt of the virus, freeze purified AAVs in 100 μL aliquots to prevent multiple freeze-and-thaw cycles. Purified AAV can be stably stored in −80°C for a few years.
-
a.
Note: We recommend choosing an AAV serotype according to the specific cell type to be transduced. AAV8 was selected here because of robust and broad transduction of hepatocytes that can be observed with this serotype.
-
4.
Acquire hepatocyte-specific homozygous Cre mouse driver line (Jackson Stock 003574) and breed with female C57BL/6J mice (Jackson Stock 000664) to generate hemizygous Albumin-Cre mice.
Note: To profile in vivo secretomes from additional cell types, choose an appropriate and validated Cre mouse driver that expresses Cre recombinase in your cell type of interest.
Figure 1.

Agarose gel of pAAV-FLEX-ER-TurboID plasmid diagnostic digests using the indicated restriction enzymes
Animal protocols and maintenance
Perform all animal experiments according to procedures approved by academic institutions. All procedures described here were approved by the Stanford University Administrative Panel on Laboratory Animal Care (APLAC). Maintain mice in 12 h light-dark cycles at 22°C and ∼50% relative humidity. Feed mice a standard irradiated rodent chow diet.
Key resources table
| REAGENT or RESOURCE | SOURCE | IDENTIFIER |
|---|---|---|
| Antibodies | ||
| Anti-V5 antibody (1:1000 dilution) | Invitrogen | R960-25 |
| Anti-beta Actin (1:1000 dilution) | Abcam | ab8227 |
| Anti-mouse IgG IRDye 680RD (1:10000 dilution) | LI-COR Biosciences | 925-68070 |
| Anti-rabbit IgG IRDye 800RD (1:10000 dilution) | LI-COR Biosciences | 926-32211 |
| Anti-biotin Streptavidin AlexaFluor680 (1:1000 dilution) | Thermo Fisher Scientific | S32358 |
| Recombinant DNA | ||
| pAAV-FLEx-ER-TurboID plasmid | Addgene | 160857 |
| Chemicals, peptides, and recombinant proteins | ||
| Biotin | Sigma-Aldrich | B4501-1G |
| DTT | Sigma-Aldrich | D0632-1G |
| Sodium azide | Sigma-Aldrich | S2002-25G |
| Sodium chloride | Sigma-Aldrich | S9888-500G |
| Sodium deoxycholate | Sigma-Aldrich | D6750-100G |
| Sodium dodecyl sulfate | Thermo Fisher Scientific | BP166-500 |
| Sodium carbonate | Thermo Fisher Scientific | S263-500 |
| Sodium bicarbonate | Thermo Fisher Scientific | 187508 |
| Sodium ascorbate | Thermo Fisher Scientific | A0539500G |
| Dimethyl sulfoxide | Sigma-Aldrich | D8418-100ML |
| Potassium chloride | Sigma-Aldrich | P3911-500G |
| EDTA | Sigma-Aldrich | E9884-100G |
| Tris-HCl | Sigma-Aldrich | 1185-53-1 |
| Acetonitrile | Thermo Fisher Scientific | A998-4 |
| HALT protease inhibitor | Thermo Fisher Scientific | 78429 |
| NP-40 alternative | Merck Millipore | 492016-100ML |
| Chloroform | Thermo Fisher Scientific | C607-4 |
| Ponceau S solution | Sigma-Aldrich | P7170-1L |
| NuPAGE MOPS SDS Running Buffer (20×) | Invitrogen | NP0001-02 |
| NuPAGE 4-12% Bis-Tris Protein Gels, 1.0 mm, 15-well | Thermo Fisher Scientific | NP0323BOX |
| Odyssey blocking buffer | LI-COR Biosciences | 927-50000 |
| Seeblue plus 2 protein ladder | Thermo Fisher Scientific | LC5925 |
| NuPAGE™ LDS Sample Buffer (4×) | Thermo Fisher Scientific | NP0008 |
| Urea | Sigma-Aldrich | 31K0038 |
| Acetone | Thermo Fisher Scientific | A184 |
| Formic acid | Thermo Fisher Scientific | A117-50 |
| Phosphoric acid | Sigma-Aldrich | 345245-100ML |
| Trolox | Sigma-Aldrich | 648471-500MG |
| 0.9% saline solution | Teknova | S5825 |
| TEAB solution (1M) | Sigma-Aldrich | T7408-100ML |
| Kolliphor EL | Sigma-Aldrich | C5135-500G |
| Trypsin | Promega | V5113 |
| Iodoacetamide | Sigma-Aldrich | A3221 |
| Critical commercial assays | ||
| SilverQuest™ Silver Staining Kit | Thermo Fisher Scientific | LC6070 |
| Trans-blot turbo RTA transfer kit, nitrocellulose | Bio-Rad Laboratories | 1704271 |
| Experimental models: Organisms/strains | ||
| C57BL/6J (M. musculus) | The Jackson Laboratory | 000664 |
| Albumin-Cre mice | The Jackson Laboratory | 003574 |
| Bacterial and virus strains | ||
| One Shot™ TOP10 Chemically Competent E. coli | Invitrogen | C404010 |
| Oligonucleotides | ||
| pENN forward: gcctctgctaaccatgttcatg | Integrated DNA Technologies | N/A |
| pENN reverse: gcagcgtatccacatag | Integrated DNA Technologies | N/A |
| Deposited data | ||
| Proteomic data | This study | ProteomeXchange: PXD021602 |
| Processed proteomic datasets | Wei et al. (2021) | N/A |
| Other | ||
| 3 kDa Molecular Weight Cutoff Filter | Amicon | UFC9003 |
| EcoRI | New England Biolabs | R0101S |
| HindIII | New England Biolabs | R0104S |
| SmaI | New England Biolabs | R0141S |
| S-Trap™ micro columns | ProtiFi | C02-micro-40 |
| Exel International Insulin Syringes | Thermo Fisher Scientific | 14-841-32 |
| lithium heparin tube | BD | 365985 |
| PrecisionGlide Needle 21G | BD | 305129 |
| Exel International Insulin Syringes 29G | Exel International | 14-841-32 |
| Tailveiner Restrainer for Mice | BRAINTREE SCIENTIFIC, INC. | TV-150 STD |
| Streptavidin magnetic beads | Thermo Fisher Scientific | 65601 |
| Bulk tubes | Thermo Fisher Scientific | 15340162 |
| Metal Bulk Beads | Thermo Fisher Scientific | 15340158 |
| Benchmark BeadBlaster Homogenizer | Thermo Fisher Scientific | 15-340-163 |
| Orbitrap Fusion Tribrid Mass Spectrometer | Thermo Fisher Scientific | N/A |
| NanoDrop Spectrophotometer | Thermo Fisher Scientific | ND-ONE-W |
| Dionex UltiMate 3000 RPLCnano system | Thermo Fisher Scientific | N/A |
| Acclaim PepMap 100 C18, 5-μm particles | Thermo Fisher Scientific | 164213 |
| Acclaim™ PepMap™ 100 C18 HPLC Columns (75 μm, packed with 2-μm, 100-Å) | Thermo Fisher Scientific | 164942 |
Materials and equipment
RIPA buffer (store at 4°C for up to one year)
| Reagent | Final concentration | Amount |
|---|---|---|
| NP40 | 1% | 5 mL |
| Sodium dodecyl sulfate | 0.1% (w/v) | 0.5 g |
| Sodium deoxycholate | 0.5% (w/v) | 2.5 g |
| PBS | / | Fill up to 500 mL |
Washing buffer (store at 4°C for up to 6 months)
| Reagent | Final concentration | Amount |
|---|---|---|
| Tris-HCl | 50 mM | 6 g |
| NP40 | 1% | 10 mL |
| Sodium dodecyl sulfate | 0.1% (w/v) | 1 g |
| Sodium chloride | 150 mM | 8.77 g |
| Sodium deoxycholate | 0.5% (w/v) | 2.5 g |
| Sodium ascorbate | 10 mM | 1.98 g |
| EDTA | 1 mM | 0.29 g |
| HALT protease inhibitor (add upon use) | 1× | 10 mL (100×) |
| Trolox | 5 mM | 1.25 g |
| Sodium azide | 10 mM | 0.65 g |
| PBS | / | Fill up to 1000 mL |
KCl solution (store at 22°C–25°C for up to one year)
| Reagent | Final concentration | Amount |
|---|---|---|
| KCl | 1M | 37.28 g |
| PBS | / | Fill up to 500 mL |
Na2CO3 solution (store at 22°C–25°C for up to one year)
| Reagent | Final concentration | Amount |
|---|---|---|
| Na2CO3 | 0.1M | 5.3 g |
| PBS | / | Fill up to 500 mL |
Urea solution (PH=8.0, store at 22°C–25°C for up to one year)
| Reagent | Final concentration | Amount |
|---|---|---|
| Urea | 2M | 60 g |
| Tris-HCl | 10 mM | 0.6 g |
| PBS | / | Fill up to 500 mL and adjust PH to 8.0 |
Elution buffer (store at −80°C for up to 6 months)
| Reagent | Final concentration | Amount |
|---|---|---|
| Biotin | 4 mM | 48.9 mg |
| DTT | 20 mM | 3.08 g |
| NuPAGE™ LDS Sample Buffer (4×) | 2× | 50 mL |
| PBS | / | Fill up to 100 mL |
Step-by-step method details
AAV transduction and biotinylation of secretomes in mice
The following steps describe the specific transduction of Albumin-Cre mice with pAAV-FLEX-ER-TurboID followed by biotinylation of the hepatocyte secretome. We recommend using wild-type C57BL/6J mice as negative control for background labeling. 3 to 5 mice per genotype should be used for viral transduction.
-
1.Transduce pAAV-FLEX-ER-TurboID into adult Albumin-Cre mice
-
a.Thaw aliquoted AAV on ice. Prepare AAV injection solution by diluting 1011 genome copies (GC) in saline in a total volume of 100 μL per mouse. We recommend making an extra solution for each mouse.Note: Higher dose, i.e., 1012 GC, of AAV may be used to achieve better viral transduction efficiency. We have found 1011 GC to be sufficient to label hepatocyte secretome in mice and higher dose to be more efficient for other cell types that are less frequently transduced by AAV.
-
b.Load 100 μL of the saline injection solution containing AAV into a 29G needle.
 CRITICAL: Make sure to empty air from the needle and not to spill AAV solution onto skin or eyes.
 -
c.Restrain 8–12 week old Albumin-Cre male mice using a Tailveiner Restrainer. The tail vein is exposed by pulling it by the tail through the slotted tube. Orient the mouse so that the head is away from you and the tail is pointing towards you. Use 70% ethanol to disinfect the tail.Optional: Use a mouse warmer lamp to help dilate the tail vein.
-
d.An ideal injection site is ∼2 cm away from the base of the tail (Methods video S1). Hold the tail taut at the approximate injection site with thumb above and forefinger below the tail. Visually identify the tail vein, which appears slightly darker in color relative to the tail. Insert the needle bevel up into the vein at an ∼15 degree angle to the skin. Inject the AAV solution into the vein over a period of 1–5 s (Figure 2).Note: Other routes of AAV administration may also be used here. For example, direct viral injections into the muscle or adipose has been successfully employed by others (Long et al., 2016; Zeng et al., 2019) to drive expression in these tissues. In this protocol we only describe systemic transduction via the tail vein.CRITICAL: No resistance should be felt during the injection if the needle is appropriately inserted into the tail vein. If resistance is felt, remove the needle and repeat the injection at a slightly different location ∼0.5 cm away from the initial injection site.
-
e.After injection, return mice to home cages for 2 weeks to allow for expression of the AAV.Note: Some conditional Cre-ER mouse drivers require administration of tamoxifen after viral transduction to turn on the expression of the ER-TurboID cassette. In this case, recombination can be induced two weeks after AAV injection by intraperitoneally injecting 2 mg tamoxifen powder dissolved in 100 μL corn oil for each mouse for 5 consecutive days. Return mice to home cages for 2 weeks to allow for expression of the AAV after the final tamoxifen injection.
 Pause point: AAV expression time can vary between 2 weeks to 6 weeks according to the experimental need.
-
a.
-
2.
Two weeks after AAV transduction, deliver biotin by drinking water using the following procedure: add 100 mg biotin to a mixture of 294 mL water and 6 mL DMSO. Heat the solution to 95°C for 20min to completely dissolve biotin. Cool down the biotin-supplemented water to room temperature (20°C–25°C) and provide it to micer in place of their normal drinking water for three consecutive days.
Note: The biotin water labeling period can be adjusted longer or shorter depending on experimental needs. We have not observed any differences in total water consumed between regular water and biotin-supplemented water. Biotin may form long crystals and precipitate in drinking water. If this happens, prepare fresh biotin-supplemented water every day.
Optional: Secretome labeling can also be accomplished by intraperitoneal injection of biotin. Prepare the biotin injection solution by dissolving biotin in a solution of 18:1:1 saline:Kolliphor EL:DMSO (by volume), 2.5 mg/mL. Heat solution at 95°C for 10 min to fully dissolve biotin. Once cool to room temperature, inject 200 μL per mouse per day using a 29G syringe for a final dose of 24 mg/kg biotin. Fresh intraperitoneal biotin injection solution should be delivered daily for three consecutive days but may vary according to the experimental needs. We have found strong biotinylation signals in the blood a few hours after a single intraperitoneal injection of biotin.
Figure 2.

Injection of AAV via tail vein
(A) Mouse restrainer and 29G syringe.
(B) Mouse tail vein position.
(C) Tail vein injection position.
Characterization of secretome labeling by SDS-PAGE gel
The following steps describe the protocol for gel-based characterization of biotinylated secretome.
-
3.Harvest blood plasma and liver tissue from Albumin-Cre mice and control wild-type C57BL/6J mice.
-
a.Preparation for liver and blood collection.
-
i.Prepare eppendorf tubes to collect tissues and lithium heparin tubes (BD, 365985) to collect mouse blood.
-
ii.Prepare dry ice to store liver tissues and wet ice to store blood.
-
iii.Prepare dissection scissors, tweezers, diapers and 70% ethanol.
-
i.
-
b.Perform a submandibular bleed to collect blood (JoVE Science Education Database and Lab Animal Research, 2021). Restrain the mouse by the scruff of the neck. Using a 21G needle, puncture the submandibular vein by insertion of the needle 1–2 mm into the cheek. The puncture site should be slightly behind the mandible, but in front of the ear canal (Figure 3). Use a lithium heparin tube to collect blood. When the flow of blood slows, repeat the same submandibular bleed procedure on the other cheek.
-
c.Centrifuge total blood (2,500×g, 5 min, 4°C). The supernatant is the blood plasma fraction. Freeze blood plasma on dry ice.Note: The plasma fraction should be pale yellow in color. If it becomes red, be cautious that the plasma has been contaminated with the red blood cell contents. Whole blood can also be stored on wet ice for up to 30 min prior to centrifugation. Approximately 100–500 μL plasma can be obtained per mouse.
-
d.Euthanize the mouse by CO2. Use ethanol to spray down the mouse abdomen and use dissection scissors and tweezers to open the intraperitoneal cavity. Excise the liver without the gallbladder. Freeze down the liver immediately in dry ice.Pause point: Plasma and liver samples can be stored in −80°C for a few years.
-
a.
Figure 3.

Blood plasma collection
(A) Puncture site for submandibular bleed.
(B) Example of successful blood collection into a lithium tube.
-
4.Prepare blood plasma and liver tissue for Western blot analysis.
-
a.For blood plasma, add 4 μL of blood plasma to a 20 μL 4× loading buffer. Then add PBS to 80 uL final volume.
-
b.For the liver, add 5 metal bulk beads and 500 μL RIPA buffer into a bulk tube. Add ∼100 mg liver tissue. Homogenize liver samples using a Benchmark BeadBlaster Homogenizer (40 s on 20 s off, 5 min, 4°C). Centrifuge (16,000×g, 10 min, 4°C), remove supernatant containing liver proteins, and quantify protein concentration using Nanodrop One. Add 400 μg proteins into a 20 μL 4× loading buffer and add PBS to the 80ul final volume.
-
c.Boil the blood and liver samples at 95°C for 10min and cool down to room temperature prior to loading on gel.
-
a.
Alternatives: The 4× sample loading buffer here may be replaced by home-made buffer using the following recipe: 2.0 mL 1M Tris-HCl pH 6.8, 0.8 g SDS, 4.0 mL 100% glycerol, 0.4 mL 14.7 M β-mercaptoethanol, 1.0 mL 0.5 M EDTA, 8 mg bromophenol Blue for making 10 mL buffer.
-
5.Perform Western blotting analysis to detect biotinylated proteins from blood plasma and liver.
-
a.Load 20 μL plasma or tissue samples into each well of a 4%–12% SDS-PAGE gel (approximately 100 μg protein/lane). Run at 120 V for 1.5 h.
-
b.Transfer the gel to the nitrocellulose membrane.
-
c.Block the membrane with a 5 mL Odyssey blocking buffer at room temperature for 30 min.
-
d.For detecting biotin labeling signals, incubate the membrane with 1:1000 streptavidin-Alexa Fluor 680 antibody at room temperature for 1 h or in the cold room overnight (12–24 h).
-
e.For detecting the expression of ER-TurboID, incubate the membrane with 1:1000 mouse anti-V5 in the cold room overnight (12–24 h), followed by 1:10000 anti-mouse IgG as the secondary antibody for 30 min.
-
f.For loading control of blood plasma, use POnceau S staining reagent to stain the nitrocellulose membrane and choose the region around 50kd across the blot for comparison. For loading control of the liver, use 1:1000 rabbit anti-mouse actin as the primary antibody and 1:10000 anti-rabbit IgG as the secondary antibody.
-
g.Image the blots at LI-COR gel imager (Figure 4).
-
a.
Alternatives: NuPAGE MOPS SDS Running Buffer (20×) may be replace by home-made buffer using the following recipe: 209.2 g MOPS, 121.2 g Tris base, 20 g SDS, 6 g EDTA (free acid) or 7.44 g disodium EDTA for making 1 L buffer.
Note: The intensity of biotin signals on a gel can be variable and dependent on the cell types transduced. For parenchymal cells of an organ, e.g., hepatocytes in the liver, biotin signals are very strong in both tissue and plasma levels by western blotting. However, for some other cell types, e.g., endothelial cells and immune cells, biotin signals are generally weak in both tissue and plasma levels by western blotting. To obtain higher sensitivity by gel-based detection, biotinylated protein samples can be immunoaffinity purified by streptavidin beads, separated by SDS-PAGE, and analyzed by Silver Stain (Figure 5).
Figure 4.

Western blotting of biotinylated proteins from liver lysates and blood plasma using the indicated antibodies. Wild-type C57BL/6J mouse was injected with pAAV-FLEX-ER-TurboID and supplemented with biotin as negative control for background labeling.
Figure 5.
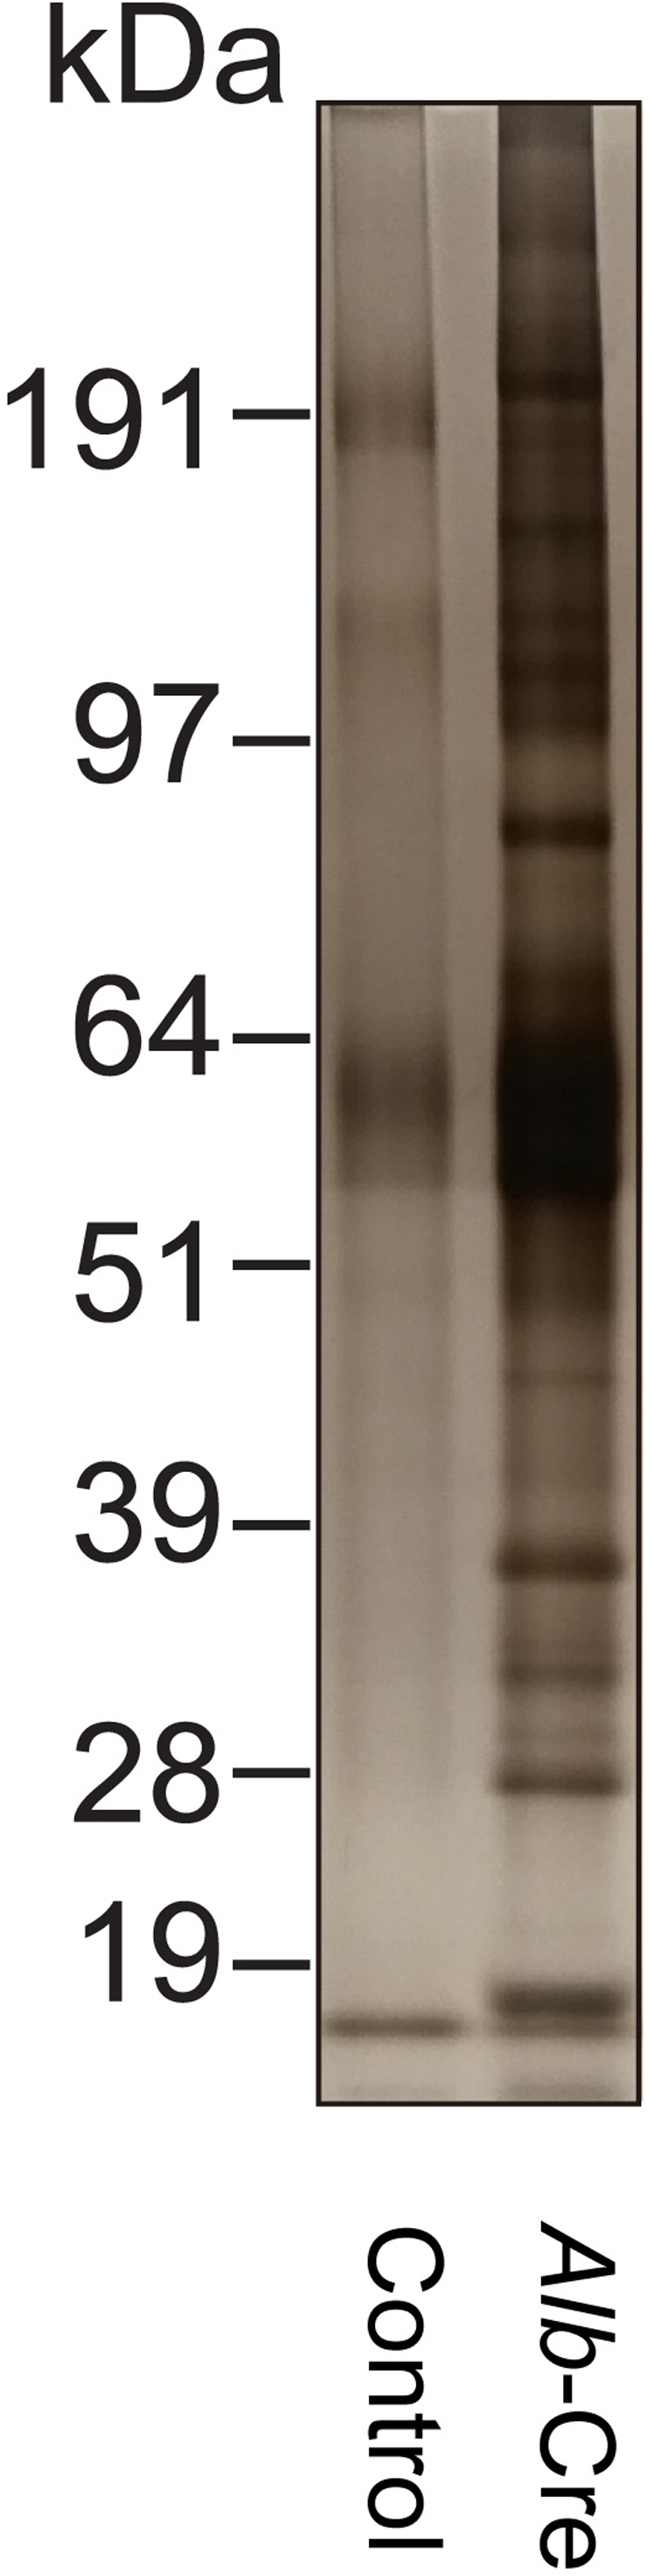
Silver stain of elution from streptavidin-enriched plasma samples from one Albumin-Cre mouse (right) and one wild-type C57BL/6J mouse that was injected with pAAV-FLEX-ER-TurboID and supplemented with biotin as negative control for background labeling (left).
Enrichment of biotinylated plasma proteins
The following steps describe the protocol of streptavidin-based enrichment of biotinylated plasma proteins for proteomic analysis.
-
6.Remove excess biotin from plasma.
-
a.Thaw frozen plasma on ice (200 μL). To remove excess biotin in plasma, dilute 200 μL plasma from a single mouse into 15 mL PBS and concentrate 30-fold using 3 kDa filter tubes by centrifuging (4,000 x g, 1.5 h, 4°C).
-
b.Discard the flow through and repeat the concentration step.
-
c.Discard the flow through, add another 5 mL PBS into the tube and concentrate to a final volume of 500 μL. This represents 9,000-fold final dilution.
-
a.
Note: Pale yellow sediments may be present in the plasma and may block the filter during the centrifugation. Remove the sediments using a pipette tip.
Optional: Further dilution of biotin in plasma can be achieved by repeating the centrifugation step 6(a).
-
7.Wash streptavidin beads.
-
a.Vortex the bottle containing Dynabeads MyOne Streptavidin T1 magnetic beads for 1 min.
-
b.Using a 1 mL pipette tip, transfer 200 μL bead slurry into eppendorf tubes placed on a magnetic rack. Wait 10s until all the beads are fully attached to the wall.CRITICAL: Take out the beads immediately after vortex to ensure the same amount of beads are used for each sample.
-
c.Remove supernatant with 200 μL pipette tips. Add 1 mL washing buffer (50 mM Tris-HCl, 150 mM NaCl, 0.1% SDS, 0.5% sodium deoxycholate, 1% NP-40, 1 mM EDTA, 1× HALT protease inhibitor, 5 mM trolox, 10 mM sodium azide and 10 mM sodium ascorbate) and vortex for 3s. Aspirate washing buffer. Repeat the washing step twice.Note: When making washing buffer stock, add every component excluding 1× HALT protease inhibitor. Add protease inhibitor fresh. The washing buffer stock can be stored in a cold room (4°C) for a few months.
-
d.Remove supernatant and resuspend beads in a 100 μL washing buffer.
-
a.
-
8.
Add 500 μL diluted plasma to the washed beads in a 100 μL washing buffer (600 μL volume final) and rotate in a cold room overnight (12–24 h). Biotinylated plasma proteins will bind to streptavidin beads.
-
9.Wash streptavidin beads containing bound biotinylated plasma proteins.
-
a.Place the eppendorf tubes containing streptavidin beads on a magnetic rack and wait 10s until the beads are fully attached to the wall.
-
b.Remove the supernatant using 200 μL pipette tips and save as flow through. Add 1 mL washing buffer. Vortex for 3s and put back on a magnetic rack. Repeat this step.
-
c.Add 1 mL 1M KCl solution. Vortex for 3 s and put back on a magnetic rack.
-
d.Add 1 mL 0.1M Na2CO3 solution. Vortex for 3 s and put back on a magnetic rack.
-
e.Add 1 mL 2M urea in 10 mM Tris-HCl (pH 8.0). Vortex for 3 s and place back on a magnetic rack.Note: This step should not exceed 1min.
-
f.Add 1 mL washing buffer. Vortex for 3s and put back on a magnetic rack. Repeat the wash step once.
-
a.
-
10.Elute biotinylated plasma proteins from beads
-
a.Following the second wash, aspirate wash supernatant completely. Add 60 μL elution buffer (2× NuPAGE™ LDS Sample Buffer supplemented with 20 mM DTT and 2 mM biotin). Vortex and spin down the beads.Note: To make an elution buffer, dissolve 4 mM biotin into a 4× loading buffer by boiling for 10 min and add PBS to make 2× loading buffer with 2 mM biotin. Then dissolve DTT in water to make 500 M stock and Add DTT into the elution buffer to reach 20 mM final DTT concentration. Aliquot elution buffer into 500ul aliquots and store at -80°C for future use (up to six months).
-
b.Boil the beads at 95°C for 10min. Put the tubes back on a magnetic rack and transfer the supernatant into a new tube. In total ∼ 85 μL final eluant containing biotinylated proteins should be recovered.
-
c.Take 5 μL of final eluant and analyze by SDS-PAGE using either a silver stain (ThermoFisher LC6070) or anti-streptavidin blotting. As a control, use 5 μL elution from wild-type C57BL/6J mice (e.g., no cre-mediated recombination) injected with pAAV-FLEX-ER-TurboID and supplemented with biotin water. Successfully enrichment should show much more intense bands in Albumin-Cre mice samples compared to samples from control mice (Figure 5).Pause point: Once successful streptavidin isolation has been confirmed by SDS-PAGE, samples can be frozen at -80°C for long-term storage. Alternatively, proceed with S-trap-based sample processing for proteomic analysis.Note: This streptavidin enrichment protocol is adapted from Branon et al. (2018).
-
a.
S-trap-based proteomic sample processing for biotinylated plasma proteins
The following steps describe the protocol of proteomic analysis of the final eluant obtained in Step 10 using an S-trap spin column.
-
11.Alkylate biotinylated plasma proteins
-
a.Make 0.25M iodoacetamide (IAA) solution by dissolving 23.1 mg IAA into 500 μL water.
-
b.Add 9.6 μL of 0.25 M IAA into 80 μL final eluant obtained in Step 10 and vortex to mix. Place the tube in the dark for 30min.
-
a.
-
12.Bind and wash biotinylated plasma proteins on S-trap columns
-
a.Add 1.1 μL 85% phosphoric acid and vortex to mix. The color should turn from blue to green.
-
b.Add 560 μL bind/wash buffer (add 3 mL 1M TEAB solution into 27 mL methanol and mix) to each tube and vortex to mix.
-
c.Add 150 μL sample into each micro-S-Trap column and spin (4,000×g, 20 s). Discard flow through.
-
d.Rotate the top of the column 180 degrees and repeat step (c) until the whole sample has passed through.
-
e.Add 150 μL bind/wash buffer and spin (4,000×g, 30 s). Discard flow through.
-
f.Rotate the top of the column 180 degrees and repeat step (e) 3 times.
-
g.Transfer the upper part of the column into a new 2 mL eppendorf tube.
-
a.
-
13.Digest biotinylated proteins on S-trap column
-
a.Add 1 μg trypsin into 25 μL of 50mM TEAB solution. Add 25 μL trypsin solution into the S-Trap column. Spin the column briefly and return the solution that passes through the top of the column.
-
b.Close the cap loosely to prevent evaporative loss.CRITICAL: Do not shake! Shaking will greatly impede the digestion performance.
-
c.Digest at 47°C for 90 min.
-
a.
-
14.Elute tryptic peptides
-
a.Add 40 μL of 50mM TEAB and spin (1,000×g, 60 s). Save the flow through.
-
b.Add 40 μL of 0.2% formic acid and spin (1,000×g, 60 s). Save the flow through.
-
c.Add 40 μL of 50% acetonitrile in water + 0.2% formic acid and spin (1,000×g, 60 s). Save the flow through.
-
d.Add 40 μL of 0.2% formic acid and spin (4,000×g, 60 s). Save the flow through.
-
e.Pool eluted peptides by combining the flow through samples. Lyophilize samples and resuspend in 20 μL 0.2% formic acid.
-
a.
Note: This S-Trap protocol is adjusted from Protifi, S-Trap™ micro spin column digestion protocol (http://mass-spec.wp.st-andrews.ac.uk/files/2019/10/S-Trap-method.pdf).
Shotgun liquid chromatography mass spectrometry (LC-MS/MS) analysis of biotinylated plasma proteins
The following steps describe the protocol and parameters of LC-MS/MS runs.
-
15.Set up the nanoflow liquid chromatography conditions.
-
a.Estimate peptide concentration using a NanoDrop Spectrophotometer (Thermo Fisher) with absorbance measurements at 205 nm (A205), or using quantitative peptide colorimetric or fluorometric assays (Pierce).
-
b.Inject ∼1 μg of resuspended peptides on column using a Dionex UltiMate 3000 RPLCnano system (Thermo Fisher) to control and drive the mobile phases (A, water with 0.2% formic acid and B, 100% acetonitrile with 0.2% formic acid).
-
c.Use an integrated loading pump to load peptides onto a trap column (Acclaim PepMap 100 C18, 5-μm particles, 20 mm in length, Thermo Fisher) during the first 6 min of the acquisition. Hold the gradient at an isocratic flow at 0% B during this time.
-
d.At 6.1 min, use the switching pump to move the trap column in line with the analytical column, which is a 50-cm EASY-Spray reversed-phase LC column (inner diameter of 75 μm, packed with 2-μm, 100-Å, PepMap C18 particles, Thermo Fisher).
-
e.Perform gradient elution at 300 nl/min and increase the gradient from 0% to 5% B from 6 to 6.1 min, followed by an increase from 5% to 25% B from 6 to 86 min, an increase from 25% to 90% B from 86 to 94 min, isocratic flow at 90% B from 94 to 102 min and a re-equilibration at 0% for 18 min, for a total analysis time of 120 min.
-
a.
-
16.Set up the mass spectrometer conditions. The instrument described in these steps is an Orbitrap Fusion Tribrid Mass Spectrometer (Thermo Fisher).
-
a.Ionize eluting peptide with an EASY-Spray ionization source (Thermo Fisher) held at +2.2 kV compared to ground. Use the integrated column heater on the EASY-Spray source to hold the column temperature at 45°C.
-
b.Hold the inlet capillary temperature at 275°C.
-
c.Collect survey scans of peptide precursors in the Orbitrap from 350–1500 m/z with an AGC target of 1,000,000, a maximum injection time of 50 ms, and a resolution of 120,000 at 200 m/z.
-
d.Enable Monoisotopic precursor selection for peptide isotopic distributions. Select precursors of Z = 2–5 for data-dependent MS/MS scans for 2s of cycle time.
-
e.Set the dynamic exclusion to 45 s, with a ±10 ppm window set around the precursor monoisotope.
-
f.Use an isolation window of 1 m/z to select precursor ions with the quadrupole.
-
g.Collect MS/MS scans using HCD at a normalized collision energy of 30, with an AGC target of 50,000 and a maximum injection time of 54 ms.
-
h.Perform mass analysis in the Orbitrap with a resolution of 30,000 at 200 m/z and an automatically determined mass range.
-
a.
Expected outcomes
A successful in vivo secretome labeling experiment should show a clear enrichment of cell type-specific biotinylated proteins from blood plasma versus controls that lack viral transduction or biotin administration. As a representative result, an anti-streptavidin Western blot of liver lysates and blood plasma from a hepatocyte secretome labeling experiment is shown in Figure 4, and the heatmap of biotinylated plasma proteins by shotgun proteomics analysis is shown in Figure 6.
Figure 6.

Hierarchical clustering of z-score intensities for biotinylated secretome samples from three Alb-Cre mice (left) and three wild-type C57BL/6J mice that were injected with pAAV-FLEX-ER-TurboID and supplemented with biotin as negative control for background labeling (right). Some of known hepatocyte-derived plasma proteins are listed on the right as positive control. Scale bar: normalized Z-score intensities.
Quantification and statistical analysis
Proteomic data analysis
-
1.
Download MaxQuant (Tyanova et al., 2016a) and Perseus software platforms (Tyanova et al., 2016b) at https://maxquant.org/. This website has excellent resources and documents to aid with setting up MaxQuant searches and using Perseus for data analysis beyond what is described here.
-
2.Set up the MaxQuant search to identify and quantify proteins from LC-MS/MS data.
-
a.Load .RAW MS data files into MaxQuant and label each with the appropriate Experiment name.
-
b.Set group specific parameters to include:
-
i.Type set to “Standard” with a multiplicity of 1.
-
ii.Variable modifications of oxidation of methionine, biotinylation of lysine and protein N-terminal acetylation.
-
iii.Fixed modification of carbamidomethylation of cysteine.
-
iv.Digestion mode as “Specific” with “Trypsin/P” as Enzyme selection and a maximum missed cleavage setting of 2.
-
v.Label-free quantification set to “LFQ” with a minimum ratio count of 2, fast LFQ enabled, minimum number of neighbors set to 3, and average number of neighbors set to 6.
-
vi.Instrument parameters set to 20 ppm and 4.5 ppm for first search MS1 tolerance and main search MS1 tolerance. All other parameters can be left as default settings.
-
i.
-
c.Set global parameters to include:
-
i.A fasta file of the mouse reference proteome database downloaded from uniprot.org (canonical only). MaxQuant will append decoy sequences for false discovery rate (FDR) calculations automatically, as is set by default as “Revert” under the “Advanced” tab. Otherwise use default settings for other parameters in the “Sequences” tab.
-
ii.Enable the “Match between runs” feature under the “Advanced Identification” tab.
-
iii.Set peptide spectral match (PSM) FDR and Protein FDR to 0.01 under the “Identification” tab to ensure filtering of peptide identifications at 1% FDR and to apply a 1% protein FDR.
-
iv.Under the “Protein quantification” tab, specify the minimum ratio count as 2, and enable the requirement for MS/MS for LFQ comparisons under the “Label free quantification” tab.
-
v.Set the FTMS MS/MS match tolerance to 20 ppm under the “MS/MS - FTMS” tab.
-
i.
-
d.Start MaxQuant processing using the number of total cores available on your processing system minus 1. The more cores used, the faster the processing time.
-
e.After MaxQuant processing finishes, inspect data using the output tables and the viewing features within the MaxQuant environment under the “Visualization” tab.
-
a.
-
3.After MaxQuant processing finishes, use Perseus to analyze data.
-
a.Use a generic matrix upload to import the proteinGroups.txt results file from MaxQuant. Each column from the proteinGroups.txt file will appear, which can be sorted into appropriate variable types.
-
i.Set LFQ intensity columns for each sample (will be the names you provided under “Experiment” in the MaxQuant search) as Main variables.
-
ii.Numerical variables should include Peptides, Sequence coverage [%], Mol. weight [kDa], Q-value, Score, and Intensity (a summary value of intensity of a given protein group across all conditions).
-
iii.Categorical variables should include Reverse and Potential contaminants.
-
iv.Text variables should include Protein IDs, Majority Protein IDs, and Fasta headers.
-
i.
-
b.Filter rows based on categorical variables to remove rows (i.e., protein group IDs) that are indicated as potential contaminants and reverse hits. To do this select values that have “+” for the indicated categorical variable and select the “Remove matching rows” mode. This is done individually for each categorical variable, so filtering must be done twice to remove both potential contaminants and reverse hits.
-
i.Depending on your experiment, it is worth checking the potential contaminants for protein groups of interest. This can be done in Perseus prior to filtering or with spreadsheet software (e.g., Microsoft Excel).
-
i.
-
c.Use “Categorical annotation rows” to name replicates of each experimental group with the same name. This enables further statistical processing.
-
d.Under the “Basic” tab, transform main column data (i.e., LFQ intensity values) from base 10 numbers into log2 space.
-
e.Check distributions using the histogram visualization tool to ensure log2 LFQ intensity distributions approximate normal distributions.
-
f.Filter rows based on valid values. This can depend on the experiment and expected outcomes. Here, proteins are expected to be detected in more than one replicate of a given experimental condition, but are not necessarily expected to be detected across multiple experimental conditions. In this case, require 2 or more valid values in at least one group designated in the groups set in the Categorical annotation rows step (3c above).
-
g.Replace missing values using imputation from a normal distribution. Default settings of a distribution width of 0.3 and a downshift of 1.8 are usually acceptable.
-
h.Perform ANOVA using the “Multiple-sample tests” window under the “Tests” tab. Recommended settings use an S0 value of 1, a permutation-based FDR set at 5% (0.05) with 250 randomizations for multiple testing corrections.
-
i.Filter rows based on the categorial column of “ANOVA Significant” to keep matching rows with the “+” indicator.
-
j.Under the “Normalization” tab, perform Z-score processing for protein groups calculated to be significant by ANOVA.
-
k.Perform hierarchical clustering (under the “Clustering/PCA” tab) using default settings (Figure 6). Ensure replicates from experimental conditions clustered together.
-
l.If desired, Perseus can also be used to perform pairwise comparisons using two-sample t-tests and volcano plots, perform principal component analyses if desired, and to calculate Fisher exact tests to determine enriched features (e.g., gene ontology terms).
-
a.
Limitations
Although the protocol described here is the only methodology reported to date that enables cell type-specific secretome profiling in a mouse, there remain limitations. First, the proximity biotinylation occurs on lysine residues. Secreted proteins or peptide fragments lacking lysines may not be identified in the data. Second, we estimate this method has sensitivity of ∼100 pg/mL from blood plasma based on the identification of several very low abundance hormones and ectodomain shed receptors (e.g., hepatic LIFR ectodomain, ∼100 pg/mL). While this is comparable to that of other state-of-the-art technologies currently available for multiplexed plasma proteomics, there may be potentially important, very low abundance proteins that are not captured with this approach. Third, a cell’s secreted proteins may not enter the bloodstream but stay within the interstitial fluid to function locally as paracrine or autocrine signals. We have not yet benchmarked the performance of this methodology to identify these types of secretory proteins in mice. Finally, we use a three-day biotin supplementation protocol. While this labeling time can be reduced to one day or even several hours, rapid secretome changes that occur on the minutes timescale would not be detectable.
Troubleshooting
Problem 1
Low biotinylation signal by Western blot (step 5)
Potential solution
There may be multiple causes of low biotinylation signal, including: (1) Poor viral transduction. Increase viral dose (e.g., 1012GC/mL) or transduction time (e.g., 2 months), or for other cell types beyond hepatocytes consider different AAV serotypes suitable for the cell type of interest; (2) poor biotin delivery. Increase biotin availability by combining both water supplementation and intraperitoneal injection as described above, or consider longer labeling times; (3) Low resolution of streptavidin antibody. Consider using a more sensitive detection method. We have observed the streptavidin Western blotting to be the least sensitive method and the shotgun proteomics to be the most sensitive method for detection of biotinylated secretomes, with silver staining of streptavidin-purified blood plasma of intermediate sensitivity.
Problem 2
High variability in secretome biotinylation across mice (step 5)
Potential solution
We have found that the differences in labeling efficiency between mice often results from variable transduction efficiencies and TurboID expression across animals. We recommend preparing extra animals for each experiment and choose animals that have similar TurboID expression for final analysis.
Problem 3
Low yield of biotinylated proteins after streptavidin enrichment (step 10)
Potential solution
Non-specific binding of plasma proteins onto streptavidin beads can sometimes impede the enrichment efficiency. Increasing the number of wash steps or the wash stringency to reduce background binding. We have also observed batch effect in streptavidin beads; consider using a new batch of streptavidin beads when strong non-specific binding is observed.
Problem 4
Low intensity of the mass spectrometry signal (steps 15 and 16)
Potential solution
We recommend semi-quantifying the eluted peptides after streptavidin enrichment by running a silver stain and comparing with a known amount of BSA standard. Also, we recommend semi-quantifying peptide amounts following S-trap digestion using a NanoDrop spectrophotometer (Thermo Fisher) or colorimetric or fluorometric peptide assays (Pierce). Inject ∼1 ug peptides, or all available material if total amount is less, for a single LC-MS/MS acquisition.
Problem 5
Enrichment of proteins in wild-type C57BL/6J mice (Proteomic data analysis step 3)
Potential solution
We have found that sometimes a subset of proteins are enriched in wild-type C57BL/6J mice. This may be due to leaky expression of ER-TurboID in the liver or plasma protein contamination during proteomic sample preparation. We recommend removing these proteins from the list of cell type-specific secreted proteins.
Resource availability
Lead contact
Further information and requests for resources and reagents should be directed to and will be fulfilled by the lead contact, Jonathan Z. Long (jzlong@stanford.edu)
Materials availability
Plasmids generated in this study have been deposited to Addgene, pAAV-FLEX-ER-TurboID, 160857. All unique/stable reagents generated in this study are available from the lead contact with a completed Materials Transfer Agreement.
Acknowledgments
We thank members of the Long and Bertozzi labs for helpful discussions. We gratefully acknowledge the staff at the Penn Vector Core for the production of AAVs. This work was supported by the US National Institutes of Health (DK124265 and DK130641 to J.Z.L. and K00CA21245403 to N.M.R.) and the Stanford Diabetes Research Center (P30DK116074).
Author contributions
L.X.C. and W.W. prepared the samples and performed the experiments; W.W. and N.M.R. analyzed the data; W.W, N.M.R., and J.Z.L. wrote the manuscript; and J.Z.L. and C.R.B. supervised the project.
Declaration of interests
The authors declare no competing interests.
Footnotes
Supplemental information can be found online at https://doi.org/10.1016/j.xpro.2021.101014.
Contributor Information
Wei Wei, Email: wwbiomed@stanford.edu.
Nicholas M. Riley, Email: nmriley@stanford.edu.
Jonathan Z. Long, Email: jzlong@stanford.edu.
Data and code availability
All proteomic data generated here are publicly available on ProteomeXchange under project accession no. PXD021602. Processed proteomic datasets are provided in Wei et al. (2021).
References
- Branon T.C., Bosch J.A., Sanchez A.D., Udeshi N.D., Svinkina T., Carr S.A., Feldman J.L., Perrimon N., Ting A.Y. Efficient proximity labeling in living cells and organisms with TurboID. Nat. Biotechnol. 2018;36:880–887. doi: 10.1038/nbt.4201. [DOI] [PMC free article] [PubMed] [Google Scholar]
- JoVE Science Education Database. Lab Animal Research Blood Withdrawal II. JoVE. 2021 [Google Scholar]
- Long C., Amoasii L., Mireault A.A., McAnally J.R., Li H., Sanchez-Ortiz E., Bhattacharyya S., Shelton J.M., Bassel-Duby R., Olson E.N. Postnatal genome editing partially restores dystrophin expression in a mouse model of muscular dystrophy. Science. 2016;351:400–403. doi: 10.1126/science.aad5725. [DOI] [PMC free article] [PubMed] [Google Scholar]
- Tyanova S., Temu T., Cox J. The MaxQuant computational platform for mass spectrometry-based shotgun proteomics. Nat. Protoc. 2016;11:2301–2319. doi: 10.1038/nprot.2016.136. [DOI] [PubMed] [Google Scholar]
- Tyanova S., Temu T., Sinitcyn P., Carlson A., Hein M.Y., Geiger T., Mann M., Cox J. The Perseus computational platform for comprehensive analysis of (prote)omics data. Nat. Methods. 2016;13:731–740. doi: 10.1038/nmeth.3901. [DOI] [PubMed] [Google Scholar]
- Wei W., Riley N.M., Yang A.C., Kim J.T., Terrell S.M., Li V.L., Garcia-Contreras M., Bertozzi C.R., Long J.Z. Cell type-selective secretome profiling in vivo. Nat. Chem. Biol. 2021;17:326–334. doi: 10.1038/s41589-020-00698-y. [DOI] [PMC free article] [PubMed] [Google Scholar]
- Zeng X., Ye M., Resch J.M., Jedrychowski M.P., Hu B., Lowell B.B., Ginty D.D., Spiegelman B.M. Innervation of thermogenic adipose tissue via a calsyntenin 3beta-S100b axis. Nature. 2019;569:229–235. doi: 10.1038/s41586-019-1156-9. [DOI] [PMC free article] [PubMed] [Google Scholar]
Associated Data
This section collects any data citations, data availability statements, or supplementary materials included in this article.
Supplementary Materials
Data Availability Statement
All proteomic data generated here are publicly available on ProteomeXchange under project accession no. PXD021602. Processed proteomic datasets are provided in Wei et al. (2021).