

Abstract
Brown and beige fat are specialized for energy expenditure by dissipating energy from glucose and fatty acid oxidation as heat. While glucose and fatty acid metabolism have been extensively studied in thermogenic adipose tissues, the involvement of amino acids in regulating adaptive thermogenesis remains little studied. Here, we report that asparagine supplementation in brown and beige adipocytes drastically upregulated the thermogenic transcriptional program and lipogenic gene expression, so that asparagine‐fed mice showed better cold tolerance. In mice with diet‐induced obesity, the asparagine‐fed group was more responsive to β3‐adrenergic receptor agonists, manifesting in blunted body weight gain and improved glucose tolerance. Metabolomics and 13C‐glucose flux analysis revealed that asparagine supplement spurred glycolysis to fuel thermogenesis and lipogenesis in adipocytes. Mechanistically, asparagine stimulated the mTORC1 pathway, which promoted expression of thermogenic genes and key enzymes in glycolysis. These findings show that asparagine bioavailability affects glycolytic and thermogenic activities in adipose tissues, providing a possible nutritional strategy for improving systemic energy homeostasis.
Keywords: asparagine, brown adipocytes, glycolysis, mTORC1, thermogenesis
Subject Categories: Metabolism, Signal Transduction
Adipocyte energy dissipation is fueled by the non‐essential amino acid asparagine via an mTORC1‐4E‐BP1‐glycolysis axis.

Introduction
Thermogenic adipocytes, brown and beige fat cells, are characterized by dissipating energy derived from glucose and fatty acid oxidation as heat. Therefore, they regulate whole‐body glucose and lipid homeostasis in both mice and humans. It remains largely unknown whether amino acids can be used as substrates for adaptive thermogenesis or take part in modulating thermogenic activity of brown adipose tissue (BAT). Recently, branched‐chain amino acids (BCAAs) have been identified to nourish BAT oxidation and thermogenesis. A BAT‐specific ablation of the BCAAs transporter into mitochondria results in decreased thermogenesis and systemic glucose intolerance (Yoneshiro et al, 2019). N‐acyl amino acids activate mitochondrial uncoupling respiration in a UCP1‐independent manner and increase energy expenditure in vivo (Long et al, 2016). Intravenous amino acid mixture administration is utilized to prevent anesthesia‐induced hypothermia (Yamaoka et al, 2006). BCAAs alone are critical but not sufficient for the attenuation of hypothermia, implying other amino acids may also contribute to the process (Yamaoka, 2008).
Asparagine (Asn) is a non‐essential amino acid but becomes essential for tumor cells when glutamine is depleted (Zhang et al, 2014; Pavlova et al, 2018). It promotes tumor cell proliferation and epithelial‐to‐mesenchymal transition (Krall et al, 2016; Knott et al, 2018). Most cells express asparagine synthetase (ASNS) to catalyze the synthesis of L‐asparagine from aspartic acid and glutamine, whereas leukemic blasts lack Asns expression. Clinical acute lymphoblastic leukemia (ALL) treatment includes administration of asparaginase (ASNase) to deplete serum asparagine, leading to compromised protein synthesis in leukemic cells and ultimately cell death (Radadiya et al, 2020). However, hyperglycemia and hypertriglyceridemia are reported as two common side effects of such ASNase treatment for 20 and 67% of ALL patients, respectively (Parsons et al, 1997; Lowas et al, 2009). In addition, circulating asparagine level is inversely associated with metabolic syndrome (Ntzouvani et al, 2017) and obesity in both adults (Bagheri et al, 2019) and children (Butte et al, 2015). Acute cold exposure and cold acclimation significantly increased BAT asparagine as well as other amino acids level in mice (Okamatsu‐Ogura et al, 2020). In this regard, we speculate that asparagine may play a role in regulating BAT function and systemic energy homeostasis.
To verify the hypothesis, we altered asparagine availability to explore the effects on adipose tissue metabolism. Supplementation of asparagine exogenously augments thermogenic gene expression and improves cold tolerance in mice. Removal of circulating asparagine by ASNase results in compromised thermogenic activity and aberrant lipolysis in adipose tissues. Intriguingly, asparagine bioavailability determines robustness of glycolysis to fuel thermogenesis and lipogenesis essentially through the activation of mechanistic target of rapamycin complex 1 (mTORC1) cascade. In short, we identified a novel role for asparagine to modulate adaptive thermogenesis and glycolysis in adipose tissues.
Results
Exogenous asparagine activates adipocyte thermogenic program
To explore the role of asparagine availability in brown adipocytes, we supplemented asparagine in culture medium during adipocyte differentiation in vitro. The formulation of DMEM contains a mixture of essential amino acids with each concentration ranging from 0.1 to 0.8 mM (Appendix Table S1), but is devoid of asparagine, which provides a clean system to evaluate exogenous asparagine effects. Asparagine supplementation did not affect the clonal expansion of brown preadipocytes in the early differentiation stage (Appendix Fig S1A). Interestingly, 0.5 mM or higher dose of asparagine increased the expression of thermogenesis (Ucp1, Cox7a, Cidea, Pgc1α) as well as lipogenesis gene (Acaca, Dgat2, Pparγ), but had little effect on genes involved in fatty acid β‐oxidation (Cpt1b) and lipolysis (Atgl, Hsl) (Fig 1A and B, Appendix Fig S1B) in immortalized brown fat cells. The asparagine‐induced increase in UCP1 and PPARγ expression was comparable to the effects of β3‐adrenergic agonist CL316243 (Fig EV1A). Simultaneously, asparagine‐treated brown adipocytes demonstrated significantly higher oxygen consumption rate (Fig 1C). As a control, supplementation of non‐proteinogenic D‐asparagine or individual supplementation of non‐essential amino acids, which are absent in the culture medium (alanine, aspartic acid, or glutamic acid), did not enhance the expression of UCP1 (Appendix Fig S1C and D). Although aspartic acid can be converted to asparagine by ASNS in cells, the transport of aspartic acid into mammalian cells is inefficient (Sullivan et al, 2018), which may explain the lack of effect of exogenous aspartic acid. PPARγ protein level was elevated by asparagine addition, yet the overall process of adipogenesis seemed unaffected, as was shown by similar size of lipid droplet (Appendix Fig S1E) and comparable levels of general adipogenic marker (Cebpα, Adipoq, and Fabp4) (Appendix Fig S1F). When asparagine was supplemented to the culture medium in the last 2 days of differentiation (day 4–6), considerably elevated UCP1 and PGC1α levels could still be observed, while PPARγ was not affected (Fig 1D). PGC1α is a well‐defined coactivator that can transcriptionally upregulate thermogenic program (Shapira & Seale, 2019). Knockdown of Pgc1α completely abrogated asparagine‐induced Ucp1, Cidea, or Cox7a1 gene expression, indicating the asparagine induction of thermogenic program was more reliant on Pgc1α, but not Pparγ (Figs 1E and EV1B). Similar effects could be recapitulated in primary brown and inguinal white adipocyte (Figs 1F and EV1C).
Figure 1. Increased asparagine availability promotes thermogenic and lipogenic program in brown adipocytes.

- Immortalized brown preadipocytes were induced to mature adipocytes with supplementation of asparagine during differentiation. Gene expression was analyzed on differentiation day 6.
- Gene expression analyzed by quantitative PCR in brown adipocytes that were fed with or without 1 mM asparagine as in (A). n = 3 independent experiments.
- Oxygen consumption rate measured by Clark electrodes for mature brown adipocytes as in (B). n = 4 independent experiments.
- Left: UCP1, PGC1α, and PPARγ protein levels were analyzed in brown adipocytes (day 6). Cells were supplemented with 1 mM asparagine from day 4 to day 6. Right: quantification of protein levels. n = 3 biological replicates.
- Preadipocytes bearing the shRNA targeting Pgc1α were induced differentiation with or without 1 mM asparagine. Protein expression was analyzed on day 6. n = 3 biological replicates.
- Primary preadipocyes isolated from mice BAT were induced to differentiation in DMEM media with or without 1 mM asparagine. Left: UCP1 and PPARγ protein levels were analyzed on day 6. Right: quantification of protein levels. n = 3 biological replicates.
- Brown preadipocytes were infected by lentiviral shRNAs against Asns. Cells were differentiated in culture media with or without 1 mM asparagine. Western blot was performed on day 6.
Data information: Data represent means ± SEM. *P < 0.05; **P < 0.01; unpaired two‐tailed Student’s t‐test.
Source data are available online for this figure.
Figure EV1. Thermogenic program is regulated by asparagine availability.

- UCP1 and PPARγ protein levels in brown adipocytes treated with CL316243 for 12 h or cultured in media containing 1 mM asparagine during the process of adipogenesis.
- Preadipocytes bearing the shRNA targeting Pgc1α were induced differentiation with or without 1 mM asparagine. Gene mRNA expression levels were analyzed on day 6. n = 3 biological replicates.
- Stromal vascular fractions (SVF) isolated from mouse inguinal WAT (iWAT) were induced to beige adipocytes with or without 1 mM asparagine in the culture media. Left: Western blot detected UCP1 and PPARγ protein levels. Right: quantification of UCP1 and PPARγ protein levels. n = 3 biological replicates.
- Western blot detected protein levels in Asns knockdown brown adipocytes. Lentiviral shRNAs against Asns were infected to preadipocytes, following standard induction to mature adipocytes. Cells were treated with or without CL316243 for 12 h on day 6.
- Brown preadipocytes were infected by lentiviral shRNAs against Asns. Cells were differentiated in culture media with or without 1 mM asparagine. Quantitative PCR was performed on day 6 for gene expression analysis. n = 3 independent experiments.
Data information: Data represent mean ± SEM. *P < 0.05; **P < 0.01; ***P < 0.001; unpaired two‐tailed Student’s t‐test.
Source data are available online for this figure.
Asparagine is a non‐essential amino acid that can be synthesized from aspartic acid and glutamine with ASNS catalyzing the reaction in an ATP‐dependent manner (Lomelino et al, 2017). Asns is expressed in most mammalian cells (Lomelino et al, 2017), with the most abundant expression in brains and relatively higher levels in brown, inguinal, and epididymal fat tissues (Appendix Fig S2A). High‐fat diet feeding suppressed, while cold exposure and β3‐adrenergic agonist induced Asns expression in epididymal white adipose tissue (WAT) and/or BAT (Appendix Fig S2B–E). Knockdown of Asns with lentiviral shRNAs had no effect on the expression of adipogenic markers or triglyceride accumulation in brown fat cells (Appendix Fig S2F and G), but greatly abolished UCP1 protein expression (Fig EV1D) and mRNA levels of Cidea, Cox7a, and Pparγ (Fig EV1E). Supplement of asparagine could moderately rescue the defect of these genes (Figs 1G and EV1E). On the other hand, knockdown of glutamic pyruvic transaminase (Gpt), which is responsible for synthesizing alanine by transferring an amino group from glutamic acid to pyruvate, had marginal effects on Ucp1 and Pparγ expression (Appendix Fig S2H and I).
Asparagine feeding nourishes thermogenesis in adipose tissues
Adipose tissue acquires asparagine either through intake of circulating asparagine or through asparagine biosynthesis. The circulating asparagine pool can be augmented by feeding mice with asparagine in drinking water or by asparagine intraperitoneal injection (i.p.). The protein levels of two asparagine transporters SLC38A2 and SLC1A5 in BAT were comparable to those in other organs under basal conditions and were further induced by cold challenge (Fig EV2A and B). Mice supplemented with asparagine in their drinking water for 3 weeks significantly increased both serum and BAT asparagine contents (Fig 2A–C). Asparagine supplementation did not affect water and food intake, body weights, and adipose tissue masses as compared to the control group (Fig EV2C–F). However, asparagine‐fed mice showed better cold tolerance when subjected to acute 4°C exposure (Fig 2D). Fluctuation in circulating amino acid was reported to affect pancreas insulin secretion (Schmid et al, 1989), yet we did not observe any difference in serum insulin or triglyceride levels between the asparagine‐fed and control groups (Fig 2E and F). Nevertheless, enhanced expression of thermogenic and lipogenic gene was clearly shown in both BAT and inguinal WAT after one dose of CL316243 injection (Fig EV2G and H). Asparagine‐fed mice displayed a significant decrease in Asns expression in BAT, reflecting reduced needs for endogenous asparagine synthesis (Fig EV2G). The expression of characteristic beige adipocyte markers, Cd137 and Tbx1, was also upregulated in inguinal WAT (Fig EV2H). Commensurate with the mRNA levels, asparagine‐fed mice showed higher PGC1α, UCP1, and PPARγ protein expression in adipose tissues (Fig 2G). Moreover, brown adipocytes had smaller lipid droplets, and much more beige adipocytes with multilocular lipid droplets appeared in inguinal white fat depots (Fig 2H). Indirect calorimetry assay revealed that mice supplemented with asparagine had increased heat generation, oxygen consumption, carbon dioxide production, and respiration exchange rate (RER), at both basal and CL316,243‐stimulated states (Fig 2I and J).
Figure EV2. Asparagine supply affects adipose tissue metabolism.
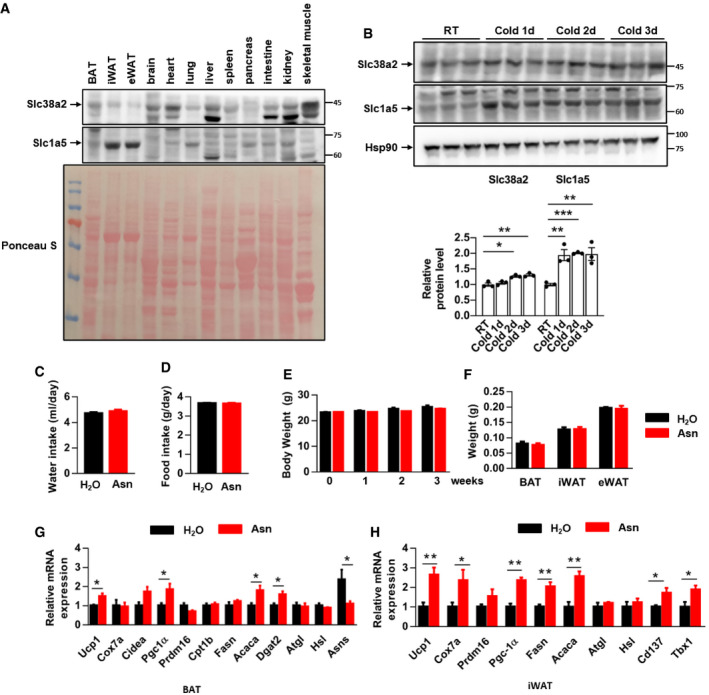
- Western blot detected SLC38A2 and SLC1A5 protein levels in mouse tissues. Ponceau S staining was used as loading control. Shown was a representative picture from three independent experiments.
- SLC38A2 and SLC1A5 protein levels in mouse BAT after cold exposure for 1–3 days (top panel). The bottom panel shows the quantification of SLC38A2 and SLC1A5 protein. n = 3 independent samples. RT: room temperature (23°C).
- C57BL/6 male mice were fed asparagine in drinking water (1.5 g/l) for 3 weeks. They consumed similar amount of water as control mice. n = 5 mice each group.
- Chow diet food intake in mice of (C). n = 5 mice each group.
- Body weight was measured every week for mice in (C). n = 5 mice each group.
- Weight of fat tissues in mice from (C). n = 5 mice each group.
- Mice in (C) were injected with one dose of CL316243 (1 mg/kg body weight). Gene expression in BAT was analyzed 24 h after injection. n = 5 mice each group.
- Gene expression in inguinal WAT from mice in (G). n = 5 mice each group.
Data information: Data represent means ± SEM. *P < 0.05; **P < 0.01; ***P < 0.001; unpaired two‐tailed Student’s t‐test.
Source data are available online for this figure.
Figure 2. Increase of asparagine supply stimulates adipose thermogenesis in vivo .

-
AC57BL/6J male mice fed on a chow diet drank water with or without asparagine at a concentration of 1.5 g/l for 3 weeks. Mice were acutely exposed to 4°C for 6 h to measure rectal temperature or intraperitoneally (i.p.) injected CL316243 (1 mg/kg body weight) for one time for other assays.
-
BMice serum amino acid concentration after 3‐week asparagine feeding. n = 5 mice each group.
-
CAsparagine content in BAT of mice in (B). n = 5 mice each group.
-
DRectal temperature was measured when mice in (A) were challenged to 4°C. n = 5 mice each group.
-
E, FSerum insulin (E) and triglyceride (F) concentration was assayed in mice 24 h after one dose of CL316243 injection. n = 5 mice each group.
-
GUCP1 and PPARγ protein levels in BAT and inguinal WAT (iWAT) from mice in (E).
-
HRepresentative pictures of BAT and inguinal WAT (iWAT) hematoxylin and eosin staining from mice in (E). Scale bar: 20 μm for BAT, 50 μm for iWAT.
-
I, JMice supplemented with asparagine in drinking water for 3 weeks were subjected to the indirect calorimetry analysis at both basal (I) and CL316243‐stimulated (J) states. n = 5 mice each group.
Data information: Data represent means ± SEM. *P < 0.05; **P < 0.01; ***P < 0.001; unpaired two‐tailed Student’s t‐test.
Source data are available online for this figure.
Likewise, 2‐week asparagine intraperitoneal injection drastically boosted the thermogenic program in brown and inguinal fat tissue (Appendix Fig S3A–C), and Pparγ level was remarkably elevated in BAT, inguinal, and epididymal WAT (Appendix Fig S3B–D). The substantial induction of PPARγ in adipose tissues led us query whether supply of asparagine might also increase PPARγ abundance in other metabolic organs. Western blot revealed that PPARγ protein level was not affected in liver and skeletal muscle (Appendix Fig S3E and F). In contrast, alanine or glutamate intraperitoneal injection did not affect UCP1 and PPARγ levels in BAT (Appendix Fig S3G).
Conversely, when ASNase was used to wipe out serum asparagine (Fig 3A and B), mice were hypothermic during acute cold challenge and expressed considerably less PGC1α, UCP1, and PPARγ in BAT and inguinal WAT (Fig 3C and D). Serum aspartic acid level in ASNase group was increased about 3‐fold due to asparagine catabolism by ASNase (Fig 3B). Unexpectedly, ASNase treatment led to increase in another 7 amino acids in serum (Fig EV3A), possibly due to the depleted asparagine compromising these amino acids exchange with asparagine to import into cells (Krall et al, 2016). The food intake and weights of adipose tissues were similar between the control and ASNase‐treated mice (Fig EV3B and C). However, similar to patients subjected to ASNase treatment, decreased serum asparagine was associated with higher serum triglyceride levels in these mice (Fig 3E). The repressed thermogenic gene expression and upregulated lipolysis gene level in adipose tissues may contribute to the hyperlipidemia upon depleting serum asparagine (Fig EV3D–F). Furthermore, larger size of lipid droplets was seen in brown adipocytes and there was scare of beige adipocytes appearance in inguinal WAT (Fig 3F). Despite the depletion of serum asparagine had profound impact on gene expression in adipose tissues, systemic metabolic parameters measured by indirect calorimetry were not changed (Fig EV3G and H). We assumed that some other tissues or organs probably underwent enhanced metabolism as compensation. Collectively, these data suggest a role of asparagine in modulating thermogenesis and lipid metabolism in brown and beige fat tissues.
Figure 3. Asparaginase‐treated mice are cold‐intolerant and hypertriglyceridemia.

- C57BL/6J male mice were injected with asparaginase (ASNase) or PBS every 3 days for 2 weeks. Mice were exposed to 4°C for 6 h before sacrifice for gene expression analysis.
- Serum asparagine and aspartic acid concentration in mice of (A). n = 5 mice each group.
- Rectal temperature in mice of (A) during cold exposure. n = 5 mice each group.
- BAT and inguinal WAT (iWAT) gene expression analysis in mice of (A).
- Serum triglyceride levels in mice of (A). n = 5 mice each group.
- Hematoxylin and eosin staining of BAT, inguinal WAT (iWAT), and epididymal WAT (eWAT) of mice in (A).
Data information: Data represent means ± SEM. *P < 0.05; **P < 0.01; ***P < 0.001; unpaired two‐tailed Student’s t‐test.
Source data are available online for this figure.
Figure EV3. Decreased serum asparagine level was associated with deregulated lipolysis.

-
ASerum amino acid concentration from mice injected with asparaginase (2 U/g body weight) or phosphate‐buffered saline (PBS). Mice were exposed to 4°C for 6 h before sacrifice. n = 5 mice each group.
-
BFood intake of mice in (A). n = 5 mice each group.
-
CWeight of fat tissues in mice of (A). n = 5 mice each group.
-
D–FGene expression in BAT (D), inguinal WAT (E), and epididymal WAT (F) from mice in (A). n = 5 mice each group.
- G, H
Data information: Data represent means ± SEM. *P < 0.05; **P < 0.01; unpaired two‐tailed Student’s t‐test.
Obese mice supplemented with asparagine are sensitive to β3 adrenergic agonist
Obesity impairs β3‐adrenergic agonist‐dependent brown and beige adipocyte activation (Kubo et al, 2019; Shin et al, 2019). Next, we asked whether asparagine supplementation enhanced adipose tissue response to β3‐adrenergic agonist in diet‐induced obese mice. Mice administered asparagine in drinking water were fed a high‐fat diet for 14 weeks (Fig 4A). During this period, there was no significant difference in body weight gain (Fig 4B) between the asparagine‐fed and control groups. Then, CL316243 was injected daily in the following 4 weeks. A blunted weight gain and slightly but significantly improved systemic glucose tolerance were observed in the asparagine‐fed group (Fig 4B and C). Asparagine feeding even significantly decreased serum insulin and triglyceride levels (Fig 4D and E), indicating improved systemic glucose and lipid homeostasis. A reduction in epididymal WAT mass was shown in asparagine‐fed mice (Fig 4F). Hematoxylin and eosin staining displayed less lipid storage in fat tissues (Fig 4G). Moreover, asparagine‐fed group exhibited elevated UCP1 expression, but similar PPARγ levels in both brown and inguinal fat tissues (Fig 4H).
Figure 4. Feeding asparagine sensitized diet‐induced obese mice to β3‐adrenergic agonist.

- C57BL/6J male mice fed on a high‐fat diet drank water with or without asparagine (1.5 g/l) for 18 weeks. In the last 4 weeks, mice were injected CL316243 daily (0.5 mg/kg body weight).
- Body weight of mice in (A) during the high‐fat diet feeding. n = 5 mice each group.
- Glucose tolerance test was performed after a high‐fat diet feeding for 17 weeks in mice of (A). n = 5 mice each group.
- Serum insulin levels in mice of (A). n = 5 mice each group.
- Serum triglyceride levels in mice of (A). n = 5 mice each group.
- Fat mass weight in mice of (A). n = 5 mice each group.
- Representative histology pictures for BAT, inguinal WAT (iWAT), and epididymal WAT (eWAT) in mice of (A).
- BAT and inguinal WAT (iWAT) UCP1 and PPARγ protein levels in mice of (A).
Data information: Data represent means ± SEM. *P < 0.05; **P < 0.01; unpaired two‐tailed Student’s t‐test.
Source data are available online for this figure.
Asparagine stimulates glycolysis in brown and beige adipocytes
The sympathetic nervous system plays an essential role in adipose thermogenesis. Acute cold exposure stimulates sympathetic nerves to release noradrenaline, which activates the β‐adrenergic receptors on adipocytes to spur lipolysis and thermogenic respiration through PKA signaling cascade (Zeng et al, 2015; Morrison, 2016). To explore how asparagine administration enhances thermogenesis in adipose tissues, we analyzed the expression of tyrosine hydroxylase (Th), the rate‐limiting enzyme in catecholamine biosynthesis, β‐adrenergic receptors (Adrb), and phosphorylated PKA substrates in mice injected asparagine. Actually, there was no significant difference in Th, Adrb levels, and PKA responsiveness between the asparagine and control groups (Appendix Fig S4A–C).
There is a possibility that asparagine is converted to aspartic acid or oxaloacetate in brown adipocytes for anaplerosis of tricarboxylic acid cycle (TCA cycle), although it is generally considered that mammalian cells lack enough ASNase activity (Pavlova et al, 2018). To gain an insight in metabolic adaption elicited by asparagine supply, we conducted metabolomics analysis with particular attention focused on energy metabolism (Fig 5A, Appendix Table S2). Strikingly, the levels of some intermediate of glycolysis, including fructose‐6‐phosphate (F6P) and fructose‐1,6‐bisphosphate (F‐1,6‐BP), had about 2‐fold rise in brown fat cells provided with asparagine (Fig 5B). Glucose‐6‐phosphate (G6p), the product of the first reaction in glycolysis, also tended to be higher in the asparagine group relative to the control (P = 0.06) (Fig 5B). In contrast, the levels of TCA cycle intermediates, such as cis‐aconitate and isocitrate, had about 20–30% decrease upon asparagine treatment. The level of acetyl‐CoA tended to be lower in the asparagine group (P = 0.06, Fig EV4A). The significantly increased F6P and F‐1,6‐BP levels probably resulted from enhanced glycolysis or declined reactions downstream of aldolase. To pinpoint the underlying reasons, we measured the expression of the key enzymes of glycolysis and TCA cycle (Fig 5C). Asparagine treatment markedly increased the protein levels of hexokinase 2 (HK2), phosphofructokinase (PFK), and pyruvate kinase (PK), the three rate‐limiting enzymes of glycolysis, in primary and immortalized brown fat cells, brown and inguinal white fat tissues (Figs 5D–F and EV4B). Such treatment did not affect the key enzyme levels in TCA cycle (Fig 5E and F). In comparison, exhausting serum asparagine by ASNase abolished HK2, PFKL, and PKM protein expression, with marginal effect on citrate synthase (Cs), isocitrate dehydrogenase (Idh3a), and oxoglutarate dehydrogenase (Ogdh) levels (Fig 5G). Feeding asparagine to cultured adipocytes from day 4 to 6 was also able to promote PKM expression (Fig EV4C). Knocking down Ucp1 in brown adipocytes did not impede asparagine‐induced PKM expression, indicating that the enhanced glycolysis was independent of activated thermogenesis (Appendix Fig S4D). The existence of a subgroup of glycolytic beige adipocytes has been reported recently (Chen et al, 2019). We determined the expression of their marker genes, and no induction was observed in inguinal WAT of asparagine‐fed mice (Appendix Fig S4E). Interestingly, the enhanced expression of glycolysis enzymes was refined to adipose tissues, as the expression of HK2 and PKM in livers and muscles was not changed by asparagine feeding (Appendix Fig S4F and G). All these data indicate that asparagine supplementation might inspire glycolysis in adipose tissues by upregulating the expression of the key enzymes.
Figure 5. Supplementation of asparagine spurs glycolysis in adipocytes.

-
AHeat map of metabolite relative levels in brown fat cells treated with or without 1 mM asparagine.
-
BQuantification of representative metabolic intermediates of glycolysis in brown fat cells as in (A). n = 3 independent experiments.
-
CSchematic illustration of key enzymes in glycolysis and tricarboxylic acid (TCA) cycle.
-
D–GImmunoblot detection of the glucose transporters, glycolysis, and TCA key enzymes in primary (D) and immortalized brown fat cell line (E), BAT from mice fed asparagine (F) and injected asparaginase (G). Asparagine was supplemented to cells during differentiation. The HSP90 data shown in Fig 5G are a redisplay of Fig 3D as the same samples and experimental conditions were probed.
Data information: Data represent means ± SEM. *P < 0.05; unpaired two‐tailed Student’s t‐test.
Source data are available online for this figure.
Figure EV4. Asparagine increases glucose utilization by brown adipocytes.

- The relative levels of metabolic intermediates in tricarboxylic acid cycle in asparagine‐treated cells compared to the control cells. n = 3 independent experiments.
- Mice were fed asparagine in water for 3 weeks as described in Fig 2A. Western blot analyzed glycolytic gene expression in inguinal WAT 24 h after one dose of CL316,243 injection.
- Asparagine was added to cultured medium from differentiation day 4 to 6. PKM protein level was determined by Western blot on day 6.
- Schematic illustration of atom mapping for [U‐13C] glucose tracing into glycolysis and the TCA cycle.
- Intracellular abundance of 13C‐isotopologue metabolites in TCA cycle in brown adipocytes cultured in the absence or presence of 1 mM asparagine during differentiation. n = 5 independent experiments.
Data information: Data represent means ± SEM. *P < 0.05; **P < 0.01; ***P < 0.001; unpaired two‐tailed Student’s t‐test.
Source data are available online for this figure.
To determine whether the increase in glycolysis enzymes coordinates with an increase in glucose flux, we further analyzed metabolite levels following a 30‐min pulse of [U‐13C]‐glucose in mature brown adipocytes after asparagine supplementation (Fig 6A). Indeed, in vitro glucose tracing revealed a 1.5‐ to 4‐fold increase in 13C‐glucose‐derived metabolites, including 13C6‐F6P, 13C3‐dihydroxyacetone phosphate, 13C3‐glyceraldehyde 3‐phosphate, 13C3‐lactate, 13C3‐glycerol 3‐phosphate, 13C3‐alanine, and 13C3‐serine. Remarkably, the level of 13C6‐F‐1,6‐BP was 8‐fold higher relative to the control cells (Fig 6B). TCA cycle metabolites, such as 13C5‐citrate, 13C2‐fumarate, 13C2‐ and 13C3‐malate, 13C3‐ and 13C4‐oxaloacetate, were all significantly increased in asparagine group as compared to the control (Fig EV4D and E). In line with the intracellular metabolomics assay, there was less glucose and more lactate detected in the culture media of asparagine‐treated cells (Fig 6C and D). These results clearly demonstrated that exogenous asparagine promoted glycolysis and even glycolysis‐derived glycerol 3‐phosphate, serine, and alanine synthesis in brown adipocytes.
Figure 6. Addition of asparagine leads to increased 13C‐glucose flux in brown adipocytes.

-
ABrown adipocytes were induced differentiation with or without 1 mM asparagine. [U‐13C] glucose was added into culture media on differentiation day 6 for 30 min. Then, tracing analysis from U‐13C glucose was performed.
-
BIntracellular abundance of 13C‐isotopologue metabolites downstream of glycolysis in brown adipocytes. n = 5 independent experiments.
-
C, DQuantification of glucose (C) and lactate (D) concentration from media. The media was collected after incubated with mature brown adipocytes for 48 h. n = 3 independent experiments in (C), n = 6 independent experiments in (D).
Data information: Data represent means ± SEM. *P < 0.05; **P < 0.01; ***P < 0.001; unpaired two‐tailed Student’s t‐test.
Activation of mTORC1 is responsible for enhanced thermogenesis and glycolysis
To understand the mechanism by which asparagine availability affects thermogenesis and glycolysis, we first examined mRNA levels of glycolysis enzymes after asparagine supplementation. Surprisingly, the mRNA levels of these key enzymes were not changed in either cultured adipocytes or brown fat tissues by asparagine availability (Appendix Fig S5A–C). This implied that asparagine affected the expression of these enzymes at post‐transcriptional level.
Asparagine has been reported to regulate uptake of amino acids as an amino acid exchange factor (Krall et al, 2016). We therefore quantified intracellular amino acid levels using LC‐MS/MS methods. Asparagine supplementation to brown adipocytes effectively raised intracellular asparagine level by 48%, accompanied by a global increase of most amino acids (Fig 7A). However, the level of aspartic acid was similar between the asparagine‐treated and control group, implying that asparagine was not directly catabolized to aspartic acid in brown fat cells (Fig 7A). Extensive research has shown that amino acids including asparagine activate mTORC1 signaling (Godard et al, 2007; Zoncu et al, 2011; Krall et al, 2016; Meng et al, 2020). In most previous studies, amino acids activated mTORC1 pathway in cells that were starved of amino acids as a prerequisite. We wondered whether asparagine was capable of stimulating mTORC1 cascade without amino acid starvation. Detection of downstream targets of mTORC1 displayed a drastic increase in phosphorylation of eukaryotic translation initiation factor 4E binding protein 1 (4E‐BP1) and a slight increase in phosphorylation of ribosomal protein S6 kinase (S6K) in cultured brown adipocytes, no matter asparagine was added for only 2 days (day 4–6) or during the whole process of differentiation (Fig 7B, Appendix Fig S5D). Intriguingly, the brown adipose tissue rather than livers and muscles from asparagine‐fed mice had activated mTORC1 pathway (Fig 7C, Appendix Fig S5E), indicating that BAT was more responsive to exogenous asparagine in terms of mTORC1 activation. On the other hand, ASNase treatment remarkably suppressed mTORC1 signaling in BAT, as indicated by decrease in phosphorylation of 4E‐BP1 and S6K (Fig 7D). However, addition of arginine, another well‐known mTORC1 trigger, to the culture medium, or feeding arginine or methionine to mice could not inspire mTORC1 activity or glycolytic gene expression in brown adipocytes or BAT (Fig EV5A and B).
Figure 7. Asparagine facilitates glycolysis via mTORC1 activation and exchange of amino acids.

-
AQuantification of intracellular amino acid levels in brown fat cells (day 6) treated with or without 1 mM asparagine. n = 4 independent experiments.
-
B–DmTORC1 pathway activity was analyzed by immunoblotting for the phosphorylation of 4E‐BP1 and S6K in brown adipocytes (B), BAT from mice fed asparagine (C) or asparaginase (D). (B) Asparagine was added to cultured media from day 4 to day 6.
-
EA Click‐iT AHA labeling assay to detect newly synthesized glycolytic enzymes. The level of HSP90 in total cell lysates was used as a loading control.
-
FBrown preadipocytes were induced to differentiation with or without 1 mM asparagine. Rapamycin (75 nM) was added to cells for 48 h. Then, Western blot detected protein expression on day 6.
-
GBrown preadipocytes were knocked down Raptor following standard induction to mature adipocytes with or without asparagine supplementation. Protein expression analysis was performed on day 6.
Data information: Data represent means ± SEM. *P < 0.05; **P < 0.01; ***P < 0.001; unpaired two‐tailed Student’s t‐test.
Source data are available online for this figure.
Figure EV5. BAT mTORC1 pathway is sensitive to alteration of asparagine availability.

- Western blot of immortalized brown adipocytes that were cultured in the presence of various concentrations of exogenous arginine.
- C57BL6/J male mice drank water supplemented with arginine (12.6 g/l) or methionine (3 g/l) for 3 weeks. Mice were exposed to 4°C for 6 h following protein expression analysis.
- Lentiviral shRNAs targeting Raptor were transduced into brown preadipocytes following standard differentiation. Knockdown efficiency was determined by QPCR on day 6. n = 3 independent experiments.
- PPARγ protein level in cells of (C).
- Lentivirus carrying 4E‐BP1‐4A mutant infected brown preadipocytes. Cells were induced to mature adipocytes with or without supply of 1 mM asparagine. Western blot was carried out on day 6.
- C57BL6/J male mice were exposed to 4°C for 6 h. mTORC1 activity was denoted by p‐4EBP1 and p‐S6K levels. n = 3 mice each group.
Data information: Data represent means ± SEM. **P < 0.01; unpaired two‐tailed Student’s t‐test.
Source data are available online for this figure.
mTORC1 is a major signaling pivot for cell proliferation, metabolism, and protein translation (Ben‐Sahra & Manning, 2017). We have excluded the possibility that feeding asparagine to differentiating brown adipocytes affects cell growth (Appendix Fig S1A). A Click‐iT AHA (azidohomoalanine) labeling assay to detect newly synthesized proteins revealed that the translation efficiency of glycolytic enzymes was considerably increased in brown fat cells supplemented with asparagine (Fig 7E). Additionally, when mTORC1 signaling was blocked by rapamycin, asparagine’s effect on glycolysis key enzymes was abolished, accompanied by the diminished induction of PGC1α and UCP1 (Fig 7F). Herein, the steady level of phosphorylated AKT (Ser474) suggested that rapamycin did not affect mTORC2 activity. To further exclude the involvement of mTORC2, we knocked down the mTORC1‐specific component Raptor by 50% (Fig EV5C). Deletion of Raptor did not disturb adipogenesis as indicated by comparable level of PPARγ (Fig EV5D), but diminished asparagine‐induced glycolytic and thermogenic gene expression (Fig 7G), further confirming the importance of activated mTORC1 in this process. The family of 4E‐BPs inhibits cap‐dependent translation initiation through binding to eukaryotic translation initiation factor 4E (eIF4E). Phosphorylation of 4E‐BPs releases eIF4E, resulting in the initiation of translation. A 4E‐BP1 4A construct that mutated the four phosphorylation sites (T37/T46/S65/T70) blocked 4E‐BP1 phosphorylation upon asparagine addition. At the same time, the induction of HK2 and PKM was declined (Fig EV5E). Collectively, our data demonstrated that mTORC1 activity in BAT was sensitive to asparagine bioavailability, and asparagine‐mTORC1 axis upregulated thermogenesis and glycolysis in a transcriptional and post‐transcriptional manner.
Discussion
Dietary proteins induce higher ratings of thermogenesis than equicaloric amounts of carbohydrates or fat (Westerterp, 2004). The increase in energy expenditure results from protein and urea synthesis and gluconeogenesis (Keller, 2011). Relatively high amount of protein ingestion (> 15% of energy intake from protein) is therefore suggested for treatment of obesity (Veldhorst et al, 2008). Different amino acid components may cause diverse nutrient‐related responses. Glutamine replenishes α‐ketoglutarate for the TCA cycle or sustains fatty acid synthesis via reductive carboxylation to form citrate especially under low‐oxygen conditions (Metallo et al, 2011; Sun & Denko, 2014; Yoo et al, 2020). Lower glutamine levels were reported to be in WAT from obese individuals and associate with activated pro‐inflammatory pathway via O‐linked N‐acetylglucosamine modification (Petrus et al, 2020). Alanine gavage to lean or diet‐induced obese mice improved glucose tolerance by robustly inspiring AMPK signaling cascade in skeletal muscles (Adachi et al, 2018). Serine binds and activates pyruvate kinase M2 (PKM2) to control glycolytic flux in cancer cells (Chaneton et al, 2012). It also supports mitochondrial dynamics, respiration, and translation by generation of ceramide or N‐formylmethionine‐tRNA (Gao et al, 2018; Minton et al, 2018; Tani et al, 2018).
Asparagine is reported to be an amino acid exchange factor and be capable of activating mTORC1. mTORC1 is a primary cellular signaling hub that sensors amino acid availability and exerts metabolic control (Ben‐Sahra & Manning, 2017). Activation of mTORC1 was reported to be essential for BAT recruitment and browning (Labbe et al, 2016; Liu et al, 2016). We verified acute cold challenge spurred mTORC1 cascade in BAT, supporting that mTORC1 probably played a part in heat generation in BAT (Fig EV5F). mTORC1 signaling increases Pgc1α gene transcription in muscles (Cunningham et al, 2007), and our data demonstrated that asparagine‐activated mTORC1 also promoted Pgc1a transcription in adipocytes. The Ucp1 induction by asparagine was completely abolished when Pgc1α was knocked down.
Asparagine stimulated mTORC1 to boost glycolysis, manifested by increased glucose metabolic flux in brown adipocytes. Glucose has recently been proposed to act as the main energetic source for thermogenesis in adipose tissues especially in the fed condition (Nguyen et al, 2020). In response to isoproterenol, brown fat cells enhance glycolysis to support thermogenesis, as evidenced by a 3‐fold increase in intracellular lactate levels (Nguyen et al, 2020). Pyruvate produced from glycolysis could be transported into mitochondria for TCA cycle, providing electrons to electron transport chain to power thermogenesis (Nguyen et al, 2020). Deletion of mitochondrial pyruvate carrier 1 (Mpc1) by Ucp1‐Cre transgene results in impaired cold adaptation (Panic et al, 2020). Glucose feeds de novo lipogenesis by providing acetyl‐CoA and glycerol moiety of triglycerides as well (Yu et al, 2002; Held et al, 2018), which restores intracellular lipid content burnt by thermogenesis. Knockdown of glucose transporters Glut1, Glut4 or enzymes Hk2, Pkm reduced thermogenesis and oxygen consumption in brown adipocytes (Winther et al, 2018).
Increased glycolysis observed in asparagine‐supplemented adipocytes is driven by the elevated protein expression of HK2, PFK, and PKM, but no alteration in their mRNA levels, being consistent with the effects of mTORC1 signaling on protein translation. We surmise that addition of asparagine promotes glycolysis enzyme expression in at least three ways. First, asparagine‐facilitated amino acid exchange provides ample building blocks for protein translation. Then, phosphorylated 4E‐BP1 and S6K promotes glycolytic enzyme translation (Proud, 2014). Lastly, increased glucose oxidation may append a supply of ATP to power protein synthesis. Supplement of asparagine elevated the expression of lipid synthesis genes in cultured adipocytes and adipose tissues from mice fed a chow diet, which could be a manifestation following enhanced glycolysis. In terms of how the asparagine availability regulates mTORC1 activities in thermogenic adipose tissues but leaving out of liver and muscle, it is worth further exploration in the future.
In this study, both the asparagine feeding and ASNase administration to mice were systemic intervention. The observed effects in adipose tissues cannot rule out the possibility of secondary to other tissues. In light of in vitro adipocytes respond to asparagine supplementation autonomously, the effects of asparagine on mice is at least partly derived from adipose tissues.
Taken together, increased systemic pool of asparagine promotes thermogenesis and enhances glycolysis and lipogenesis through asparagine‐mTORC1 axis in BAT. Asparagine supplementation may serve as a promising nutritional strategy to improve systemic energy homeostasis.
Materials and Methods
Animal studies
All studies involving animal experimentation were approved by the Fudan University Shanghai Medical College Animal Care and Use Committee. Male C57BL6 mice were purchased from the Lingchang Biotechnology Company Limited (Shanghai, China). All the mice were maintained on a standard rodent chow diet with 12‐h light and dark cycles. Water and food intake was measured daily for individually caged mouse for 1 week. Asparagine (Sangon, China; A694341‐0100) supplement was performed by mice drinking water dissolved L‐asparagine at 1.5 g/l for 3 weeks or injected intraperitoneally daily (L‐asparagine in phosphate‐buffered saline) at 200 mg/kg body weight for 2 weeks. As a control, mice were administered arginine hydrochloride (12.6 g/l) or methionine (3 g/l) in drinking water for 3 weeks, or intraperitoneally injected alanine or glutamate every other day at 300 mg/kg body weight for 3 weeks. For L‐asparaginase study, mice were administered L‐asparaginase (ASNase, ProSpec; ENZ‐287) at 2 U/g body weight every 3 days for 2 weeks through intraperitoneal injections. For acute cold exposure, 8‐week‐old male C57BL/6J mice housed at 22°C were transferred to 4°C for indicated time, and rectal temperature was monitored every hour using the animal electronic thermometer (ALT‐ET03; Shanghai Alcott Biotech CO.LTD). High‐fat diet (HFD) with 60% of calorie from fat was purchased from Research Diets (D12492). HFD feeding was started when mice were 5‐week‐old. β3‐adrenergic agonist CL316,243 (Sigma, C5976) was administered by daily intraperitoneal injection at a dose of 0.5 mg/kg body weight after a 14‐week high‐fat diet feeding. For glucose tolerance test (GTT), glucose was administered by intraperitoneal injection at 2 g/kg body weight after 16‐h fasting. For indirect calorimetry assay, mice were placed in the Columbus Instruments Comprehensive Lab Animal Monitoring System and allow to acclimate. The energy expenditure and respiration were monitored at basal and after one dose of CL316243 injection (1 mg/kg body weight).
Serum insulin, triglyceride, and amino acid levels
Serum insulin level was measured through an insulin ELISA kit (Mercodia, Uppsala). Serum triglyceride level was analyzed using a triglyceride assay kit (Applygen Technologies Inc., China; E1003‐125) according to the manufacturer’s instruction. Serum amino acid levels and the asparagine level in BAT were quantified using the LC‐MS/MS method reported previously (Wang et al, 2017).
Adipocyte culture and differentiation
The immortalized brown preadipocytes, primary brown or beige adipocytes are cultured and induced differentiation following the standard protocol as described previously (Pan et al, 2015; Zhao et al, 2020). Briefly, confluent brown preadipocytes (day 0) were induced by DMEM (Thermo Fisher, 11965092) containing 10% FBS, 20 nM insulin, 1 nM T3, 0.5 μM dexamethasone, 0.5 mM isobutylmethylxanthine, and 0.125 mM indomethacin for 48 h (day 0–2). Then, cells were switched to DMEM with 10% FBS, 20 nM insulin, 1 nM T3 for another 4 days (day 2–6) to get fully differentiated. Beige adipocytes differentiation is similar except DMEM/F‐12 medium, 850 nM insulin instead, and CL316,243 (10 μM) treatment for 12 h on day 6. Generally, asparagine (1 mM) was added to culture media during adipocyte differentiation (day 0–6), otherwise as indicated. In some experiments, differentiated brown adipocytes were treated with CL316243 (10 μM) for 12 h, or rapamycin (75 nM, Meilunbio, 53123‐88‐9) for 48 h as indicated.
Metabolomics
The brown preadipocytes were induced to mature adipocytes following the standard protocol with or without asparagine (1 mM) supplement during the differentiation. The mature adipocytes were then washed twice with PBS, and metabolites were extracted using cold methanol/acetonitrile/H2O (2:2:1, v/v/v). The intracellular metabolites and amino acids were analyzed by LC‐MS/MS (Applied Protein Technology, Shanghai, China).
U‐13C glucose flux and LC‐MS/MS analysis
Mature brown adipocytes on day 6 were washed twice with PBS, and media was changed to glucose‐free DMEM (Thermo Fisher, A14430‐01) containing 10% FBS, 20 nM insulin, 1 nM T3. U‐13C glucose (Sigma, 389374) was added to media at a final concentration 25 mM for 30 min. Asparagine (1 mM) was supplemented to the experimental group in the whole process. Then, aspirate the medium completely and 80% methanol (cooled to −80°C) was added to the plates following incubation at −80°C for 20 min. Polar metabolites were separated by centrifugation at 4,000g for 10 min. The supernatant was lyophilized for LC‐MS/MS analysis performed by Shanghai MetMass Inc. (Yuan et al, 2019).
Oxygen consumption assays
Cultured brown adipocytes supplemented with or without L‐asparagine were collected by trypsinization. Cellular respiration was measured in 1 ml phosphate‐buffered saline containing 25 mM glucose, 1 mM pyruvate, and 2% BSA with a Clark‐type oxygen electrode (Oxygraph+ system, Hansatech). Data were normalized by total protein content.
Lactate and glucose content in culture media
Fresh differentiation media was replenished for brown adipocytes on day 4. The media was collected on day 6 to determine the lactate and glucose content by biochemical assay kits (A019‐2‐1 for lactate, Jiancheng Bioengineering Institute, China; E1010 for glucose, Applygen Technologies, China).
Quantification of de novo synthesized proteins
Click‐iT AHA (L‐azidohomoalanine) metabolic labeling kit (Molecular Probes, C10102, C10276) was used to quantify nascent protein synthesis (Dieterich et al, 2006). Briefly, cultured adipocytes (day 3) in 6‐cm dish were washed once with PBS and incubated with methionine‐free medium (21013, Thermo Fisher) at 37°C for 1 h to deplete methionine reserves. Then, AHA was added to media and incorporated into nascent protein replacing methionine. After 4‐h labeling, cells were collected and biotin alkyne (B10185, Molecular Probes) was used to capture AHA‐labeled proteins. The biotin conjugates can subsequently be pulled down by streptavidin beads (11205D, Thermo Fisher) and analyzed by Western blot.
Plasmids and viruses
Short hairpin RNA (shRNA) lentiviral constructs were generated using psp‐108 vector (Addgene). Viruses were prepared by co‐transfection along with plasmids pMD2.G (Addgene) and psPAX2 (Addgene) into HEK293T cells. The viral supernatant was collected 48 h after transfection. Lentiviruses expressing shRNAs infect preadipocytes following selection with puromycin, and cells were plated for differentiation. ShRNA‐targeting sequences are listed in Appendix Table S3. Human 4EBP1‐4A cDNA was synthesized by mutating T36, T47, S65, and T70 residues to alanines (Thoreen et al, 2012) and then inserted into a lentiviral vector.
RNA preparation and quantitative real‐time PCR
Total RNA from cells and tissues was isolated using TRIzol (invitrogen), and reverse transcription was performed with HiScipt® Q RT SuperMix (Vazyme) following the manufacture’s protocol. Quantitative real‐time PCR (QPCR) was executed with ViiA 7 Real‐Time PCR system (Applied Biosystems). Primer sequences are in Appendix Table S3.
Western blot analysis
Cell or tissue samples were homogenized in cell lysis buffer [150 mM NaCl, 0.5% Triton X‐100, 5% glycerol, 50 mM Tris–HCl (pH 7.5), 1 mM PMSF and protease inhibitor mixture cocktail (Roche)]. Then, lysates were subjected to centrifugation at 13,000g for 10 min at 4°C. Supernatants were quantified for protein concentration and analyzed by Western blotting with indicated antibodies. The antibody information is listed in Appendix Table S4.
Data analysis
Data are presented as mean ± standard error of the means. Differences between two groups were assessed using the unpaired two‐tailed Student's t‐test. Statistical significance was shown as *P < 0.05, **P < 0.01, or ***P < 0.001.
Author contributions
YX and TS performed most experiments, acquired data, and analyzed data. XC, LY, QZ, Xiaoxuan X, and Q‐QT aided in some experiments. QW, Xiaoyan X, and HT performed the LC‐MS/MS assay for serum and BAT amino acid analysis. DP designed the project, supervised the study, and wrote the manuscript. All authors contributed to manuscript revisions.
Conflict of interest
The authors declare that they have no conflict of interest.
Supporting information
Appendix
Expanded View Figures PDF
Source Data for Expanded View and Appendix
Source Data for Figure 1
Source Data for Figure 2
Source Data for Figure 3
Source Data for Figure 4
Source Data for Figure 5
Source Data for Figure 7
Acknowledgements
We thank Dr. Yi Liu, Fudan University, for reagents and critical suggestion on the manuscript, and Dr. He Huang, Fudan University, for help in metabolic flux analysis. We acknowledge financial supports from National Key R&D Program of China (2018YFA0800401, 2017YFC0906800), Shanghai Municipal Science and Technology Major Project (2017SHZDZX01), and National Natural Science Foundation of China (NSFC) (32171140, 31970710, 31770839, and 31821002).
The EMBO Journal (2021) 40: e108069.
Contributor Information
Huiru Tang, Email: huiru_tang@fudan.edu.cn.
Dongning Pan, Email: dongning.pan@fudan.edu.cn.
Data availability
This study includes no data deposited in external repositories.
References
- Adachi Y, De Sousa‐Coelho AL, Harata I, Aoun C, Weimer S, Shi X, Gonzalez HK, Takahashi H, Doherty C, Noguchi Y et al (2018) l‐Alanine activates hepatic AMP‐activated protein kinase and modulates systemic glucose metabolism. Mol Metab 17: 61–70 [DOI] [PMC free article] [PubMed] [Google Scholar]
- Bagheri M, Djazayery A, Farzadfar F, Qi L, Yekaninejad MS, Aslibekyan S, Chamari M, Hassani H, Koletzko B, Uhl O (2019) Plasma metabolomic profiling of amino acids and polar lipids in Iranian obese adults. Lipids Health Dis 18: 94 [DOI] [PMC free article] [PubMed] [Google Scholar]
- Ben‐Sahra I, Manning BD (2017) mTORC1 signaling and the metabolic control of cell growth. Curr Opin Cell Biol 45: 72–82 [DOI] [PMC free article] [PubMed] [Google Scholar]
- Butte NF, Liu Y, Zakeri IF, Mohney RP, Mehta N, Voruganti VS, Goring H, Cole SA, Comuzzie AG (2015) Global metabolomic profiling targeting childhood obesity in the Hispanic population. Am J Clin Nutr 102: 256–267 [DOI] [PMC free article] [PubMed] [Google Scholar]
- Chaneton B, Hillmann P, Zheng L, Martin A, Maddocks O, Chokkathukalam A, Coyle JE, Jankevics A, Holding FP, Vousden KH et al (2012) Serine is a natural ligand and allosteric activator of pyruvate kinase M2. Nature 491: 458–462 [DOI] [PMC free article] [PubMed] [Google Scholar]
- Chen Y, Ikeda K, Yoneshiro T, Scaramozza A, Tajima K, Wang Q, Kim K, Shinoda K, Sponton CH, Brown Z et al (2019) Thermal stress induces glycolytic beige fat formation via a myogenic state. Nature 565: 180–185 [DOI] [PMC free article] [PubMed] [Google Scholar]
- Cunningham JT, Rodgers JT, Arlow DH, Vazquez F, Mootha VK, Puigserver P (2007) mTOR controls mitochondrial oxidative function through a YY1‐PGC‐1alpha transcriptional complex. Ntaure 450: 736–740 [DOI] [PubMed] [Google Scholar]
- Dieterich DC, Link AJ, Graumann J, Tirrell DA, Schuman EM (2006) Selective identification of newly synthesized proteins in mammalian cells using bioorthogonal noncanonical amino acid tagging (BONCAT). Proc Natl Acad Sci USA 103: 9482–9487 [DOI] [PMC free article] [PubMed] [Google Scholar]
- Gao X, Lee K, Reid MA, Sanderson SM, Qiu C, Li S, Liu J, Locasale JW (2018) Serine availability influences mitochondrial dynamics and function through lipid metabolism. Cell Rep 22: 3507–3520 [DOI] [PMC free article] [PubMed] [Google Scholar]
- Godard P, Urrestarazu A, Vissers S, Kontos K, Bontempi G, van Helden J, Andre B (2007) Effect of 21 different nitrogen sources on global gene expression in the yeast Saccharomyces cerevisiae. Mol Cell Biol 27: 3065–3086 [DOI] [PMC free article] [PubMed] [Google Scholar]
- Held NM, Kuipers EN, van Weeghel M, van Klinken JB, Denis SW, Lombes M, Wanders RJ, Vaz FM, Rensen P, Verhoeven AJ et al (2018) Pyruvate dehydrogenase complex plays a central role in brown adipocyte energy expenditure and fuel utilization during short‐term beta‐adrenergic activation. Sci Rep 8: 9562 [DOI] [PMC free article] [PubMed] [Google Scholar]
- Keller U (2011) Dietary proteins in obesity and in diabetes. Int J Vitam Nutr Res 81: 125–133 [DOI] [PubMed] [Google Scholar]
- Knott S, Wagenblast E, Khan S, Kim SY, Soto M, Wagner M, Turgeon MO, Fish L, Erard N, Gable AL et al (2018) Asparagine bioavailability governs metastasis in a model of breast cancer. Nature 554: 378–381 [DOI] [PMC free article] [PubMed] [Google Scholar]
- Krall AS, Xu S, Graeber TG, Braas D, Christofk HR (2016) Asparagine promotes cancer cell proliferation through use as an amino acid exchange factor. Nat Commun 7: 11457 [DOI] [PMC free article] [PubMed] [Google Scholar]
- Kubo N, Kawahara M, Okamatsu‐Ogura Y, Miyazaki Y, Otsuka R, Fukuchi K (2019) Evaluation of glucose uptake and uncoupling protein 1 activity in adipose tissue of diabetic mice upon beta‐adrenergic stimulation. Mol Imaging Biol 21: 249–256 [DOI] [PubMed] [Google Scholar]
- Labbe SM, Mouchiroud M, Caron A, Secco B, Freinkman E, Lamoureux G, Gelinas Y, Lecomte R, Bosse Y, Chimin P et al (2016) mTORC1 is required for brown adipose tissue recruitment and metabolic adaptation to cold. Sci Rep 6: 37223 [DOI] [PMC free article] [PubMed] [Google Scholar]
- Liu D, Bordicchia M, Zhang C, Fang H, Wei W, Li JL, Guilherme A, Guntur K, Czech MP, Collins S (2016) Activation of mTORC1 is essential for beta‐adrenergic stimulation of adipose browning. J Clin Invest 126: 1704–1716 [DOI] [PMC free article] [PubMed] [Google Scholar]
- Lomelino CL, Andring JT, McKenna R, Kilberg MS (2017) Asparagine synthetase: function, structure, and role in disease. J Biol Chem 292: 19952–19958 [DOI] [PMC free article] [PubMed] [Google Scholar]
- Long JZ, Svensson KJ, Bateman LA, Lin H, Kamenecka T, Lokurkar IA, Lou J, Rao RR, Chang MR, Jedrychowski MP et al (2016) The secreted enzyme PM20D1 regulates lipidated amino acid uncouplers of mitochondria. Cell 166: 424–435 [DOI] [PMC free article] [PubMed] [Google Scholar]
- Lowas SR, Marks D, Malempati S (2009) Prevalence of transient hyperglycemia during induction chemotherapy for pediatric acute lymphoblastic leukemia. Pediatr Blood Cancer 52: 814–818 [DOI] [PubMed] [Google Scholar]
- Meng D, Yang Q, Wang H, Melick CH, Navlani R, Frank AR, Jewell JL (2020) Glutamine and asparagine activate mTORC1 independently of Rag GTPases. J Biol Chem 295: 2890–2899 [DOI] [PMC free article] [PubMed] [Google Scholar]
- Metallo CM, Gameiro PA, Bell EL, Mattaini KR, Yang J, Hiller K, Jewell CM, Johnson ZR, Irvine DJ, Guarente L et al (2011) Reductive glutamine metabolism by IDH1 mediates lipogenesis under hypoxia. Nature 481: 380–384 [DOI] [PMC free article] [PubMed] [Google Scholar]
- Minton DR, Nam M, McLaughlin DJ, Shin J, Bayraktar EC, Alvarez SW, Sviderskiy VO, Papagiannakopoulos T, Sabatini DM, Birsoy K et al (2018) Serine catabolism by SHMT2 is required for proper mitochondrial translation initiation and maintenance of formylmethionyl‐tRNAs. Mol Cell 69: 610–621 [DOI] [PMC free article] [PubMed] [Google Scholar]
- Morrison SF (2016) Central neural control of thermoregulation and brown adipose tissue. Auton Neurosci 196: 14–24 [DOI] [PMC free article] [PubMed] [Google Scholar]
- Nguyen HP, Yi D, Lin F, Viscarra JA, Tabuchi C, Ngo K, Shin G, Lee AY, Wang Y, Sul HS (2020) Aifm2, a NADH oxidase, supports robust glycolysis and is required for cold‐ and diet‐induced thermogenesis. Mol Cell 77: 600–617 [DOI] [PMC free article] [PubMed] [Google Scholar]
- Ntzouvani A, Nomikos T, Panagiotakos D, Fragopoulou E, Pitsavos C, McCann A, Ueland PM, Antonopoulou S (2017) Amino acid profile and metabolic syndrome in a male Mediterranean population: a cross‐sectional study. Nutr Metab Cardiovasc Dis 27: 1021–1030 [DOI] [PubMed] [Google Scholar]
- Okamatsu‐Ogura Y, Kuroda M, Tsutsumi R, Tsubota A, Saito M, Kimura K, Sakaue H (2020) UCP1‐dependent and UCP1‐independent metabolic changes induced by acute cold exposure in brown adipose tissue of mice. Metabolism 113: 154396 [DOI] [PubMed] [Google Scholar]
- Pan D, Huang L, Zhu LJ, Zou T, Ou J, Zhou W, Wang YX (2015) Jmjd3‐mediated H3K27me3 dynamics orchestrate brown fat development and regulate white fat plasticity. Dev Cell 35: 568–583 [DOI] [PMC free article] [PubMed] [Google Scholar]
- Panic V, Pearson S, Banks J, Tippetts TS, Velasco‐Silva JN, Lee S, Simcox J, Geoghegan G, Bensard CL, Vanry T et al (2020) Mitochondrial pyruvate carrier is required for optimal brown fat thermogenesis. Elife 9: e52558 [DOI] [PMC free article] [PubMed] [Google Scholar]
- Parsons SK, Skapek SX, Neufeld EJ, Kuhlman C, Young ML, Donnelly M, Brunzell JD, Otvos JD, Sallan SE, Rifai N (1997) Asparaginase‐associated lipid abnormalities in children with acute lymphoblastic leukemia. Blood 89: 1886–1895 [PubMed] [Google Scholar]
- Pavlova NN, Hui S, Ghergurovich JM, Fan J, Intlekofer AM, White RM, Rabinowitz JD, Thompson CB, Zhang J (2018) As extracellular glutamine levels decline, asparagine becomes an essential amino acid. Cell Metab 27: 428–438 [DOI] [PMC free article] [PubMed] [Google Scholar]
- Petrus P, Lecoutre S, Dollet L, Wiel C, Sulen A, Gao H, Tavira B, Laurencikiene J, Rooyackers O, Checa A et al (2020) Glutamine links obesity to inflammation in human white adipose tissue. Cell Metab 31: 375–390 [DOI] [PubMed] [Google Scholar]
- Proud CG (2014) Control of the translational machinery by amino acids. Am J Clin Nutr 99: 231S–236S [DOI] [PubMed] [Google Scholar]
- Radadiya A, Zhu W, Coricello A, Alcaro S, Richards N (2020) Improving the treatment of acute lymphoblastic leukemia. Biochemistry‐Us 59: 3193–3200 [DOI] [PMC free article] [PubMed] [Google Scholar]
- Schmid R, Schusdziarra V, Schulte‐Frohlinde E, Maier V, Classen M (1989) Role of amino acids in stimulation of postprandial insulin, glucagon, and pancreatic polypeptide in humans. Pancreas 4: 305–314 [DOI] [PubMed] [Google Scholar]
- Shapira SN, Seale P (2019) Transcriptional control of brown and beige fat development and function. Obesity 27: 13–21 [DOI] [PMC free article] [PubMed] [Google Scholar]
- Shin W, Okamatsu‐Ogura Y, Matsuoka S, Tsubota A, Kimura K (2019) Impaired adrenergic agonist‐dependent beige adipocyte induction in obese mice. J Vet Med Sci 81: 799–807 [DOI] [PMC free article] [PubMed] [Google Scholar]
- Sullivan LB, Luengo A, Danai LV, Bush LN, Diehl FF, Hosios AM, Lau AN, Elmiligy S, Malstrom S, Lewis CA et al (2018) Aspartate is an endogenous metabolic limitation for tumour growth. Nat Cell Biol 20: 782–788 [DOI] [PMC free article] [PubMed] [Google Scholar]
- Sun RC, Denko NC (2014) Hypoxic regulation of glutamine metabolism through HIF1 and SIAH2 supports lipid synthesis that is necessary for tumor growth. Cell Metab 19: 285–292 [DOI] [PMC free article] [PubMed] [Google Scholar]
- Tani H, Ohnishi S, Shitara H, Mito T, Yamaguchi M, Yonekawa H, Hashizume O, Ishikawa K, Nakada K, Hayashi JI (2018) Mice deficient in the Shmt2 gene have mitochondrial respiration defects and are embryonic lethal. Sci Rep 8: 425 [DOI] [PMC free article] [PubMed] [Google Scholar]
- Thoreen CC, Chantranupong L, Keys HR, Wang T, Gray NS, Sabatini DM (2012) A unifying model for mTORC1‐mediated regulation of mRNA translation. Nature 485: 109–113 [DOI] [PMC free article] [PubMed] [Google Scholar]
- Veldhorst M, Smeets A, Soenen S, Hochstenbach‐Waelen A, Hursel R, Diepvens K, Lejeune M, Luscombe‐Marsh N, Westerterp‐Plantenga M (2008) Protein‐induced satiety: effects and mechanisms of different proteins. Physiol Behav 94: 300–307 [DOI] [PubMed] [Google Scholar]
- Wang J, Zhou L, Lei H, Hao F, Liu X, Wang Y, Tang H (2017) Simultaneous quantification of amino metabolites in multiple metabolic pathways using ultra‐high performance liquid chromatography with tandem‐mass spectrometry. Sci Rep 7: 1423 [DOI] [PMC free article] [PubMed] [Google Scholar]
- Westerterp KR (2004) Diet induced thermogenesis. Nutr Metab 1: 5 [DOI] [PMC free article] [PubMed] [Google Scholar]
- Winther S, Isidor MS, Basse AL, Skjoldborg N, Cheung A, Quistorff B, Hansen JB (2018) Restricting glycolysis impairs brown adipocyte glucose and oxygen consumption. Am J Physiol Endocrinol Metab 314: E214–E223 [DOI] [PubMed] [Google Scholar]
- Yamaoka I (2008) Modification of core body temperature by amino acid administration. Asia Pac J Clin Nutr 17(Suppl 1): 309–311 [PubMed] [Google Scholar]
- Yamaoka I, Doi M, Nakayama M, Ozeki A, Mochizuki S, Sugahara K, Yoshizawa F (2006) Intravenous administration of amino acids during anesthesia stimulates muscle protein synthesis and heat accumulation in the body. Am J Physiol Endocrinol Metab 290: E882‐E888 [DOI] [PubMed] [Google Scholar]
- Yoneshiro T, Wang Q, Tajima K, Matsushita M, Maki H, Igarashi K, Dai Z, White PJ, McGarrah RW, Ilkayeva OR et al (2019) BCAA catabolism in brown fat controls energy homeostasis through SLC25A44. Nature 572: 614–619 [DOI] [PMC free article] [PubMed] [Google Scholar]
- Yoo HC, Yu YC, Sung Y, Han JM (2020) Glutamine reliance in cell metabolism. Exp Mol Med 52: 1496–1516 [DOI] [PMC free article] [PubMed] [Google Scholar]
- Yu XX, Lewin DA, Forrest W, Adams SH (2002) Cold elicits the simultaneous induction of fatty acid synthesis and beta‐oxidation in murine brown adipose tissue: prediction from differential gene expression and confirmation in vivo . Faseb J 16: 155–168 [DOI] [PubMed] [Google Scholar]
- Yuan M, Kremer DM, Huang H, Breitkopf SB, Ben‐Sahra I, Manning BD, Lyssiotis CA, Asara JM (2019) Ex vivo and in vivo stable isotope labelling of central carbon metabolism and related pathways with analysis by LC‐MS/MS. Nat Protoc 14: 313–330 [DOI] [PMC free article] [PubMed] [Google Scholar]
- Zeng W, Pirzgalska RM, Pereira MM, Kubasova N, Barateiro A, Seixas E, Lu YH, Kozlova A, Voss H, Martins GG et al (2015) Sympathetic neuro‐adipose connections mediate leptin‐driven lipolysis. Cell 163: 84–94 [DOI] [PMC free article] [PubMed] [Google Scholar]
- Zhang J, Fan J, Venneti S, Cross JR, Takagi T, Bhinder B, Djaballah H, Kanai M, Cheng EH, Judkins AR et al (2014) Asparagine plays a critical role in regulating cellular adaptation to glutamine depletion. Mol Cell 56: 205–218 [DOI] [PMC free article] [PubMed] [Google Scholar]
- Zhao Q, Zhang Z, Rong W, Jin W, Yan L, Jin W, Xu Y, Cui X, Tang QQ, Pan D (2020) KMT5c modulates adipocyte thermogenesis by regulating Trp53 expression. Proc Natl Acad Sci USA 117: 22413–22422 [DOI] [PMC free article] [PubMed] [Google Scholar]
- Zoncu R, Efeyan A, Sabatini DM (2011) mTOR: from growth signal integration to cancer, diabetes and ageing. Nat Rev Mol Cell Biol 12: 21–35 [DOI] [PMC free article] [PubMed] [Google Scholar]